


Logs, metrics, and traces: what each signal tells you
Understand the differences between logs, metrics, and traces, where log collection fits, and what it takes to connect a latency alert to the underlying request in Guance.
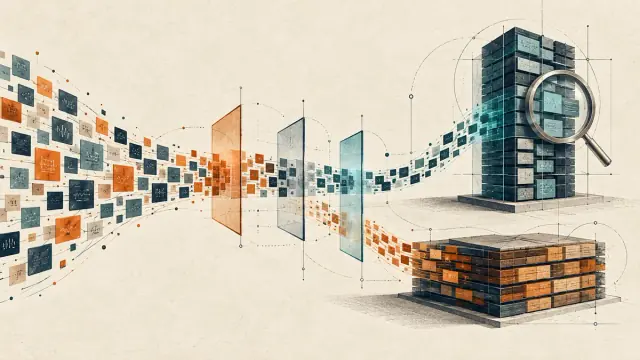
A latency chart can tell you that checkout is getting slower. It cannot, by itself, show whether a particular request waited for inventory, retried a payment, or paused inside the application. That is where another signal becomes useful.
Logs record events. Metrics describe measurements and distributions over time. Traces connect recorded operations through spans and their relationships. Each preserves different evidence. None guarantees that every detail of a request was captured: instrumentation, collection, sampling, and retention determine what remains available to query.
The differences at a glance
- Logs describe what happened in an event. Structured fields also support counts, grouping, and trends.
- Metrics track system behavior across a population. They suit dashboards and alerts; cost depends on cardinality, collection frequency, and retention.
- Traces show recorded operations along a request path, including where time was spent and how services called one another.
- Service tags and time windows narrow an investigation. Consistent request identifiers enable more precise correlation. Events occurring together do not establish causation.
Logs preserve event details
A log is a discrete event record: an exception, a request, or a state change. It commonly carries a timestamp, severity, message, and contextual fields. Structured logging makes those fields explicit, often as JSON, rather than leaving every query to parse a sentence.
Strengths: Logs can preserve stack traces and business details that explain a failure. Most languages have established logging libraries. The available context is still limited to what the application recorded and the collection pipeline retained; a log is not an automatic transcript of everything that happened.
Limits: Frequent or large records increase processing and storage work. That does not make logs universally the most expensive signal. Unstructured messages can be difficult to aggregate, while a structured service or status field makes error counts and trends straightforward to query.
Typical uses include exception investigation, audit records, and reconstructing the recorded steps of an individual request.
A log collection pipeline reads events from application files, standard output, or an API, processes and transports them through a collector, and delivers them to a backend. Preserve the distinction between event time and the time the collection system observed the record. A delayed batch should not silently move yesterday's failures into today's event window. OpenTelemetry defines these as separate timestamp fields.
Buffers and retries can absorb a temporary interruption. Their capacity, persistence, and retry limits still matter: a process writing a log does not prove that the backend stored it. The Collector's resilience documentation describes the points at which data can be lost.
Metrics summarize behavior over time
Metrics measure quantities such as CPU utilization, request counts, error rates, and latency distributions. Some measurements update when an event occurs; others are read when collection runs. A fixed interval is a common collection choice, not the definition of a metric.
A time series usually has a metric name, labels, and timestamped samples. A sample can represent a number or distribution data such as a histogram.
Strengths: Controlled labels and an appropriate time resolution make metrics useful for dashboards and threshold alerts. Downsampling can reduce the burden of long retention, with a corresponding loss of detail that needs to suit the query.
Limits: Metrics usually do not retain the full details of each event. Unbounded label values also create more series and put pressure on storage and queries. Where the pipeline supports exemplars, selected measurements can carry context such as a trace ID; this does not preserve a trace for every observation. See the OpenTelemetry exemplar model.
Latency percentiles need particular care. A P99 may be estimated from a histogram or computed by the client. Compatible histogram distributions can be combined before calculating a percentile. Averaging the per-instance quantiles exported by Prometheus summaries does not produce the service-wide P99. Prometheus explains the aggregation difference.
Typical uses include service-level indicators and objectives (SLIs/SLOs), capacity planning, and alerts such as an error rate above 2% over five minutes.
Traces connect recorded operations
Distributed tracing represents instrumented operations as spans, with names, start and end times, status, and other context. Spans in a trace share a trace_id; their span_id and parent span identifiers establish the parent-child relationships. Context must also propagate across service boundaries. A shared trace ID alone cannot reconstruct a call tree.
Asynchronous work may need relationships beyond that tree. Span links can associate work across traces, such as a queued task with the operation that caused it. Neither links nor identifiers fill in operations that were never instrumented, sampled out, or removed by retention. See spans and links and context propagation.
Strengths: Recorded dependencies and timings help locate a slow operation or a failing downstream call. Tracing is especially useful when a request crosses services, although logs, metrics, and profiling can also explain latency.
Limits: Coverage depends on instrumentation. Manual instrumentation, automatic instrumentation, and eBPF-based collection each have boundaries. Kernel, runtime, protocol, and implementation support determine what an eBPF tool can observe; it cannot be assumed to trace every business operation without configuration. Guance documents its eBPF support in Chinese. At high traffic volumes, sampling can control overhead while reducing the set of requests available for later investigation.
Typical uses include investigating cross-service latency, understanding recorded dependencies, and following error propagation.
Connect the signals around the investigation
A common path is to detect a change with metrics, inspect an affected request in a trace, and use related logs to examine the stack trace or business fields. This is a useful workflow, not a mandatory order or a guarantee that logs alone reveal the root cause.
The connection starts during collection. Keep service, environment, and version fields consistent. Include the current trace_id in logs emitted while processing a request, and span_id when span-level detail is useful.
In Guance, trace details can retrieve related logs by the correlation identifier. If logs live in different indexes, log index mapping selects the appropriate scope for the related query. It does not change the rules that route incoming logs into an index. Data must already have been collected, identifiers must match, and the query must have access to it. A matching trace ID cannot recover a span that was sampled out or a log whose retention period has expired.
Common questions
Which signal should a small team start with? Start with the failures that matter and the data already available. Metrics may fill a capacity or availability gap; structured logs may explain exceptions in a monolith. Cross-service latency can justify tracing early. There is no universal installation order. Extend coverage as collection volume and maintenance capacity allow.
Do traces replace logs? Usually not. Spans can carry attributes, events, and exceptions. Logs remain useful for independent business events and detailed records. The instrumentation design determines where each detail is stored; consistent trace IDs can connect records about the same request.
How do metrics differ from a time series built from logs? Metrics represent measurements or distributions; logs represent events. Counting those events in time windows also produces a numeric series. The cost and delay of a log-derived metric depend on parsing, transport, where aggregation happens, query execution, and retention. It is not inherently slower or more expensive than a native metric pipeline. Events lost or filtered before aggregation cannot contribute to the result later.
Is profiling a fourth pillar? It is often discussed as an additional signal, but the label is not a universal requirement. Depending on the profile type, it can show the code paths consuming CPU time or allocating memory. That answers a different question from a request trace. See OpenTelemetry profiles.
Continue reading
Contact us
Join the community

to join the community
Try Guance
Start online and pay only for what you use.
Get startedChoose a Guance plan