Phone:400-882-3320



Profiling performance analysis addresses what problems it solves
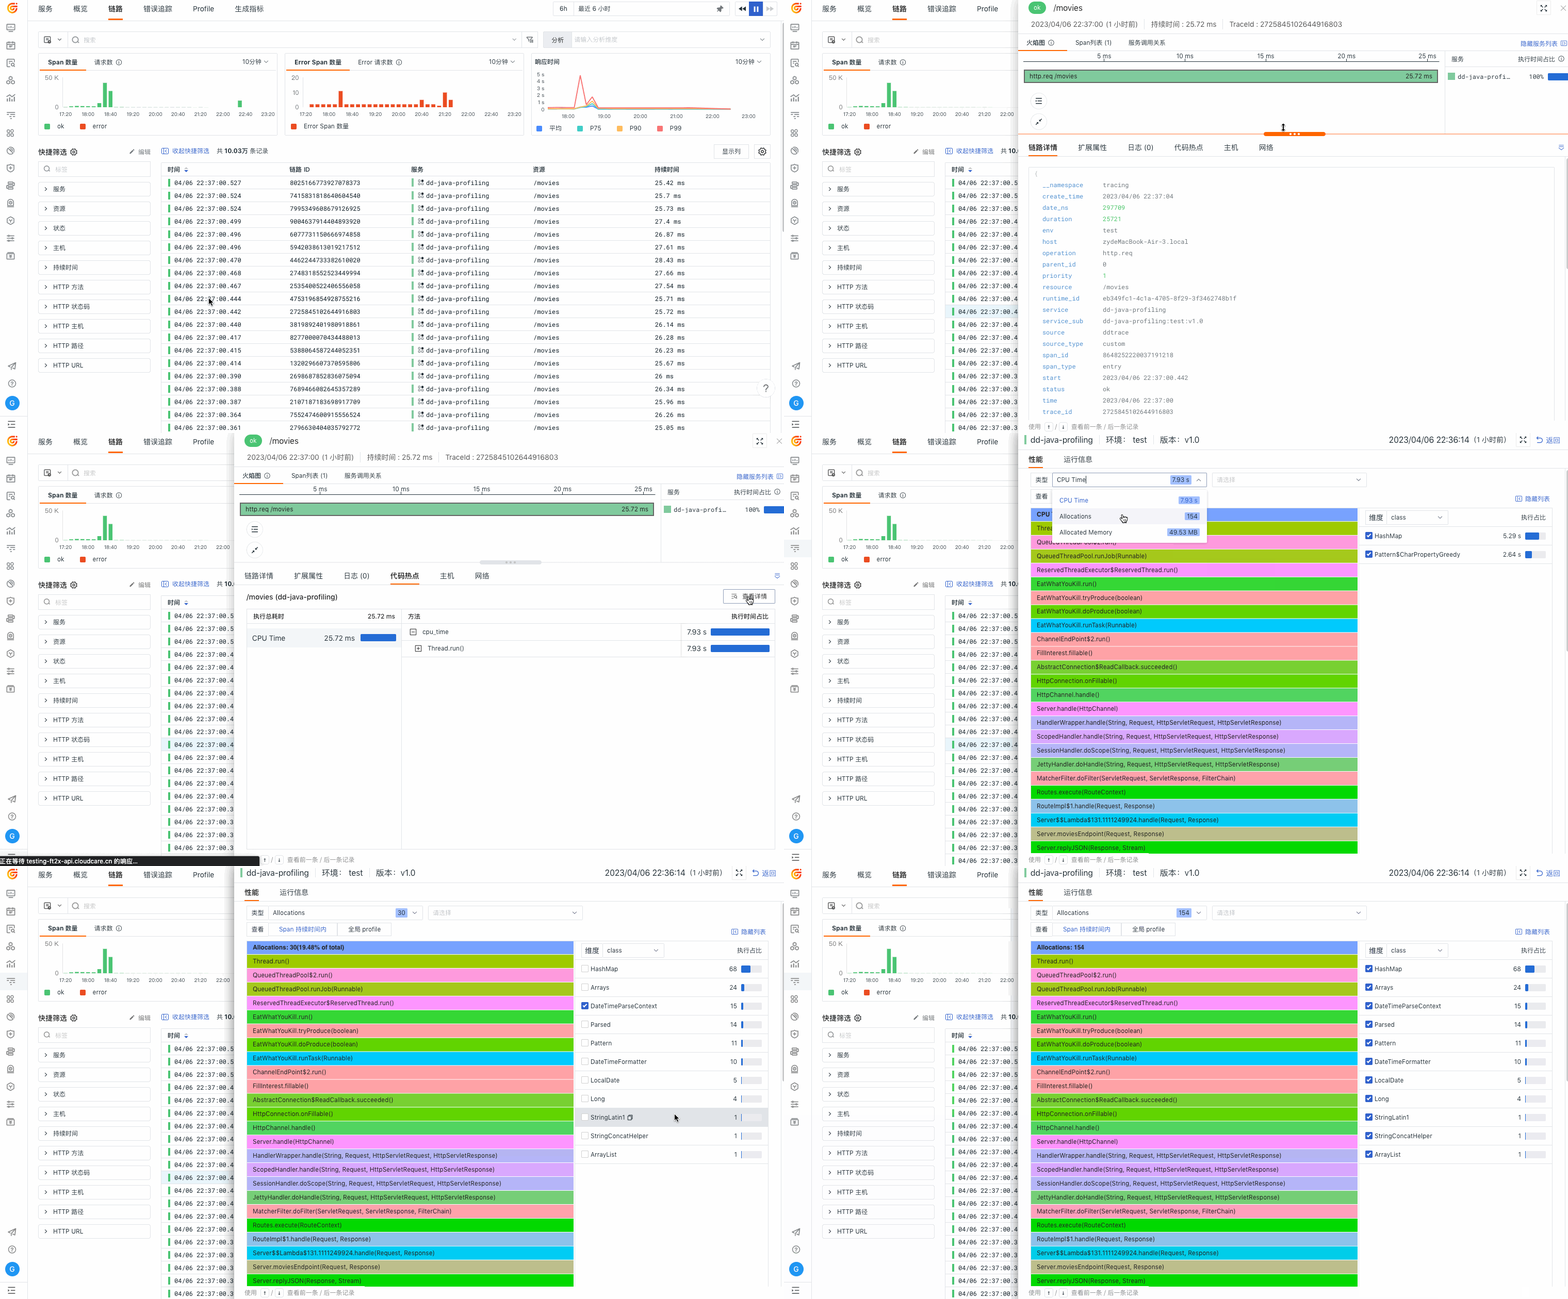
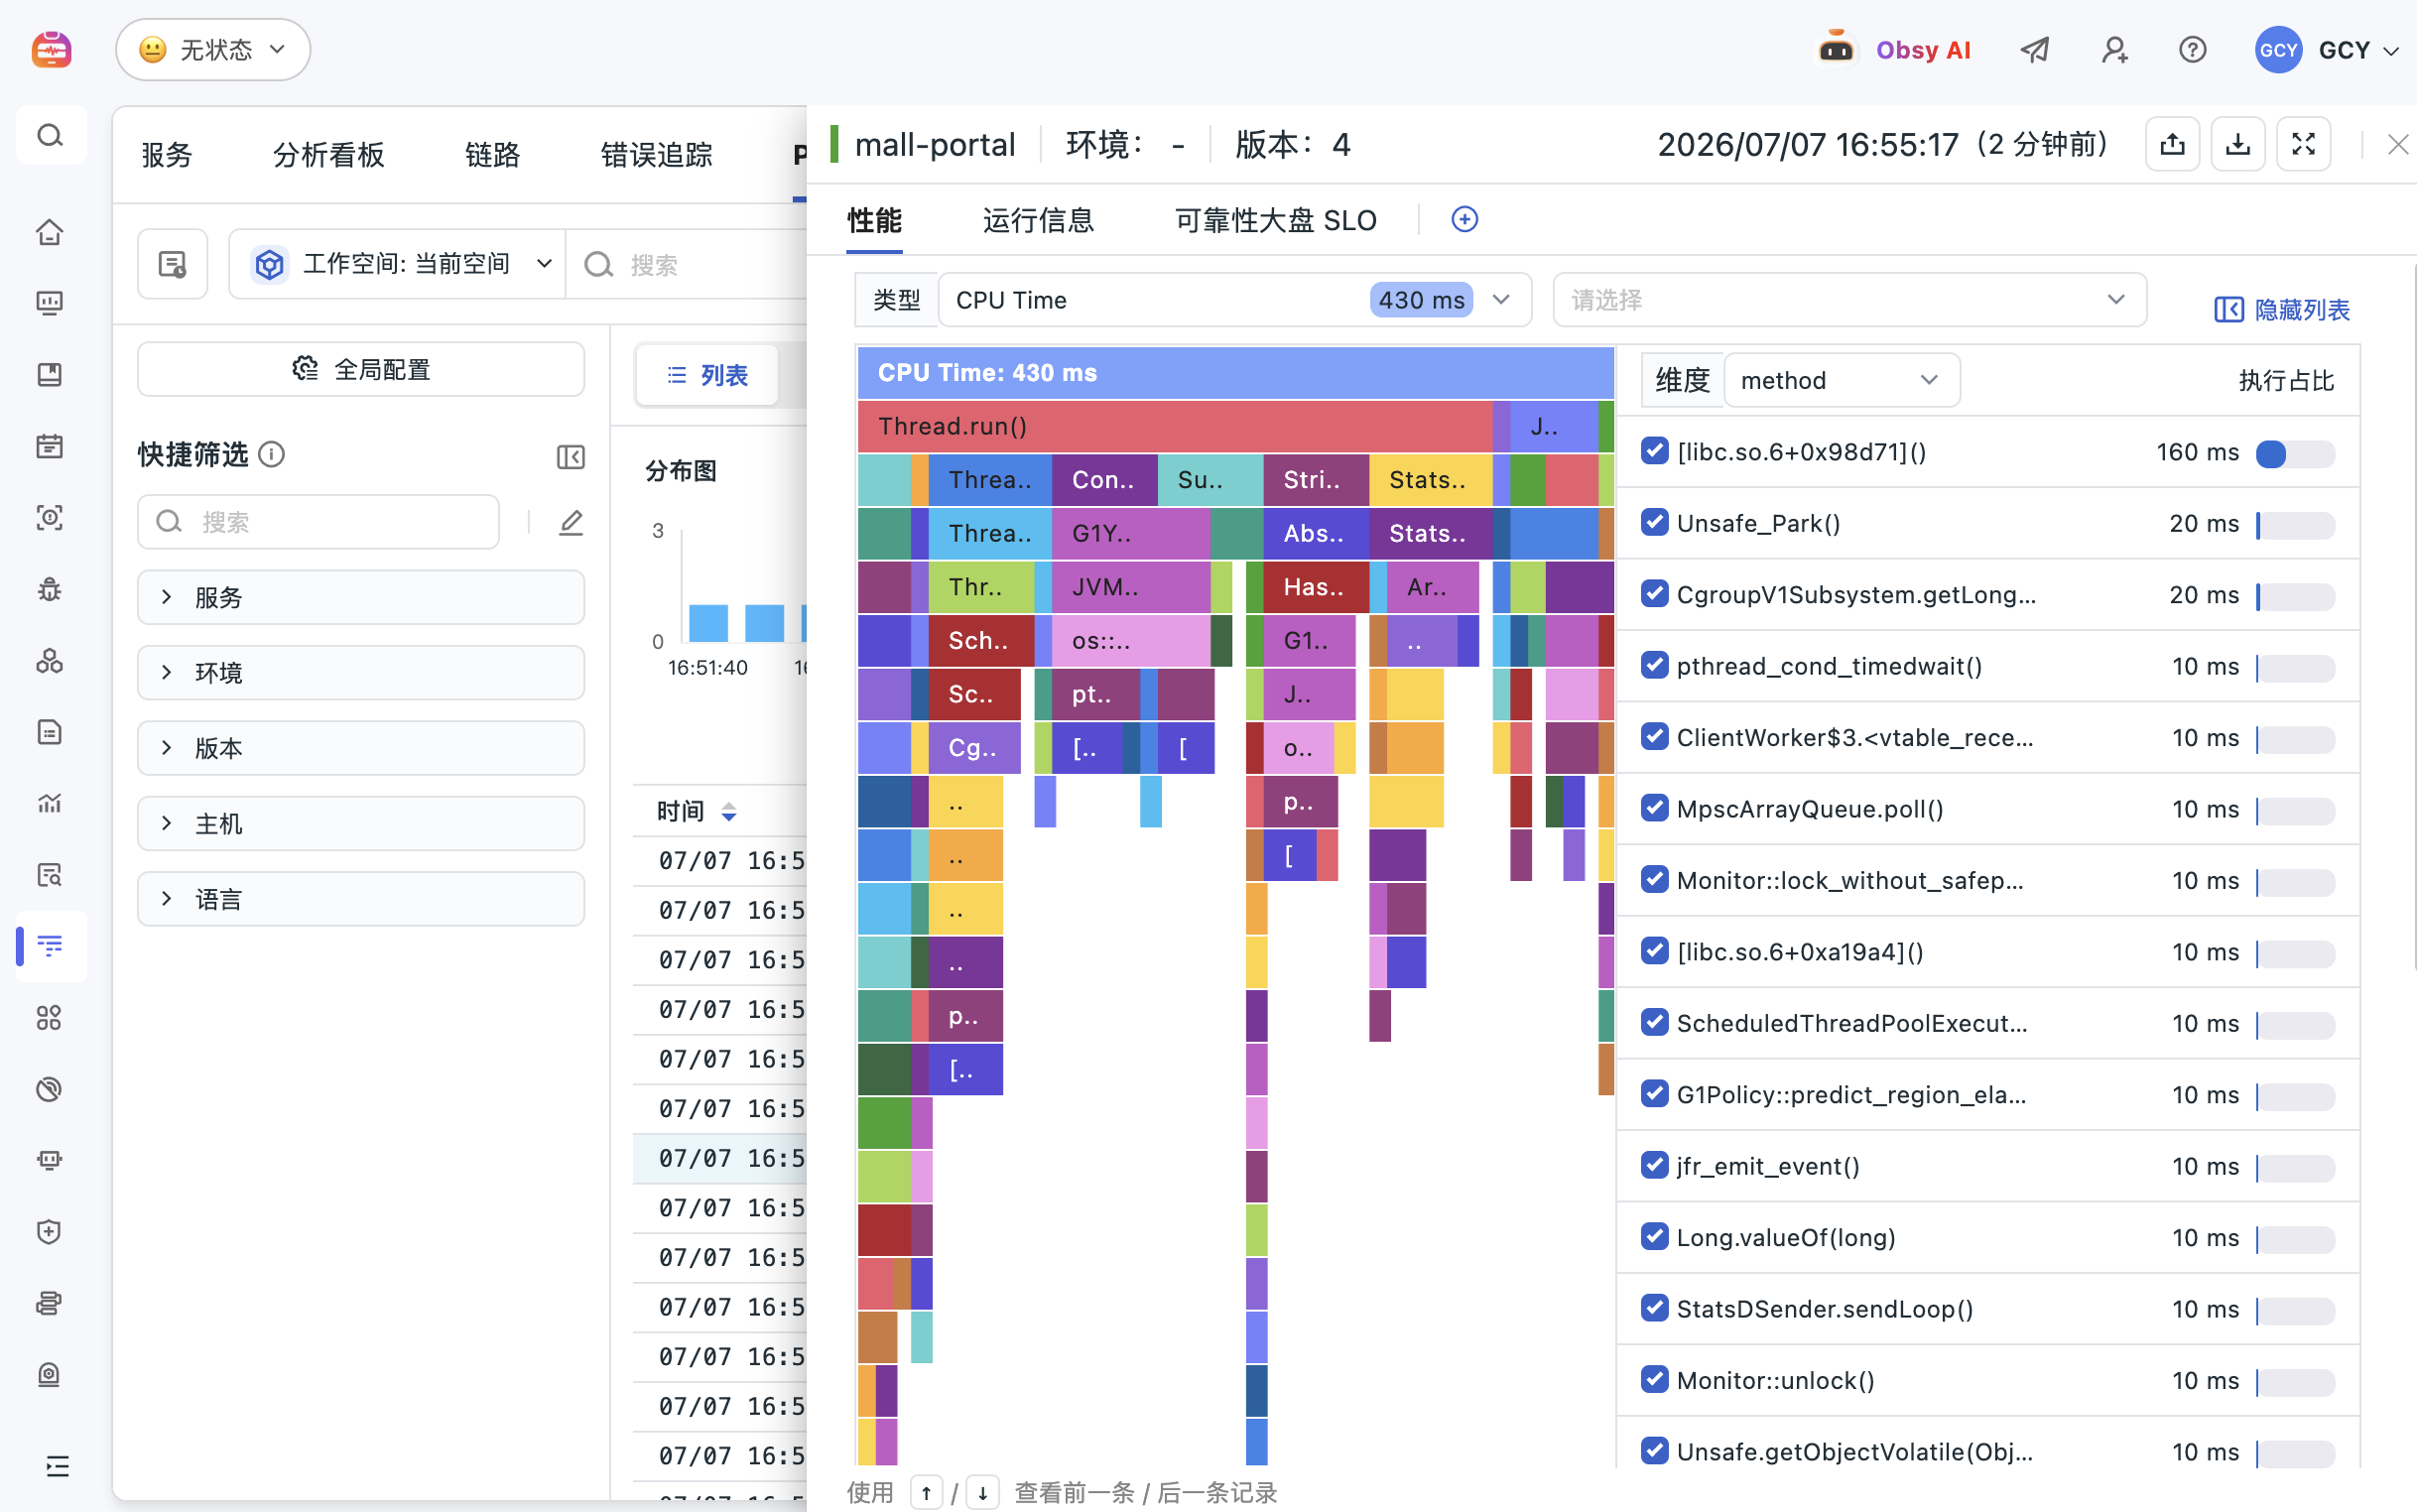
When Trace only shows slow service, Profile continues to locate code hotspots
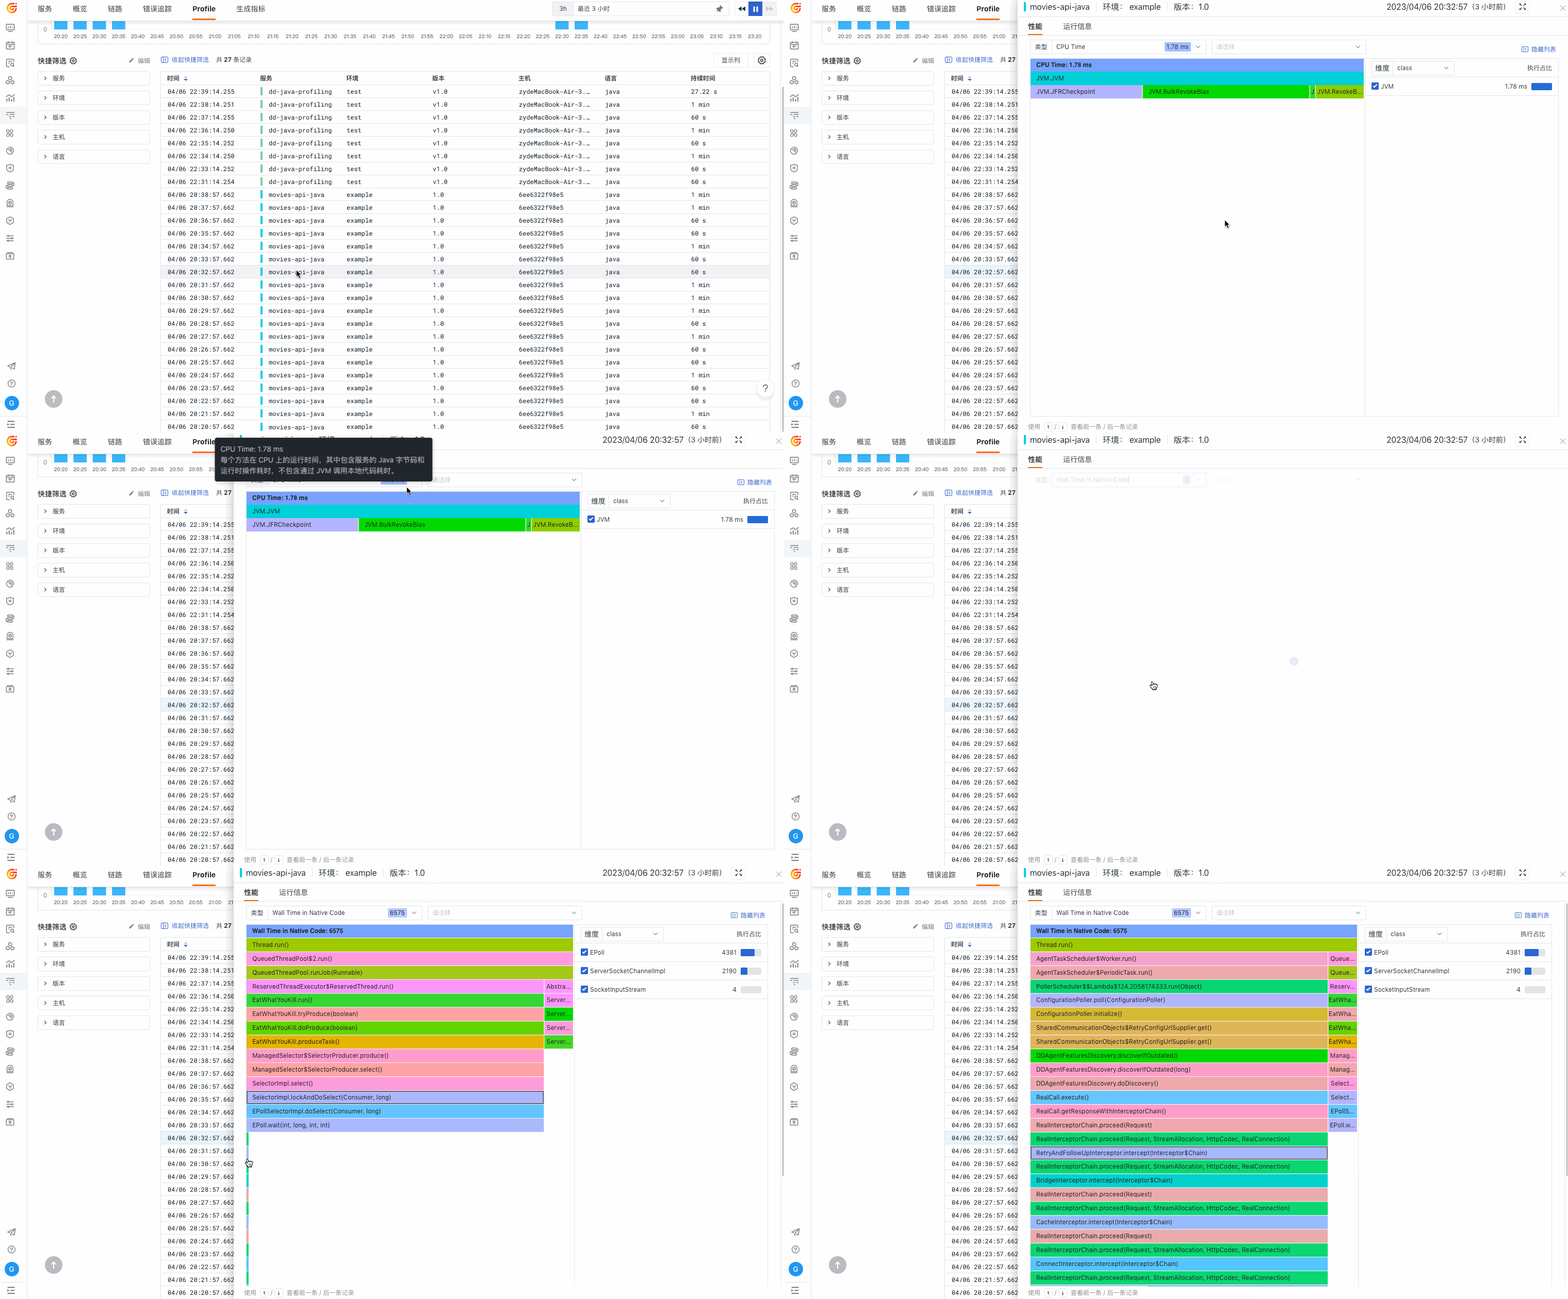
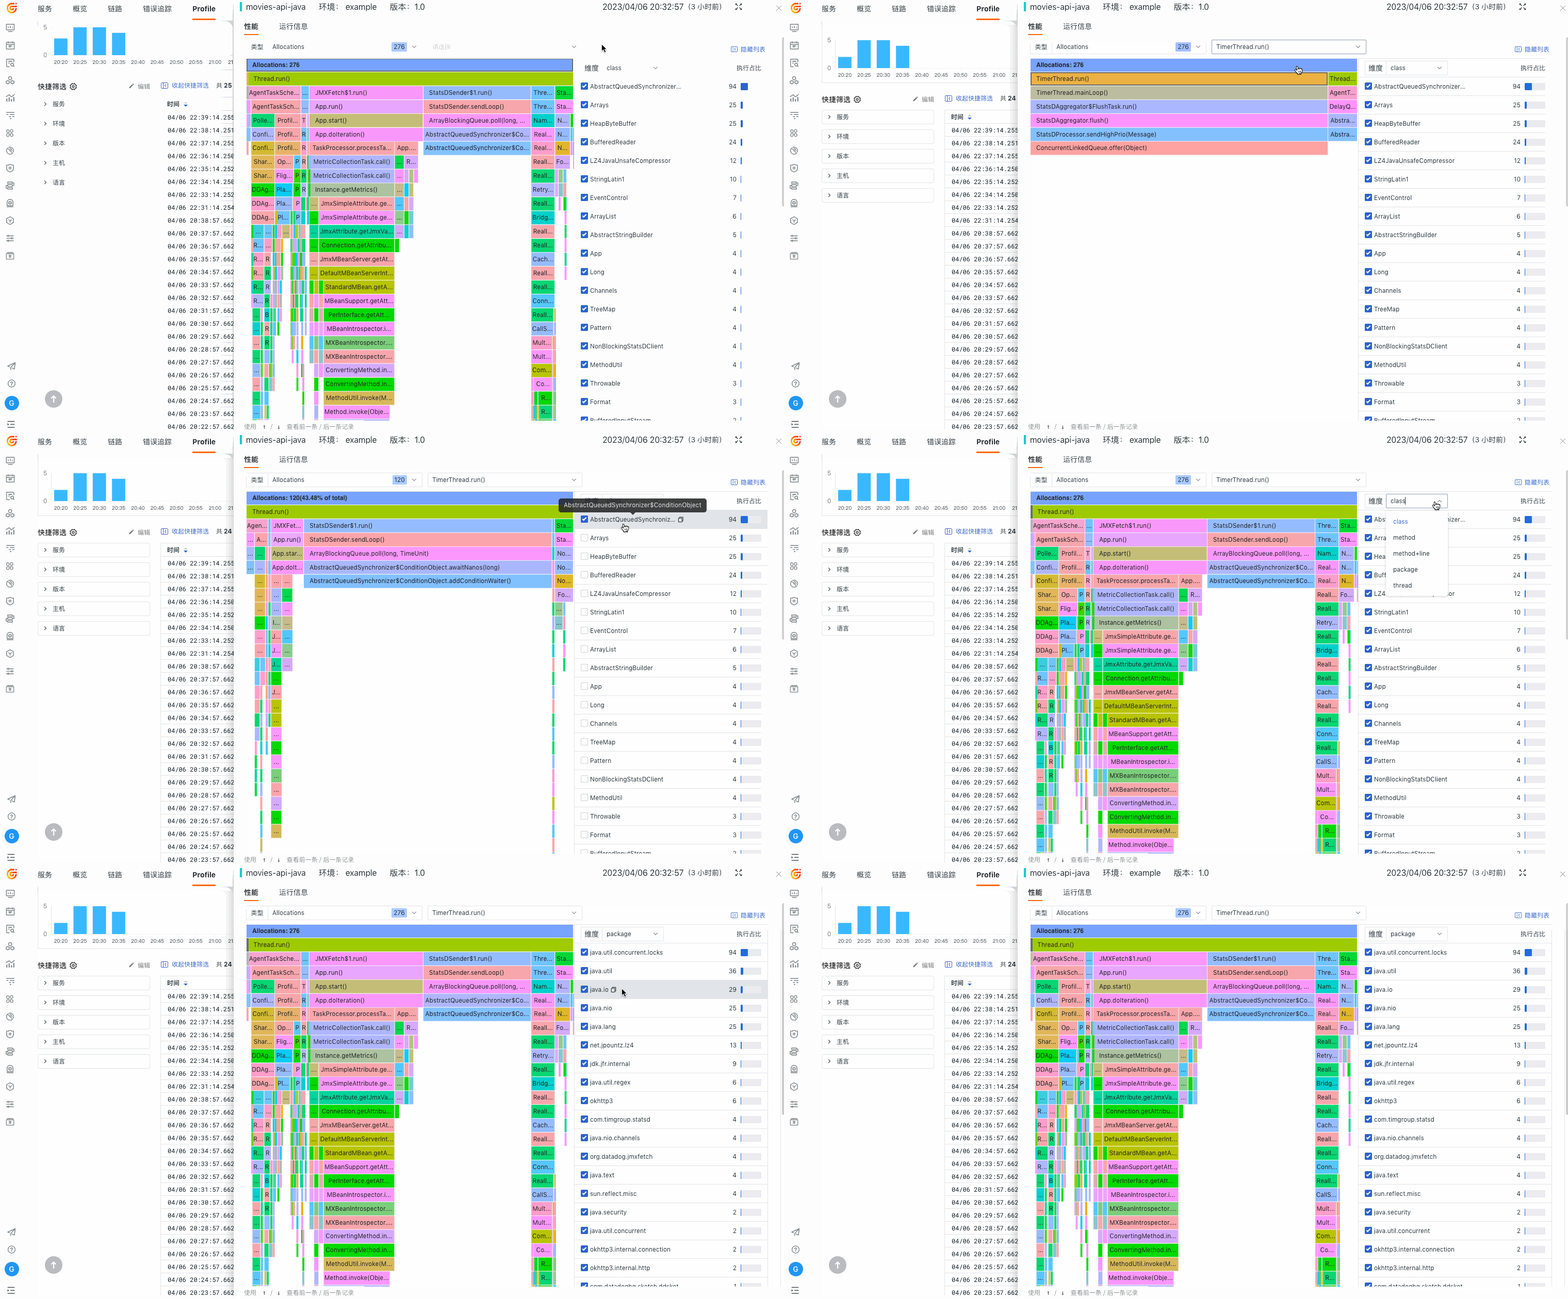
APM Trace can tell the team which service segments are being called slowly, but it may not necessarily explain why. Profiling Performance Analysis samples data from the production environment, including function calls, CPU, memory, locks, IOs, and slow queries, further locating interface time, resource consumption, and user experience issues to specific code paths.