Contact us

Join the community

Scan with WeChat
Join the official community group

Try Guance

Start online with usage-based pricing and a true cloud service.

Get started

Choose a Guance edition

Code repositories

Application performance monitoring

Trace slow requests from service latency to code and dependencies

Connect service maps, distributed traces, errors, logs, profiles, infrastructure, and releases to explain why an application is slow or failing.

Trace slow requests from service latency to code and dependencies
Book a demo

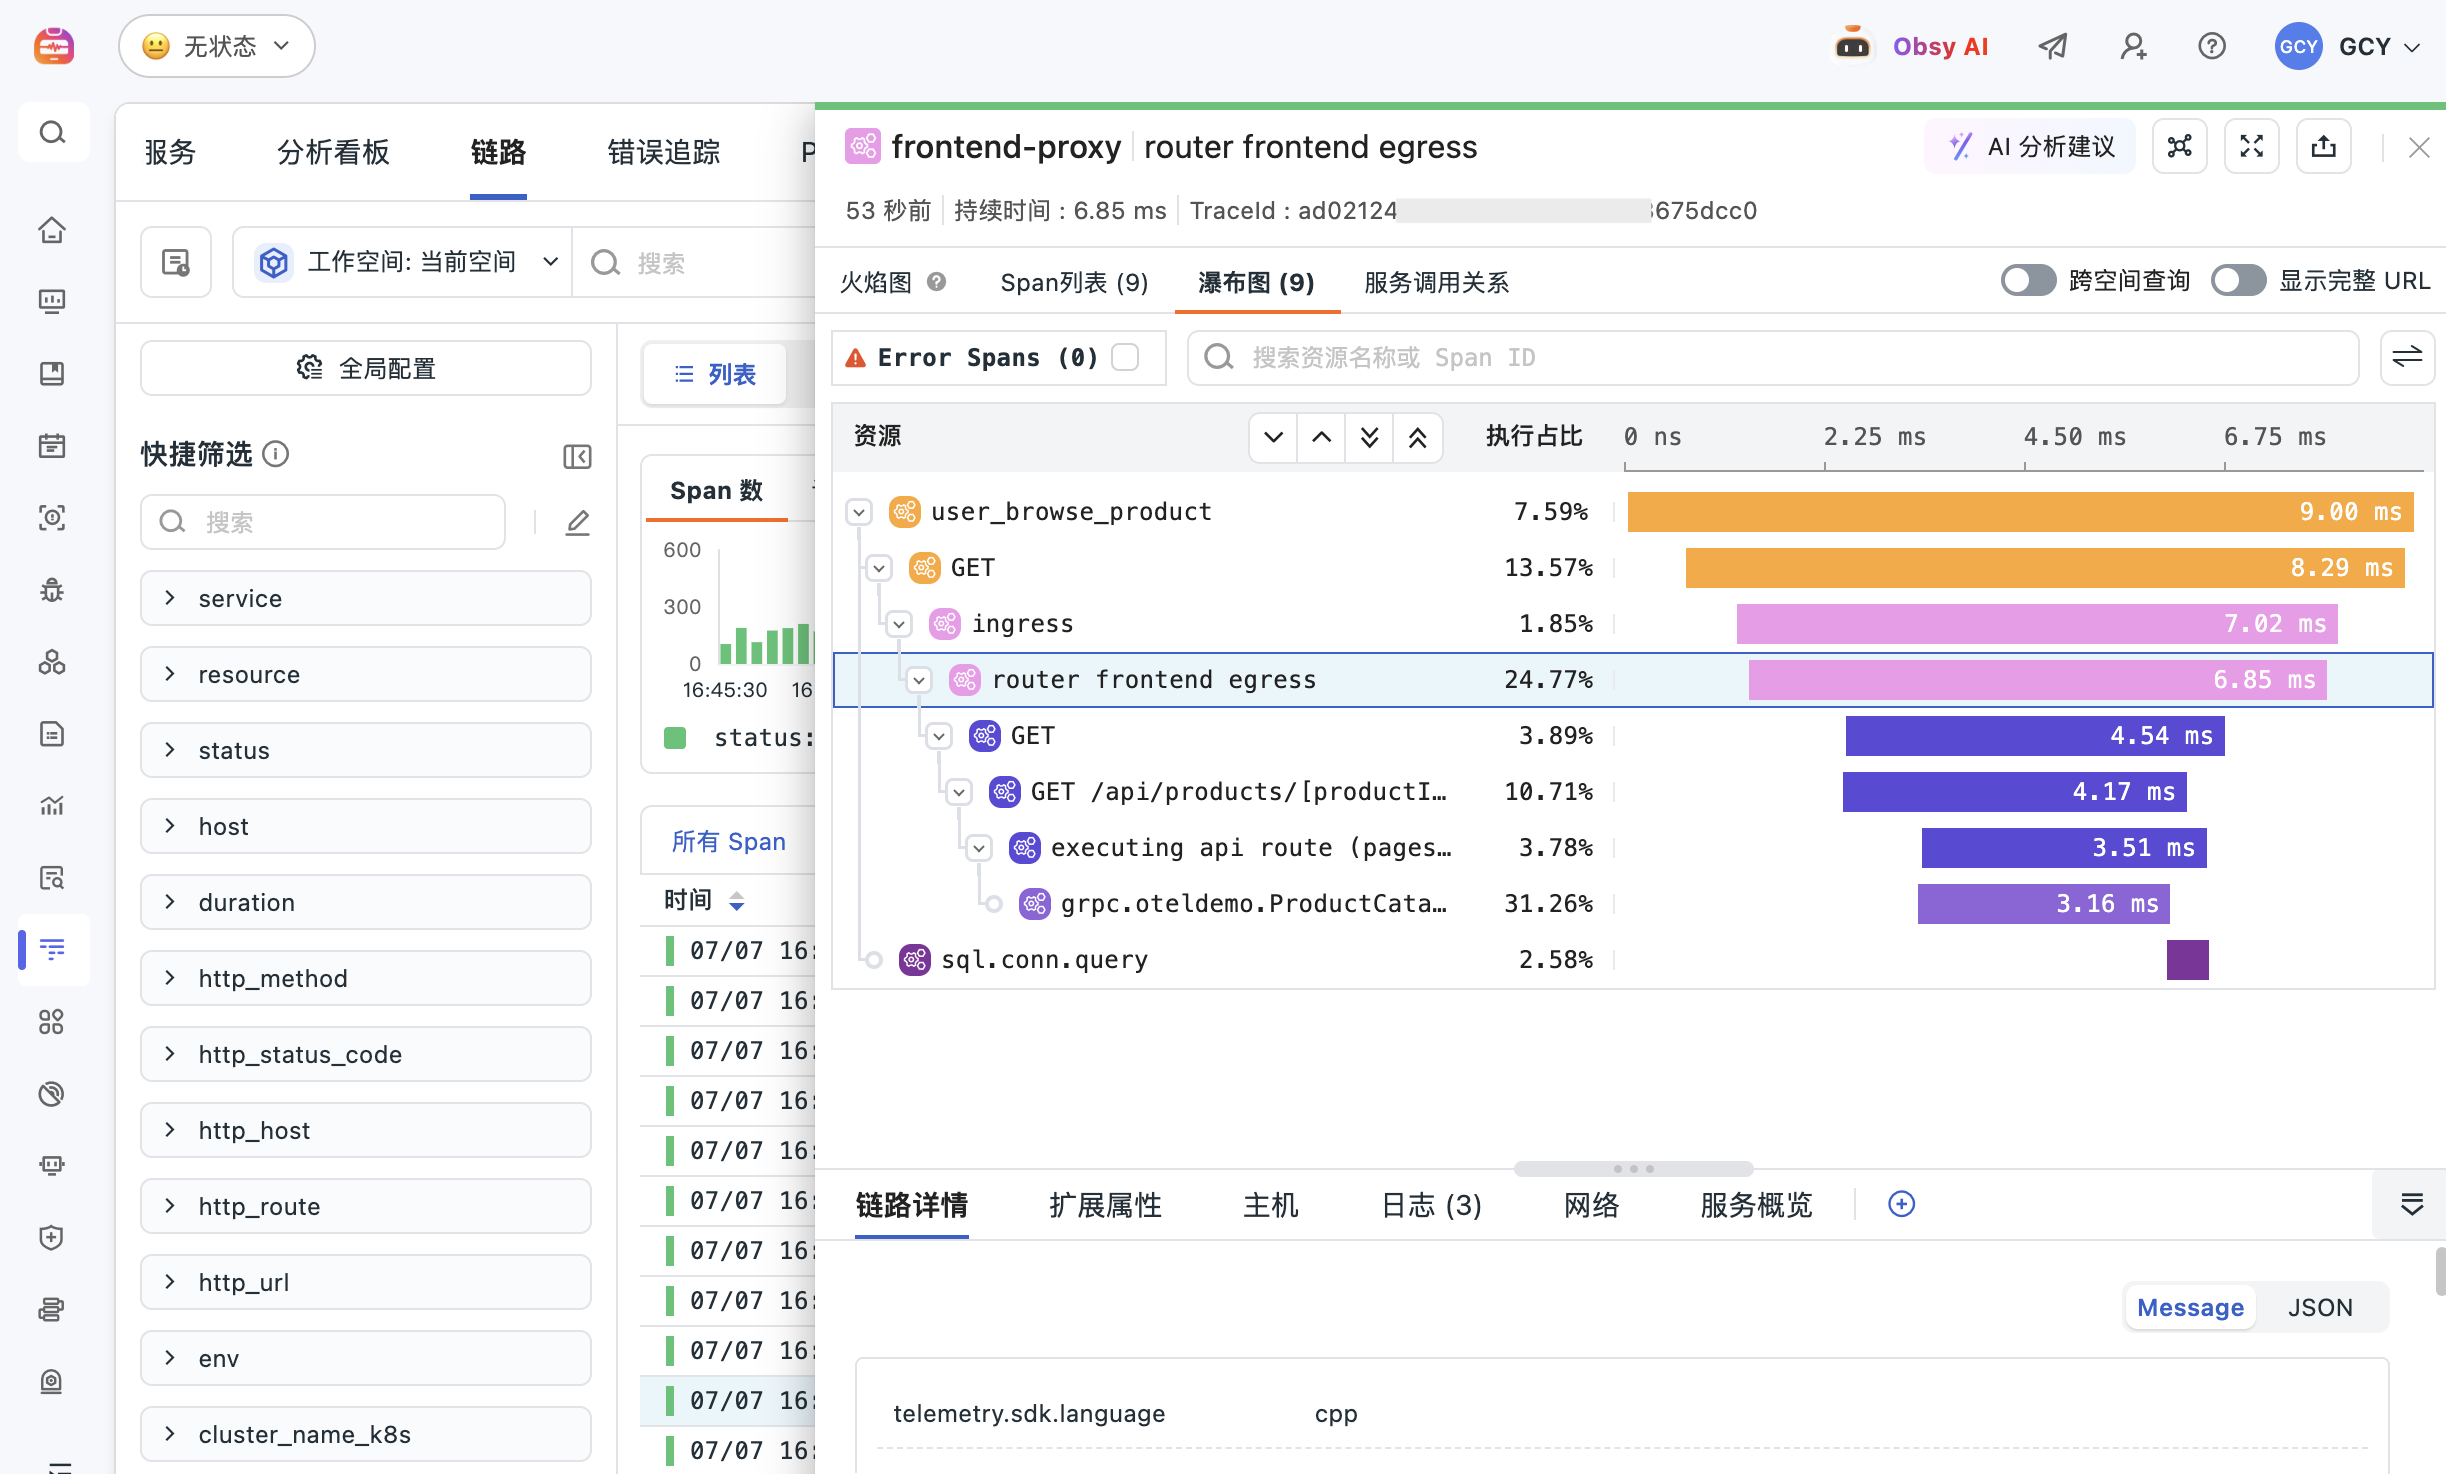
Guance APM helps engineering teams inspect service health, latency, throughput, errors, dependencies, and individual traces without losing the infrastructure and log context around each request.

———— Guance

INVESTIGATION WORKFLOW

Move from symptom to verified action

Guance APM helps engineering teams inspect service health, latency, throughput, errors, dependencies, and individual traces without losing the infrastructure and log context around each request.

Detect

EvidenceIdentify latency, error, and throughput changes at the service or endpoint level.

ConclusionCompare throughput, error rate, latency, and dependency health across services and environments.

Data path

Detect → Trace → Verify

Best for

Connect service maps, distributed traces, errors, logs, profiles, infrastructure, and releases to explain why an application is slow or failing.

Requirements

Guance APM helps engineering teams inspect service health, latency, throughput, errors, dependencies, and individual traces without losing the infrastructure and log context around each request.

Trace-level evidence
Open a slow or failed request and inspect spans, resources, tags, logs, and upstream or downstream calls.
Trace-level evidence
Trace
Trace
Follow the affected request through services and dependencies.
Verify
Confirm the root cause with logs, profiles, resources, and release context.
Verify

Frequently asked questions

Which tracing standards can Guance ingest?

Guance supports OpenTelemetry and other common tracing integrations through DataKit and compatible collectors.

Can APM data be connected to logs and infrastructure?

Yes. Consistent service, environment, host, container, and trace attributes let teams move between APM, logs, profiles, and infrastructure views.

Does Guance support microservices and Kubernetes applications?

Yes. Traces can be analysed together with service topology, pod and node context, container metrics, and Kubernetes events.

What data can Guance bring into one observability platform?

Guance correlates metrics, logs, traces, profiles, RUM sessions, synthetic tests, cloud resources, security events, alerts, and selected business data in a shared workspace.

Does Guance work with OpenTelemetry?

Yes. OpenTelemetry handles instrumentation and telemetry collection, while Guance provides the backend used to store, query, visualize, correlate, and alert on that telemetry.

Explore more

Resources and further reading

Choose the next step from product documentation, related solutions, and technical guidance.

Related reading

Selected product practices, troubleshooting guidance, and technical solutions

Continue exploring Guance

Book a demo

Guance APM helps engineering teams inspect service health, latency, throughput, errors, dependencies, and individual traces without losing the infrastructure and log context around each request.

Get started > View documentation > View pricing >