Contact us

Join the community

Scan with WeChat
Join the official community group

Try Guance

Start online with usage-based pricing and a true cloud service.

Get started

Choose a Guance edition

Code repositories

Container Monitoring

Container monitoring

Guance container monitoring targets environments such as Kubernetes, Docker, ECS, Fargate, continuously observing pods, containers, workloads, resource limits, and events, and correlating metrics, logs, links, networks, and release changes to help platform engineering, SREs, and R&D teams locate container restarts, resource bottlenecks, and release anomalies.

Container monitoring
Book a demo

What problems does container monitoring solve?

Gain clear insights into workloads, resources, and failure context in a dynamic container environment

Containers are frequently created and destroyed, and workloads, resource limits, node status, and events continuously change. Guance automatically detect changes in container lifecycles, continuously monitor Pods, Deployments, Services, and container resources, helping teams analyze short lifecycle objects, application dependencies, logs, and links from a unified perspective.

Pods come and go, automatically detecting dynamic workloads first
- Real-time detection of container creation, destruction, reboot, and workload changes to prevent short-lifecycle objects from disappearing from monitoring view.
- Automatically identifies services running on containers, collects metrics, logs, and link data, preserving context for Kubernetes troubleshooting.
- View health status, resource consumption, images, deployment information, and tags in container details to quickly determine whether exceptions are related to release, scheduling, or resource limits.
Pods come and go, automatically detecting dynamic workloads first
Where do Kubernetes failures start? Drilling down layer by layer by cluster, node, and Pod
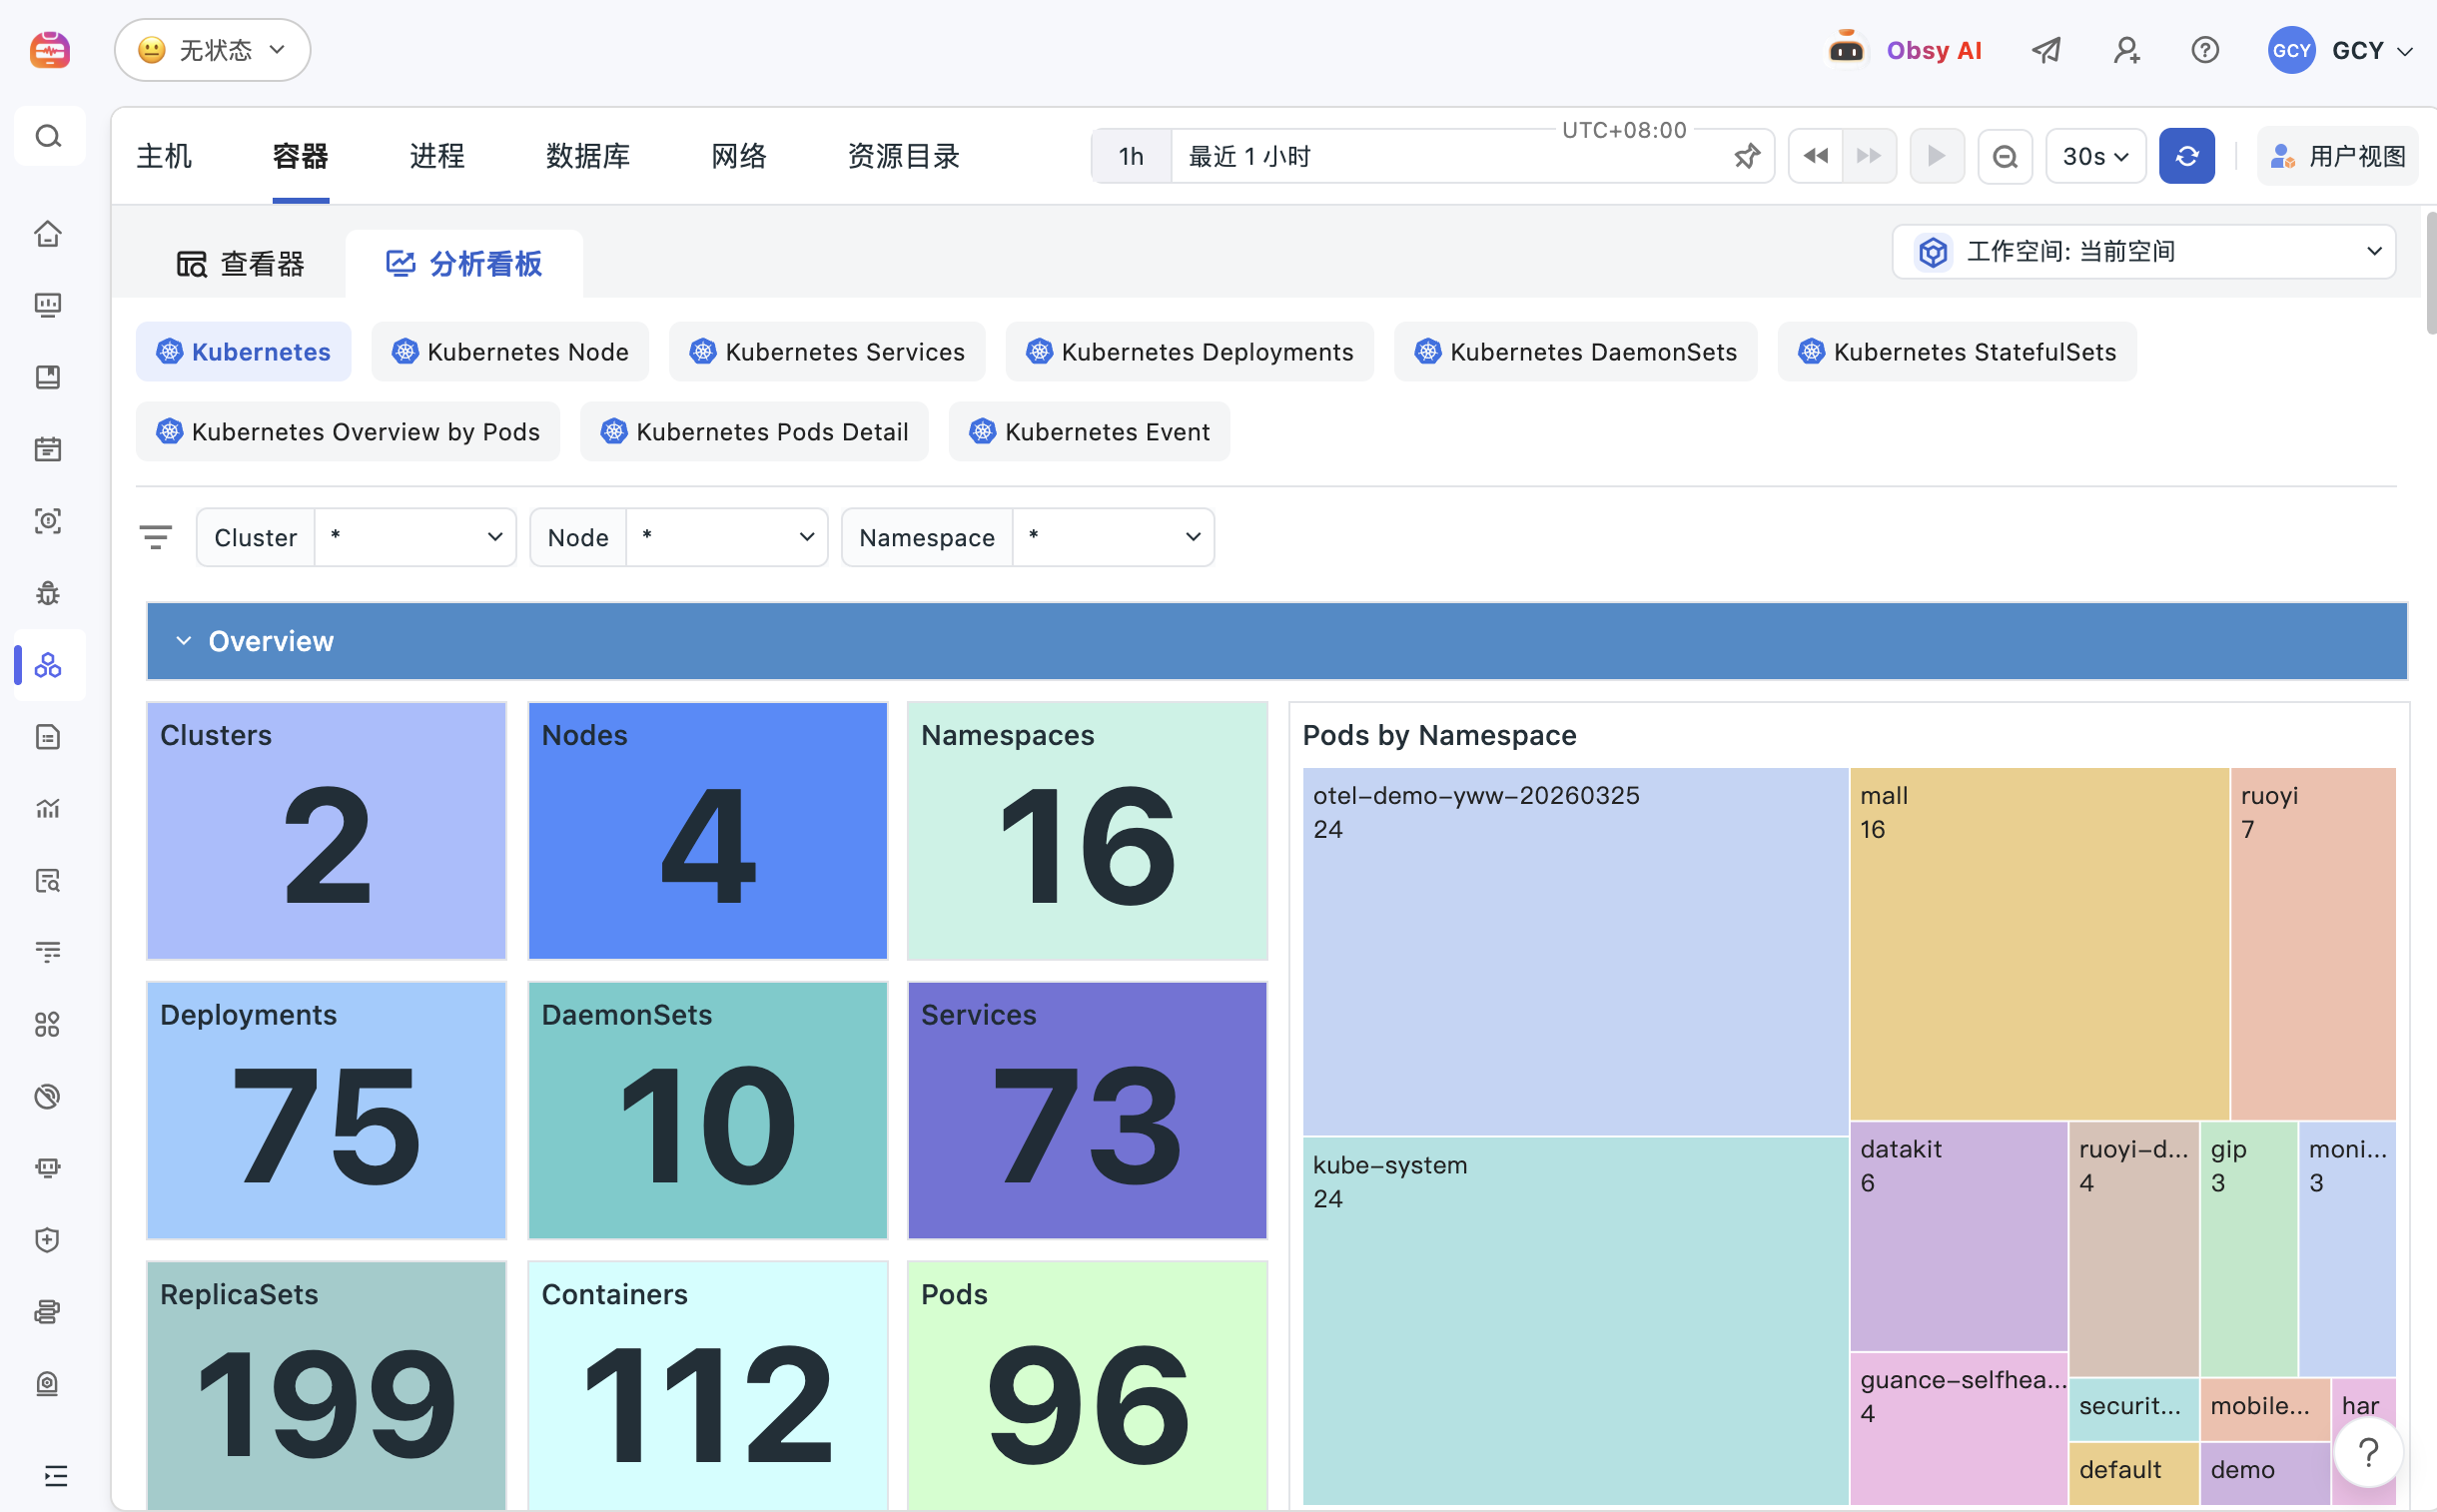
- Observe Kubernetes operating status through multidimensional views such as clusters, nodes, namespaces, pods, services, and deployments.
- When Pods reboot, node pressure rises, services become unavailable, or replicas fail, teams can gradually drill down the hierarchy to identify which layer the problem is occurring.
- Metrics, logs, traces, and network performance data can be jumped and analyzed within the same context, reducing cross-tool troubleshooting time.
For serverless containers like Fargate, you also need to look at metrics, logs, and links
- Supports serverless container scenarios like AWS Fargate, helping teams continue monitoring container status without managing underlying nodes.
- Collect container metrics, logs, and link data, and view key resources, service performance, and anomaly trends through out-of-the-box dashboards.
- When serverless containers experience latency, errors, or resource limitations, they can also be analyzed in conjunction with application traces and logs.
For serverless containers like Fargate, you also need to look at metrics, logs, and links
Configuration changes and container risks should be reviewed together with operational status
- Observe changes in Deployment, DaemonSet, Service, CronJob, StatefulSet objects in the containerized environment to help the team determine whether the fault stems from configuration or release.
- Integrate container security, configuration checks, and operational metrics to promptly detect abnormal changes, resource risks, and potential security issues.
- For high-frequency releases and multi-team collaboration in production environments, change events can serve as important evidence for troubleshooting Kubernetes issues.
Early alerts for abnormal trends reduce Kubernetes troubleshooting blind spots
- Configure alerts based on nodes, pods, containers, workloads, and service metrics to promptly detect reboots, resource saturation, service anomalies, and capacity risks.
- By using built-in detection rules and anomaly analysis, it identifies anomaly trends in Kubernetes in advance, reducing troubleshooting costs after problems expand.
- Alerts can be linked with notification channels such as email, SMS, Feishu, DingTalk, and WeChat Work, and continue analyzing logs, links, and events.
Early alerts for abnormal trends reduce Kubernetes troubleshooting blind spots

Frequently asked questions

What is container monitoring?

Container monitoring is used to continuously observe Pod, Docker containers, workloads, resource limits, reboots, logs, and release events. It helps teams quickly detect resource, scheduling, and operational anomalies in environments with frequent object changes over short lifecycles.

What metrics should container monitoring focus on?

Container monitoring typically focuses on CPU, memory, network, disk, reboot count, exit status, resource requests and limits, workload replicas, and related logs. To assess multi-cluster, node, service, and application call chains, you can continue to look at Kubernetes monitoring solutions.

How does container monitoring integrate with APM and logs?

When services encounter slow requests or errors, Guance can jump from APM Trace to the corresponding container, Pod, host metrics, and logs, helping the team determine whether the issue comes from application code, resource bottlenecks, container scheduling, or a cluster environment.

Guance support serverless container monitoring?

Guance supports serverless container scenarios such as AWS Fargate, collecting container metrics, logs, and link data, and monitoring container platform operations through out-of-the-box dashboards.

Explore more

Resources and further reading

Choose the next step from product documentation, related solutions, and technical guidance.

Related reading

Selected product practices, troubleshooting guidance, and technical solutions

Want to see how container monitoring is implemented in your business systems?

Book a demo