Contact us

Join the community

Scan with WeChat
Join the official community group

Try Guance

Start online with usage-based pricing and a true cloud service.

Get started

Choose a Guance edition

Code repositories

Continuous Profiling

Profiling performance analysis

Guance Profiling performance analysis helps R&D teams identify slow interfaces, high resource consumption, and code hotspots by analyzing CPU, memory, lock waiting, IO, slow queries, and function call data in production environments, and links them with APM Trace to pinpoint performance bottlenecks into specific methods and call paths.

Profiling performance analysis
Book a demo

Profiling performance analysis addresses what problems it solves

When Trace only shows slow service, Profile continues to locate code hotspots

APM Trace can tell the team which service segments are being called slowly, but it may not necessarily explain why. Profiling Performance Analysis samples data from the production environment, including function calls, CPU, memory, locks, IOs, and slow queries, further locating interface time, resource consumption, and user experience issues to specific code paths.

Interface is slow, but Trace only shows time consumption? Continue locating functions and resource consumption
Profiling can identify where function calls and resource consumption cause performance bottlenecks, such as excessive CPU usage, abnormal memory allocation, lock waiting, slow queries, or IO blocking. Teams can continue from "which interface is slow" to "which code segment consumes the most time and resources."
Interface is slow, but Trace only shows time consumption? Continue locating functions and resource consumption
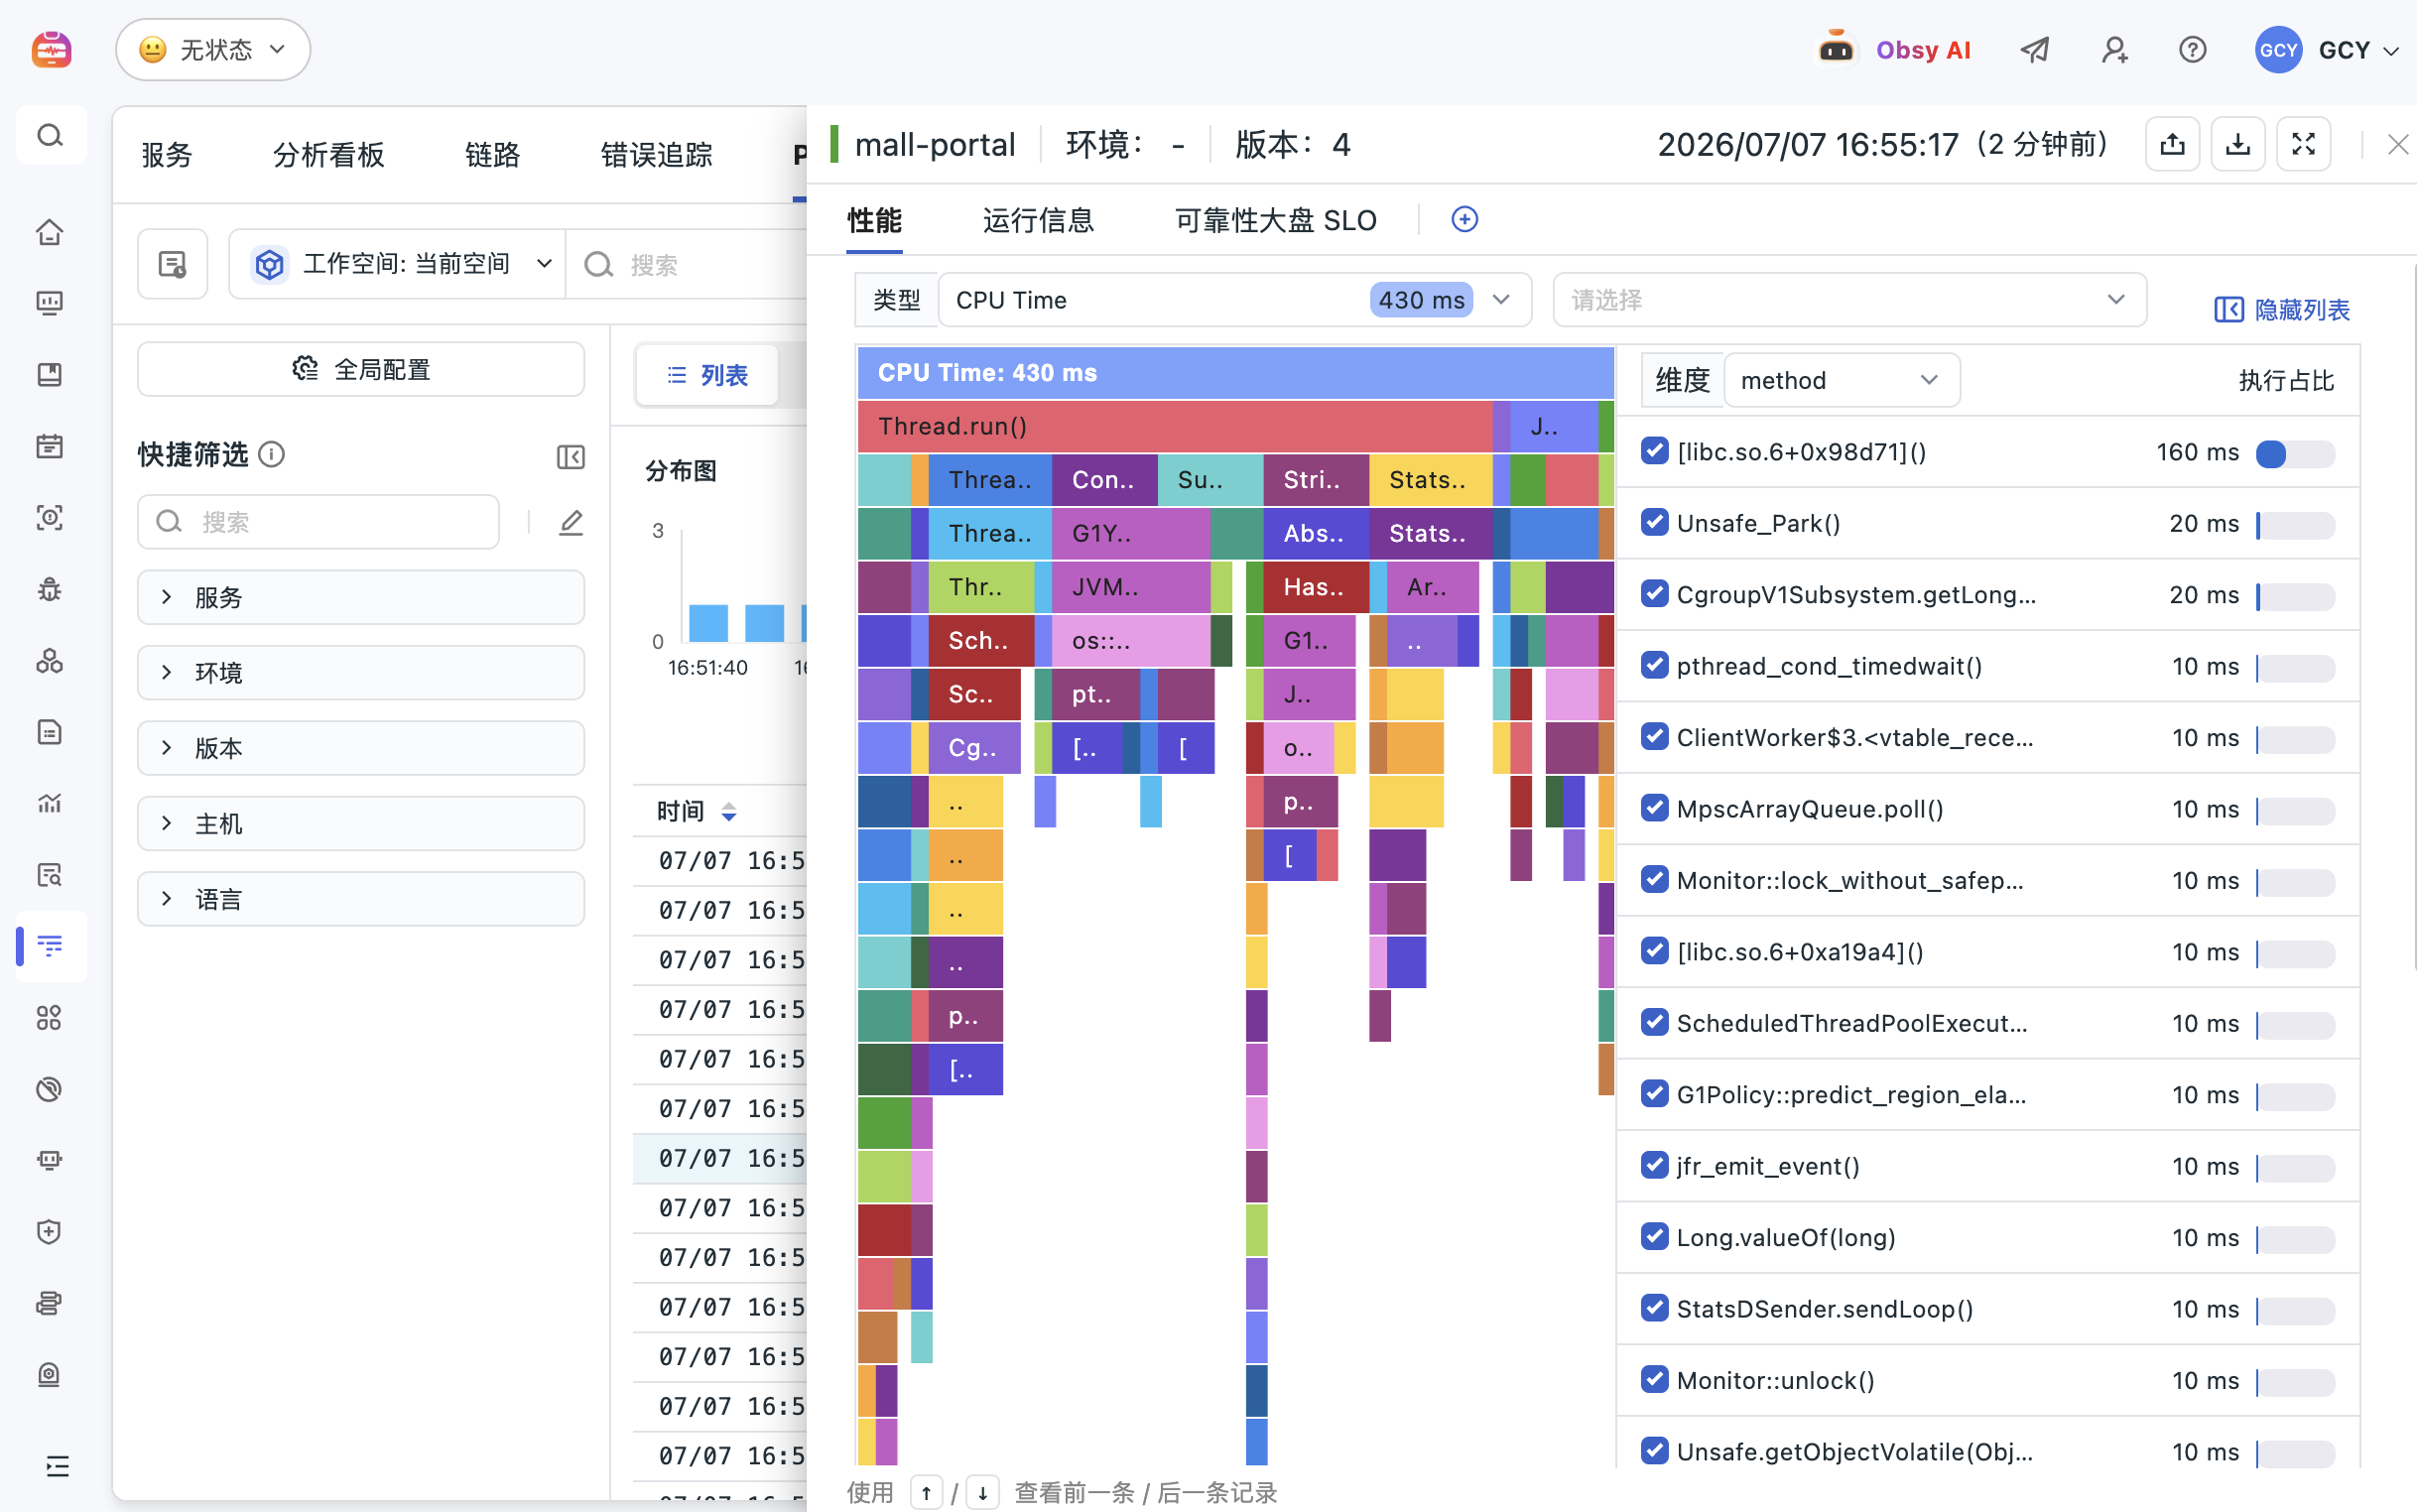
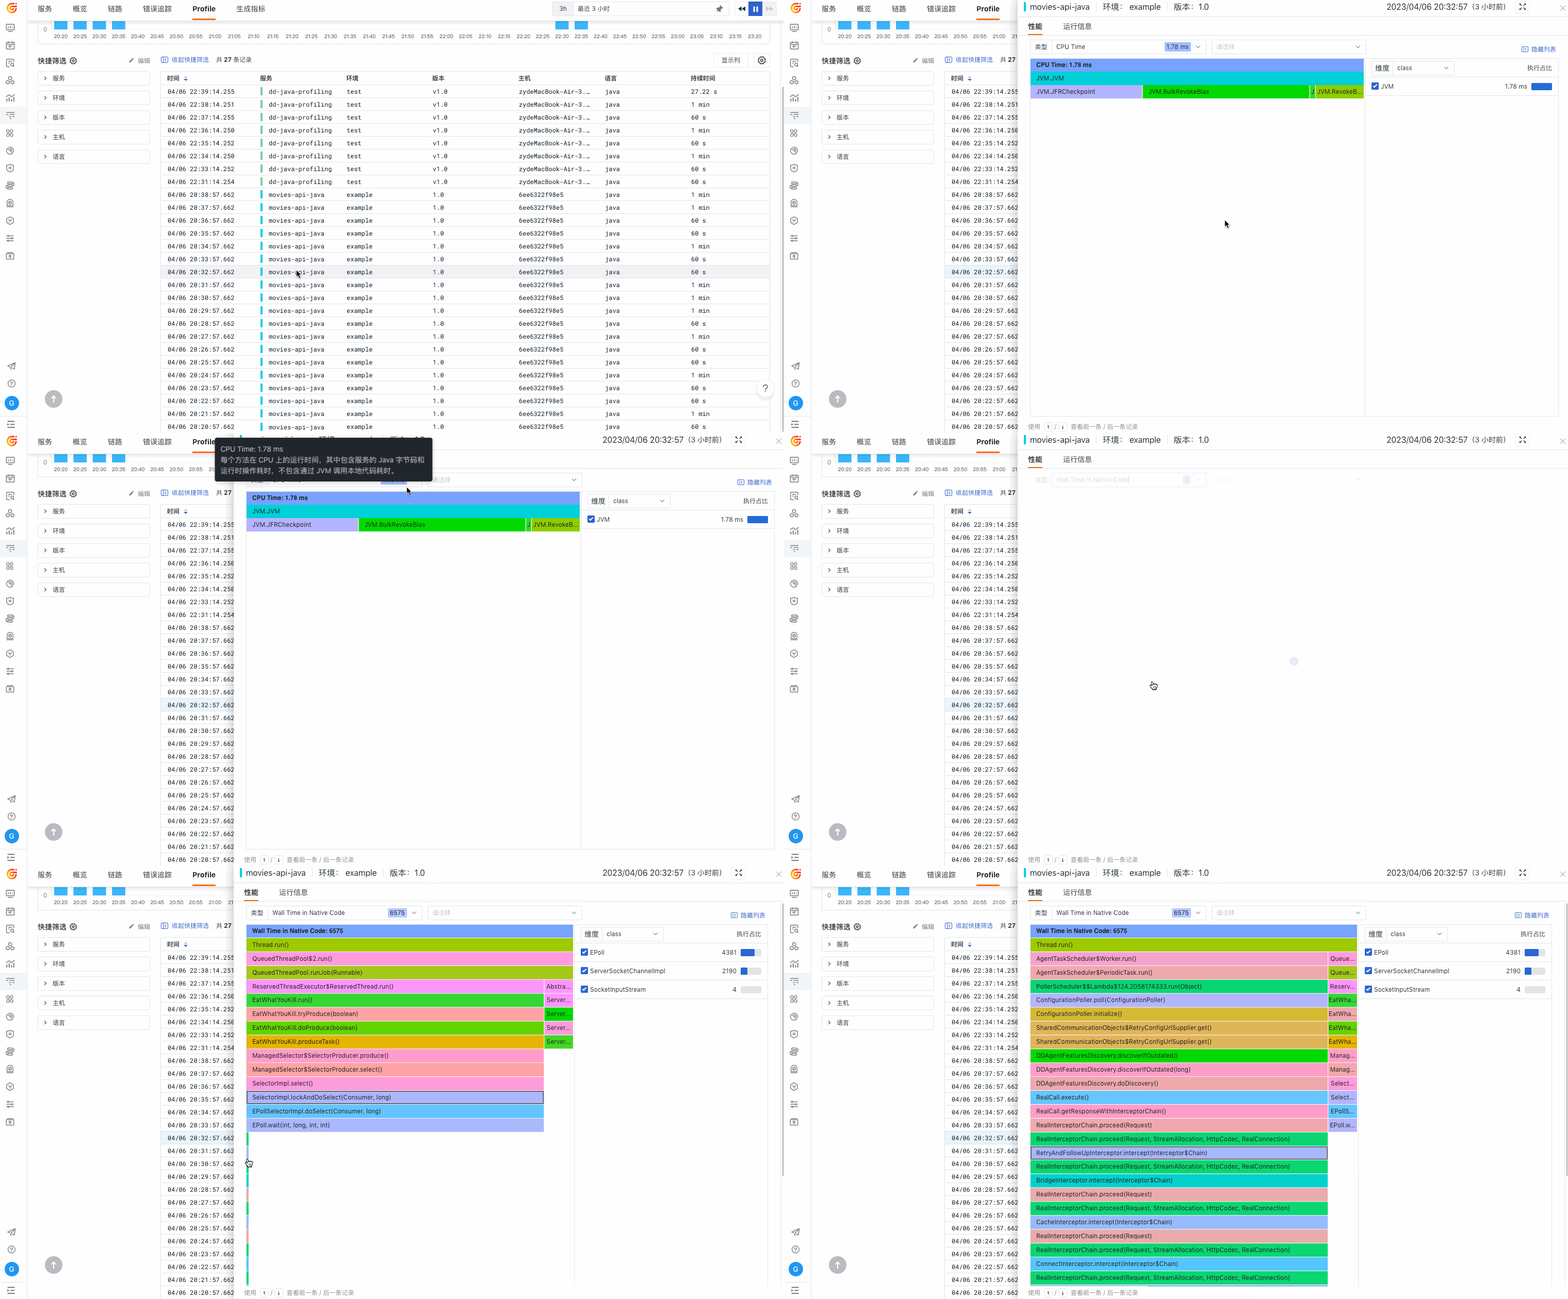
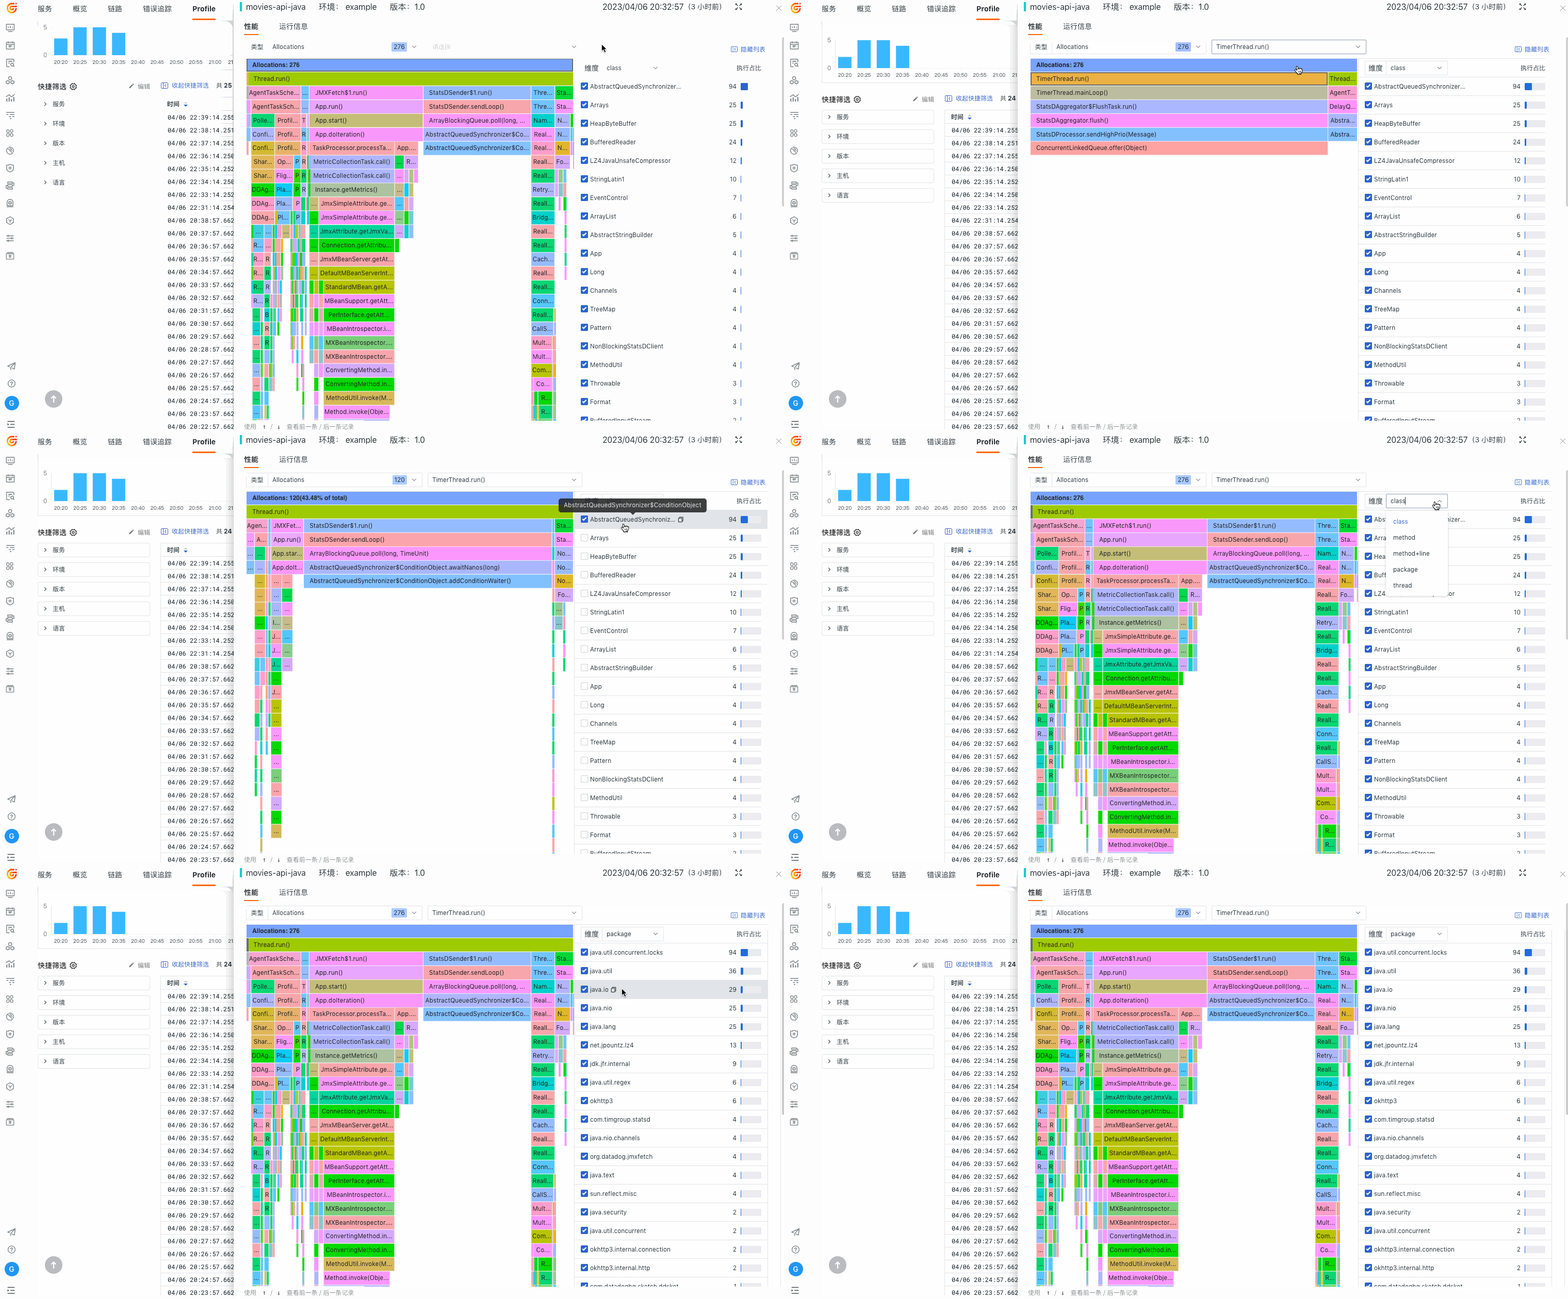
Use flame charts to clearly see CPU, memory, and IO hotspots, without guessing optimization
Guance Present Profiling stack data as flame diagrams and other methods, supporting method-level analysis of CPU, memory, lock waiting, and IO usage. R&D teams can analyze execution time by language, service, version, and time range to identify code paths that truly impact performance.
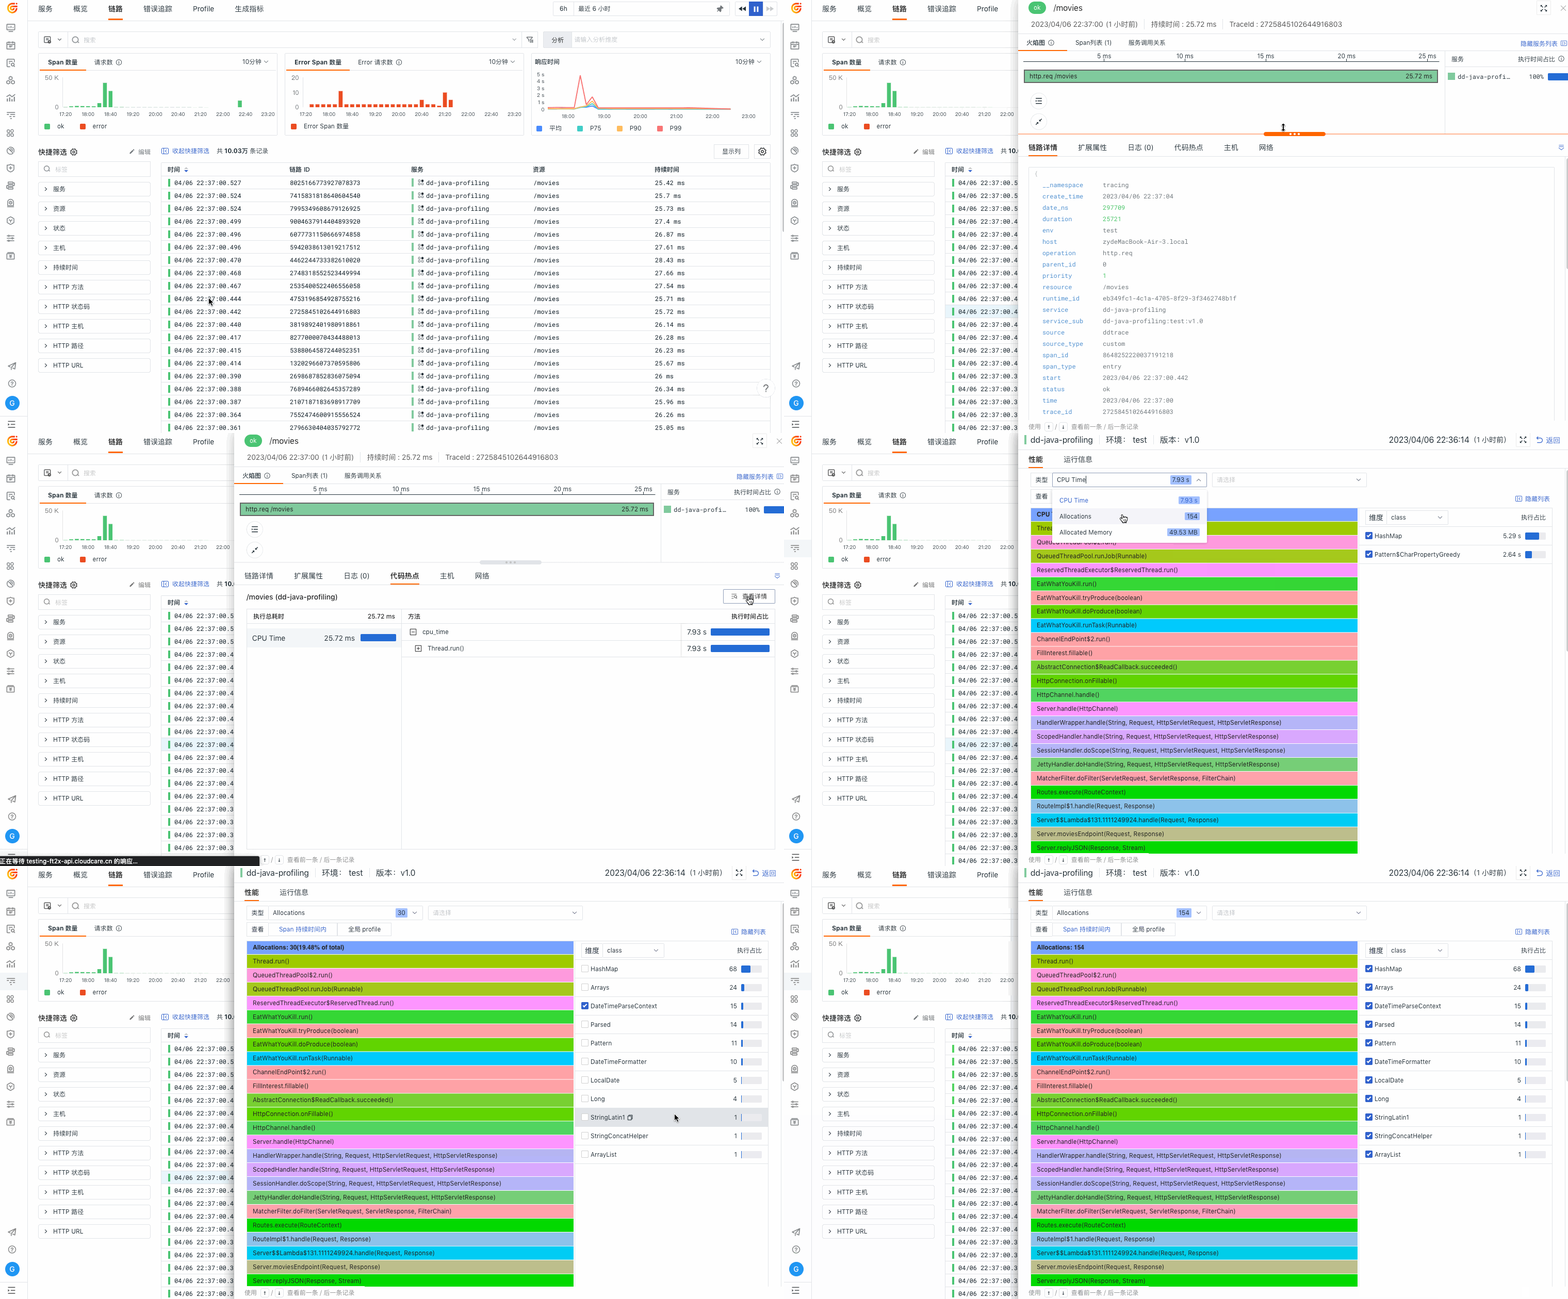
Jump from a slow request Span to the corresponding profile with one click, resulting in shorter root causes
Guance supports Profile data associated at the SPAN level. When reviewing slow requests or exception chains, you can obtain code hotspots, method call lists, and time usage proportions within the corresponding time window, helping the team determine whether the bottleneck stems from business logic, dependency calls, resource contention, or runtime issues.
Jump from a slow request Span to the corresponding profile with one click, resulting in shorter root causes

Frequently asked questions

What is Profiling Performance Analysis?

Profiling helps teams identify code-level performance bottlenecks in production environments by sampling application runtime data on CPU, memory, lock waiting, IO, slow queries, and function calls.

What is the difference between Profile and APM Trace?

APM Trace mainly shows which services a request passes through and the time spent per segment; Profile further demonstrates code methods, call stacks, and resource consumption, helping explain why slow requests are slow.

What issues is profile analysis suitable for troubleshooting?

It is suitable for troubleshooting issues such as slow interfaces, high CPU usage, abnormal memory allocation, lock waiting, IO blocking, high function time consumption, and performance degradation in production environments.

Can Profile be linked to link tracing?

Yes, you can. Guance supports associating slow request Span with corresponding time period profile data, helping teams further target specific code hotspots for service time.

Explore more

Resources and further reading

Choose the next step from product documentation, related solutions, and technical guidance.

Related reading

Selected product practices, troubleshooting guidance, and technical solutions

Want to see how Profile analysis applies to your business system?

Book a demo