Contact us

Join the community

Scan with WeChat
Join the official community group

Try Guance

Start online with usage-based pricing and a true cloud service.

Get started

Choose a Guance edition

Code repositories

Network Performance Monitoring

Network performance monitoring

When delays, packet loss, abnormal connections, or traffic spikes occur between hosts, Pods, or services, Guance network performance monitoring and monitoring capabilities help teams pinpoint where network issues occur through eBPF network data, real-time topology, upstream and downstream relationships, and BPF network logs.

Network performance monitoring
Book a demo

What problems does network performance monitoring solve?

Turn invisible network paths into analyzable traffic, topology, and logs

Network performance monitoring brings network traffic across cloud, containers, hosts, and applications into a single view, filling in the inter-service call context that traditional network monitoring cannot cover, and helping teams locate latency, packet loss, abnormal connections, and dependency path issues. It is suitable for Kubernetes, microservices, multi-cloud, and hybrid infrastructure scenarios.

No need to modify application code; directly collect host and container network data
Collecting network connection, throughput, latency, and error data based on eBPF requires no modification of application code or the need to embed points in each service. Whether host, Pod, Deployment, Service, or cloud instances and container platforms, the same network observation view can be integrated, providing a foundation for subsequent topology analysis and alerts.
No need to modify application code; directly collect host and container network data
Where exactly is the network getting stuck? Use topology to clearly see upstream and downstream and dependency paths
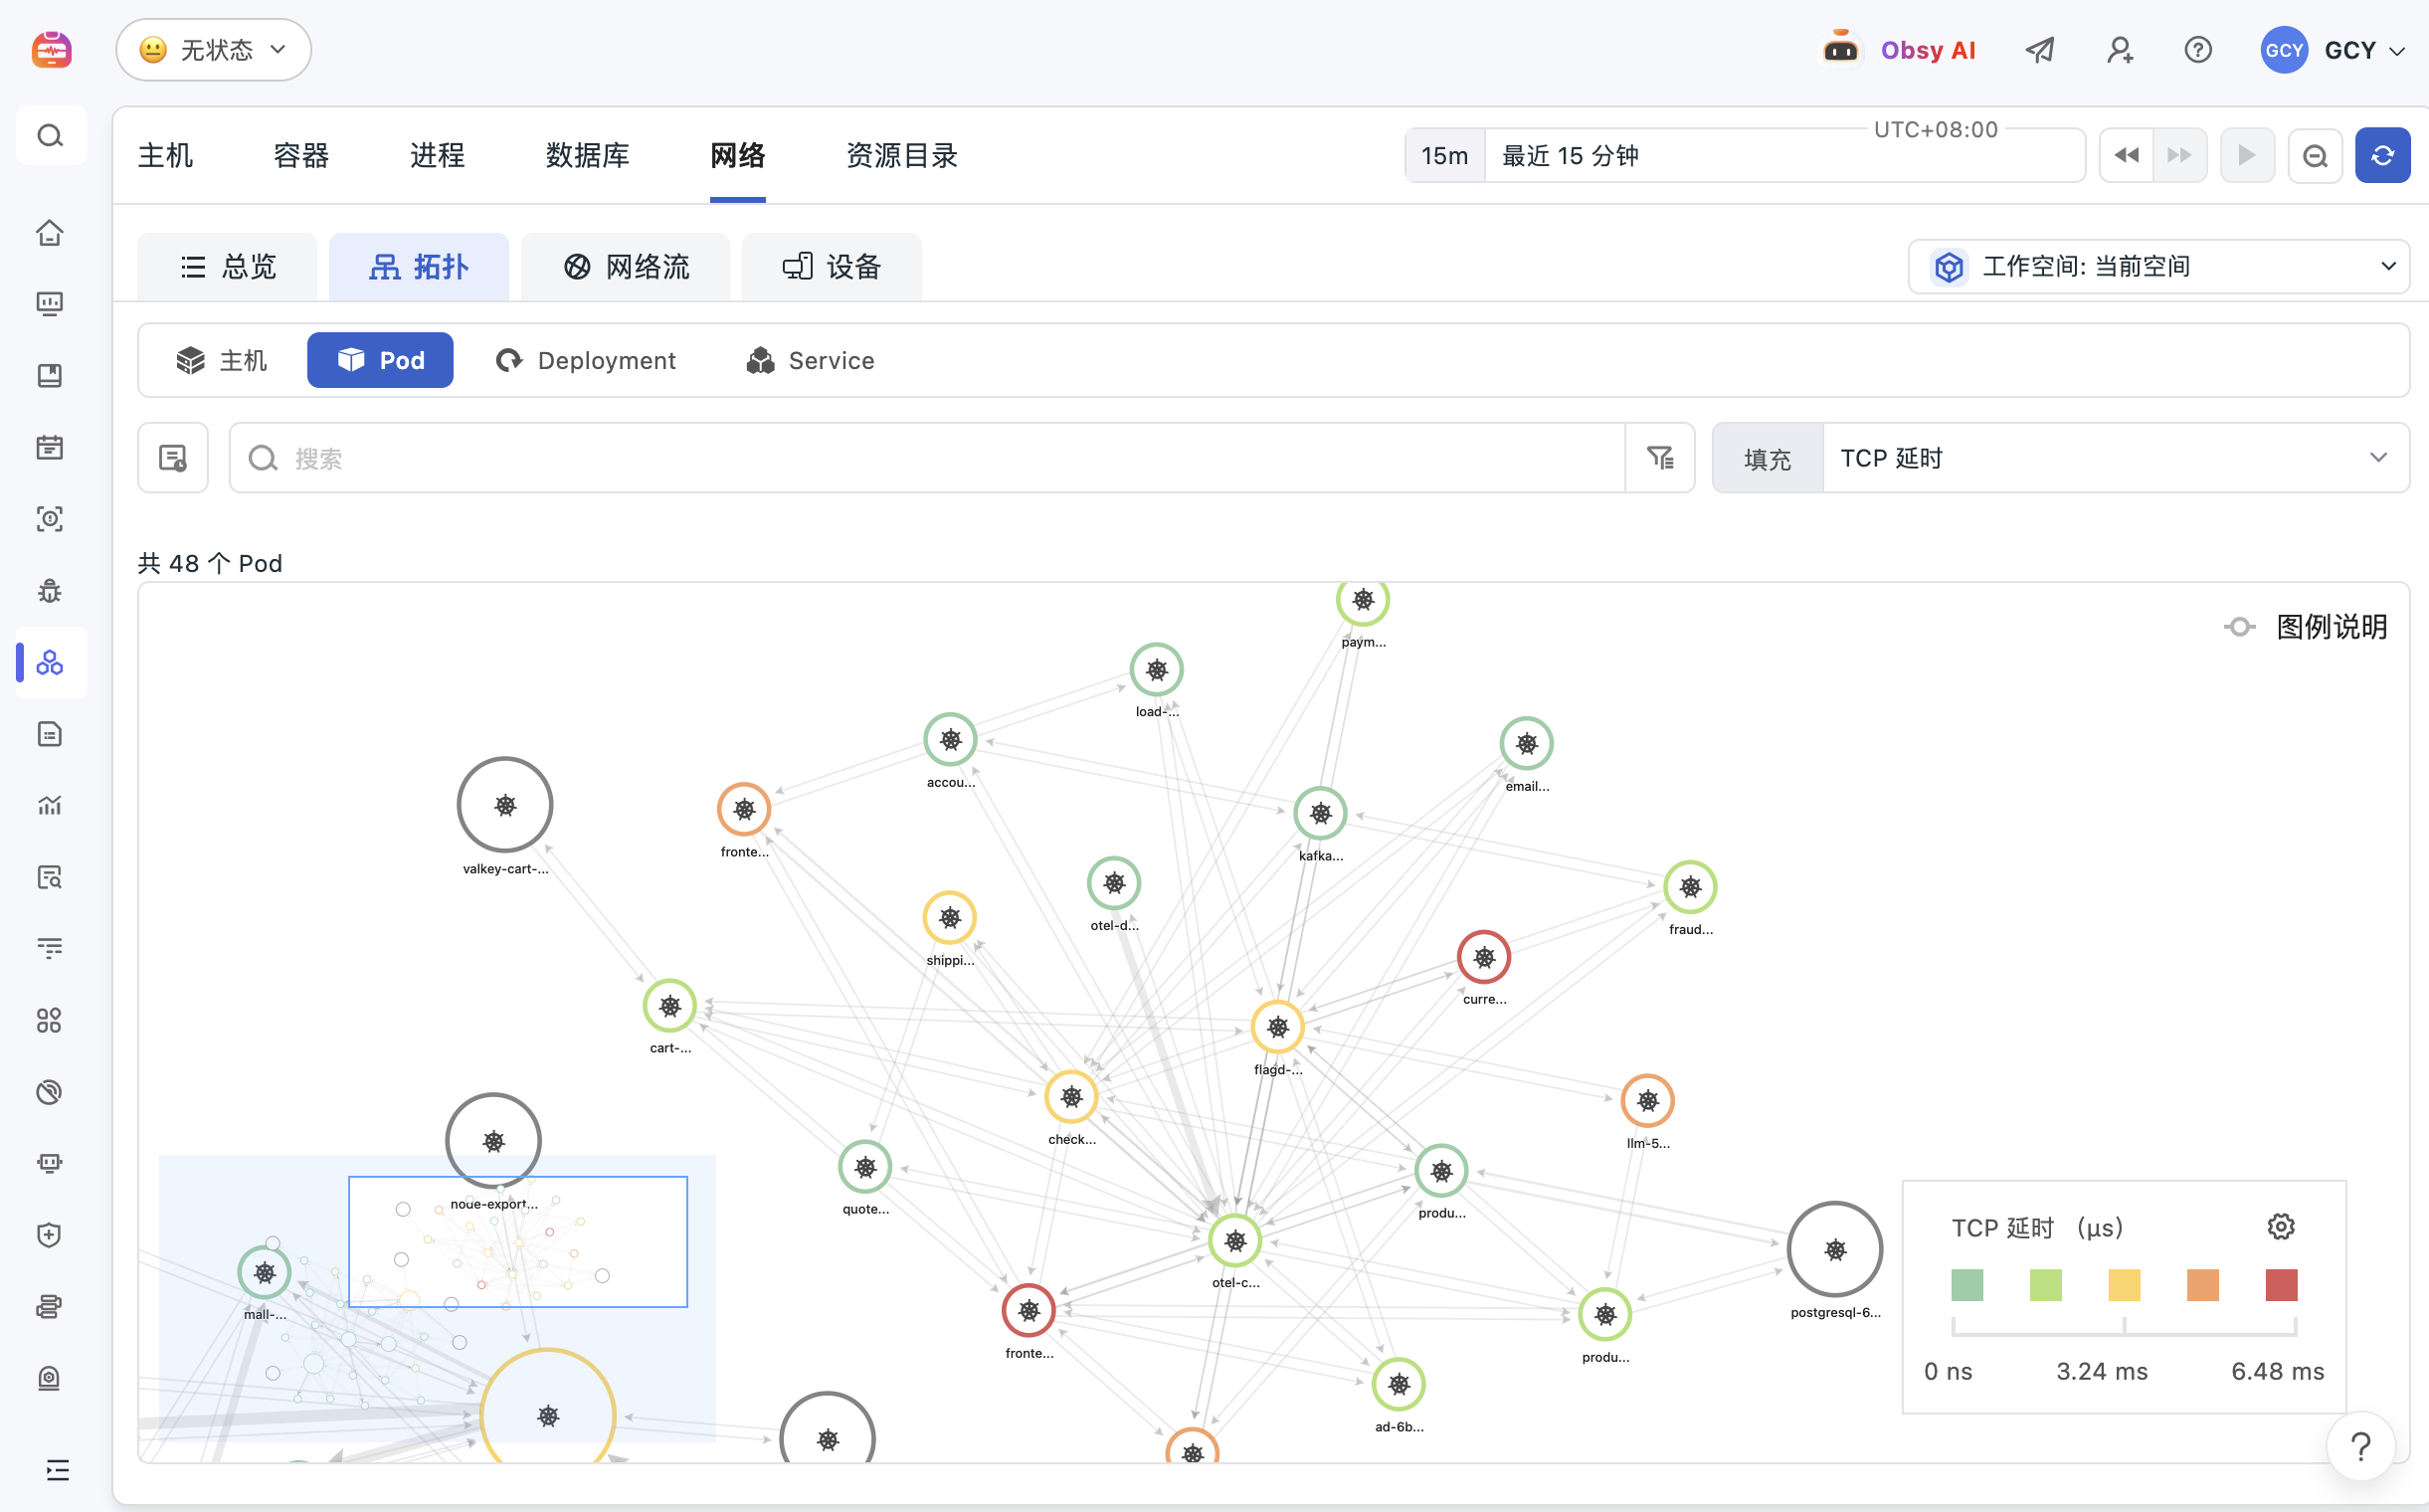
The system automatically maps the network topology among hosts, pods, deployments, and services, displaying real-time traffic directions and upstream and downstream relationships. When delays, packet loss, or abnormal connections occur, teams can first assess the impact range from topology, then drill into associated logs, links, and events, reducing the tug-of-war between "network and application issues."
If traffic spikes or connection anomalies, they can be directly converted into monitors and alarms
Configure dashboards and monitors around network latency, traffic, connection count, errors, and service dependencies. When abnormal traffic occurs in a service, namespace, host, or region, Guance can group and locate them with unified tags, helping teams receive notifications before business is affected and quickly confirm their scope of responsibility.
If traffic spikes or connection anomalies, they can be directly converted into monitors and alarms
When evidence is needed, BPF network logs are used to restore the request flow
BPF network logs record information such as connection, direction, port, protocol, and request path, supporting quick filtering by source, destination, host, pod, service, and other criteria. Layer 4 network logs can be linked to level 7 HTTP information, helping teams see methods, paths, and critical network events, providing traceable evidence for cross-service network issues.

Frequently asked questions

What problems does network performance monitoring mainly solve?

Network performance monitoring is mainly used to identify latency, packet loss, abnormal connections, traffic spikes, and dependency path issues between hosts, pods, services, and cloud resources. Guance analyze network issues back into application and infrastructure contexts through eBPF, network topology, and BPF network logs.

Do I need to modify the application code to collect network data using eBPF?

No, it is not necessary. eBPF can collect connection, traffic, and network performance data at the system layer without relying on application code for pinning. Teams can first integrate basic network metrics and logs, then combine services, pods, hosts, and traces for correlation analysis.

What is the difference between network topology and BPF network logs?

Network topology is suitable for viewing traffic directions and dependencies among hosts, pods, deployments, and services from a holistic perspective; BPF network logs are suitable for drilling down specific connections, ports, protocols, request paths, and exceptions when evidence is needed; combining the two can move from overview to detail.

Is network performance monitoring suitable for Kubernetes scenarios?

Fitting. In Kubernetes environments, the relationships between Pods, Services, Deployments, and nodes are complex, and network issues are often difficult to reproduce. Guance can observe network status by namespace, workload, Pod, service, and host dimensions, and correlate container, log, and link data.

Related reading

One trick to decode the network traffic bottleneck!

One trick to decode the network traffic bottleneck!

Guance network supports viewing network traffic between hosts, pods, deployments, and services. View network traffic and data connection between the source IP and the destination IP based on the server and client. By visualizing real-time displays, it helps enterprises understand the network operation status of their business systems in real time, quickly analyze, identify traffic bottlenecks, and resolve them promptly, ensuring stable system operation.

Product capabilities
Comprehensive infrastructure monitoring to firmly safeguard your business stability!

Comprehensive infrastructure monitoring to firmly safeguard your business stability!

Infrastructure services are one of the key components of industrial digital transformation. As we repeatedly discuss how to achieve efficient and accurate global monitoring, perhaps we can draw inspiration from Guance approach of exploring, inspecting, and monitoring every key part of distributed infrastructure through a single solution.

Product capabilities
In-depth analysis Guance core design principles of intelligent monitoring

In-depth analysis Guance core design principles of intelligent monitoring

The intelligent monitoring solution achieves comprehensive monitoring of IT infrastructure and applications through a series of steps. Its overall implementation principles include data collection and preprocessing, feature engineering, predictive models, anomaly detection and verification, as well as alerts and notifications. These steps work together to form a complete monitoring loop, ensuring the stable and efficient operation of the user system.

Best practices
Guance: Secure and reliable monitoring Guance services

Guance: Secure and reliable monitoring Guance services

This article introduces Guance how to control data privacy to ensure user data security and compliance.

Best practices

Want to see how network performance monitoring is being implemented in your business systems?

Book a demo