Contact us

Join the community

Scan with WeChat
Join the official community group

Try Guance

Start online with usage-based pricing and a true cloud service.

Get started

Choose a Guance edition

Code repositories

Database Monitoring / Query Performance

Database monitoring

Guance database monitoring places database instances, SQL queries, session blocking, resource metrics, and logs from MySQL, PostgreSQL, SQL Server, Oracle, MongoDB, and other databases into a single troubleshooting view, helping R&D, DBA, and SRE quickly identify slow queries, lock waits, and database performance bottlenecks.

Database monitoring
Book a demo

What problems does database monitoring solve?

From instance load to SQL root causes, one-stop troubleshooting of database performance issues

When business interfaces slow down, order submission times expire, connection pools are full, or the database experiences lock waiting, Guance database monitoring can unify database QPS, load trends, congestion rates, Top SQL, session snapshots, host resources, slow query logs, and table structure information into a single context. Teams don't need to switch back and forth between database commands, logging platforms, APM, and infrastructure monitoring to determine whether the issue comes from query statements, session blockages, resource bottlenecks, or changes in database objects.

Supported database types

Covers mainstream database engines to uniformly troubleshoot performance and session issues

Guance database monitoring is based on DataKit Collector, placing instances, queries, sessions, metrics, and logs from databases such as MySQL, PostgreSQL, SQL Server, Oracle, MongoDB, and others into the same troubleshooting context.

Specific collection fields, metrics, and access methods are subject to the DataKit integration documentation.

Many database instances? First, let's look at the load, QPS, and congestion rate from a single view
- Centrally view the latest metrics for database instances in the current workspace, covering database address, instance name, type, version, runtime, QPS, load trends, and congestion rate.
- Quickly identify instances such as MySQL, PostgreSQL, Oracle, SQL Server, MongoDB, etc. through database type icons, suitable for DBA, SREs, and platform teams to conduct database inspections.
- Supports time ranges such as the most recent 2 hours, 6 hours, 1 day, and 2 days, making it easy to analyze issues from both short-term faults and medium- to long-term trend perspectives.
Many database instances? First, let's look at the load, QPS, and congestion rate from a single view
Is the business interface getting slower? Track Top Query, time, and wait status across databases
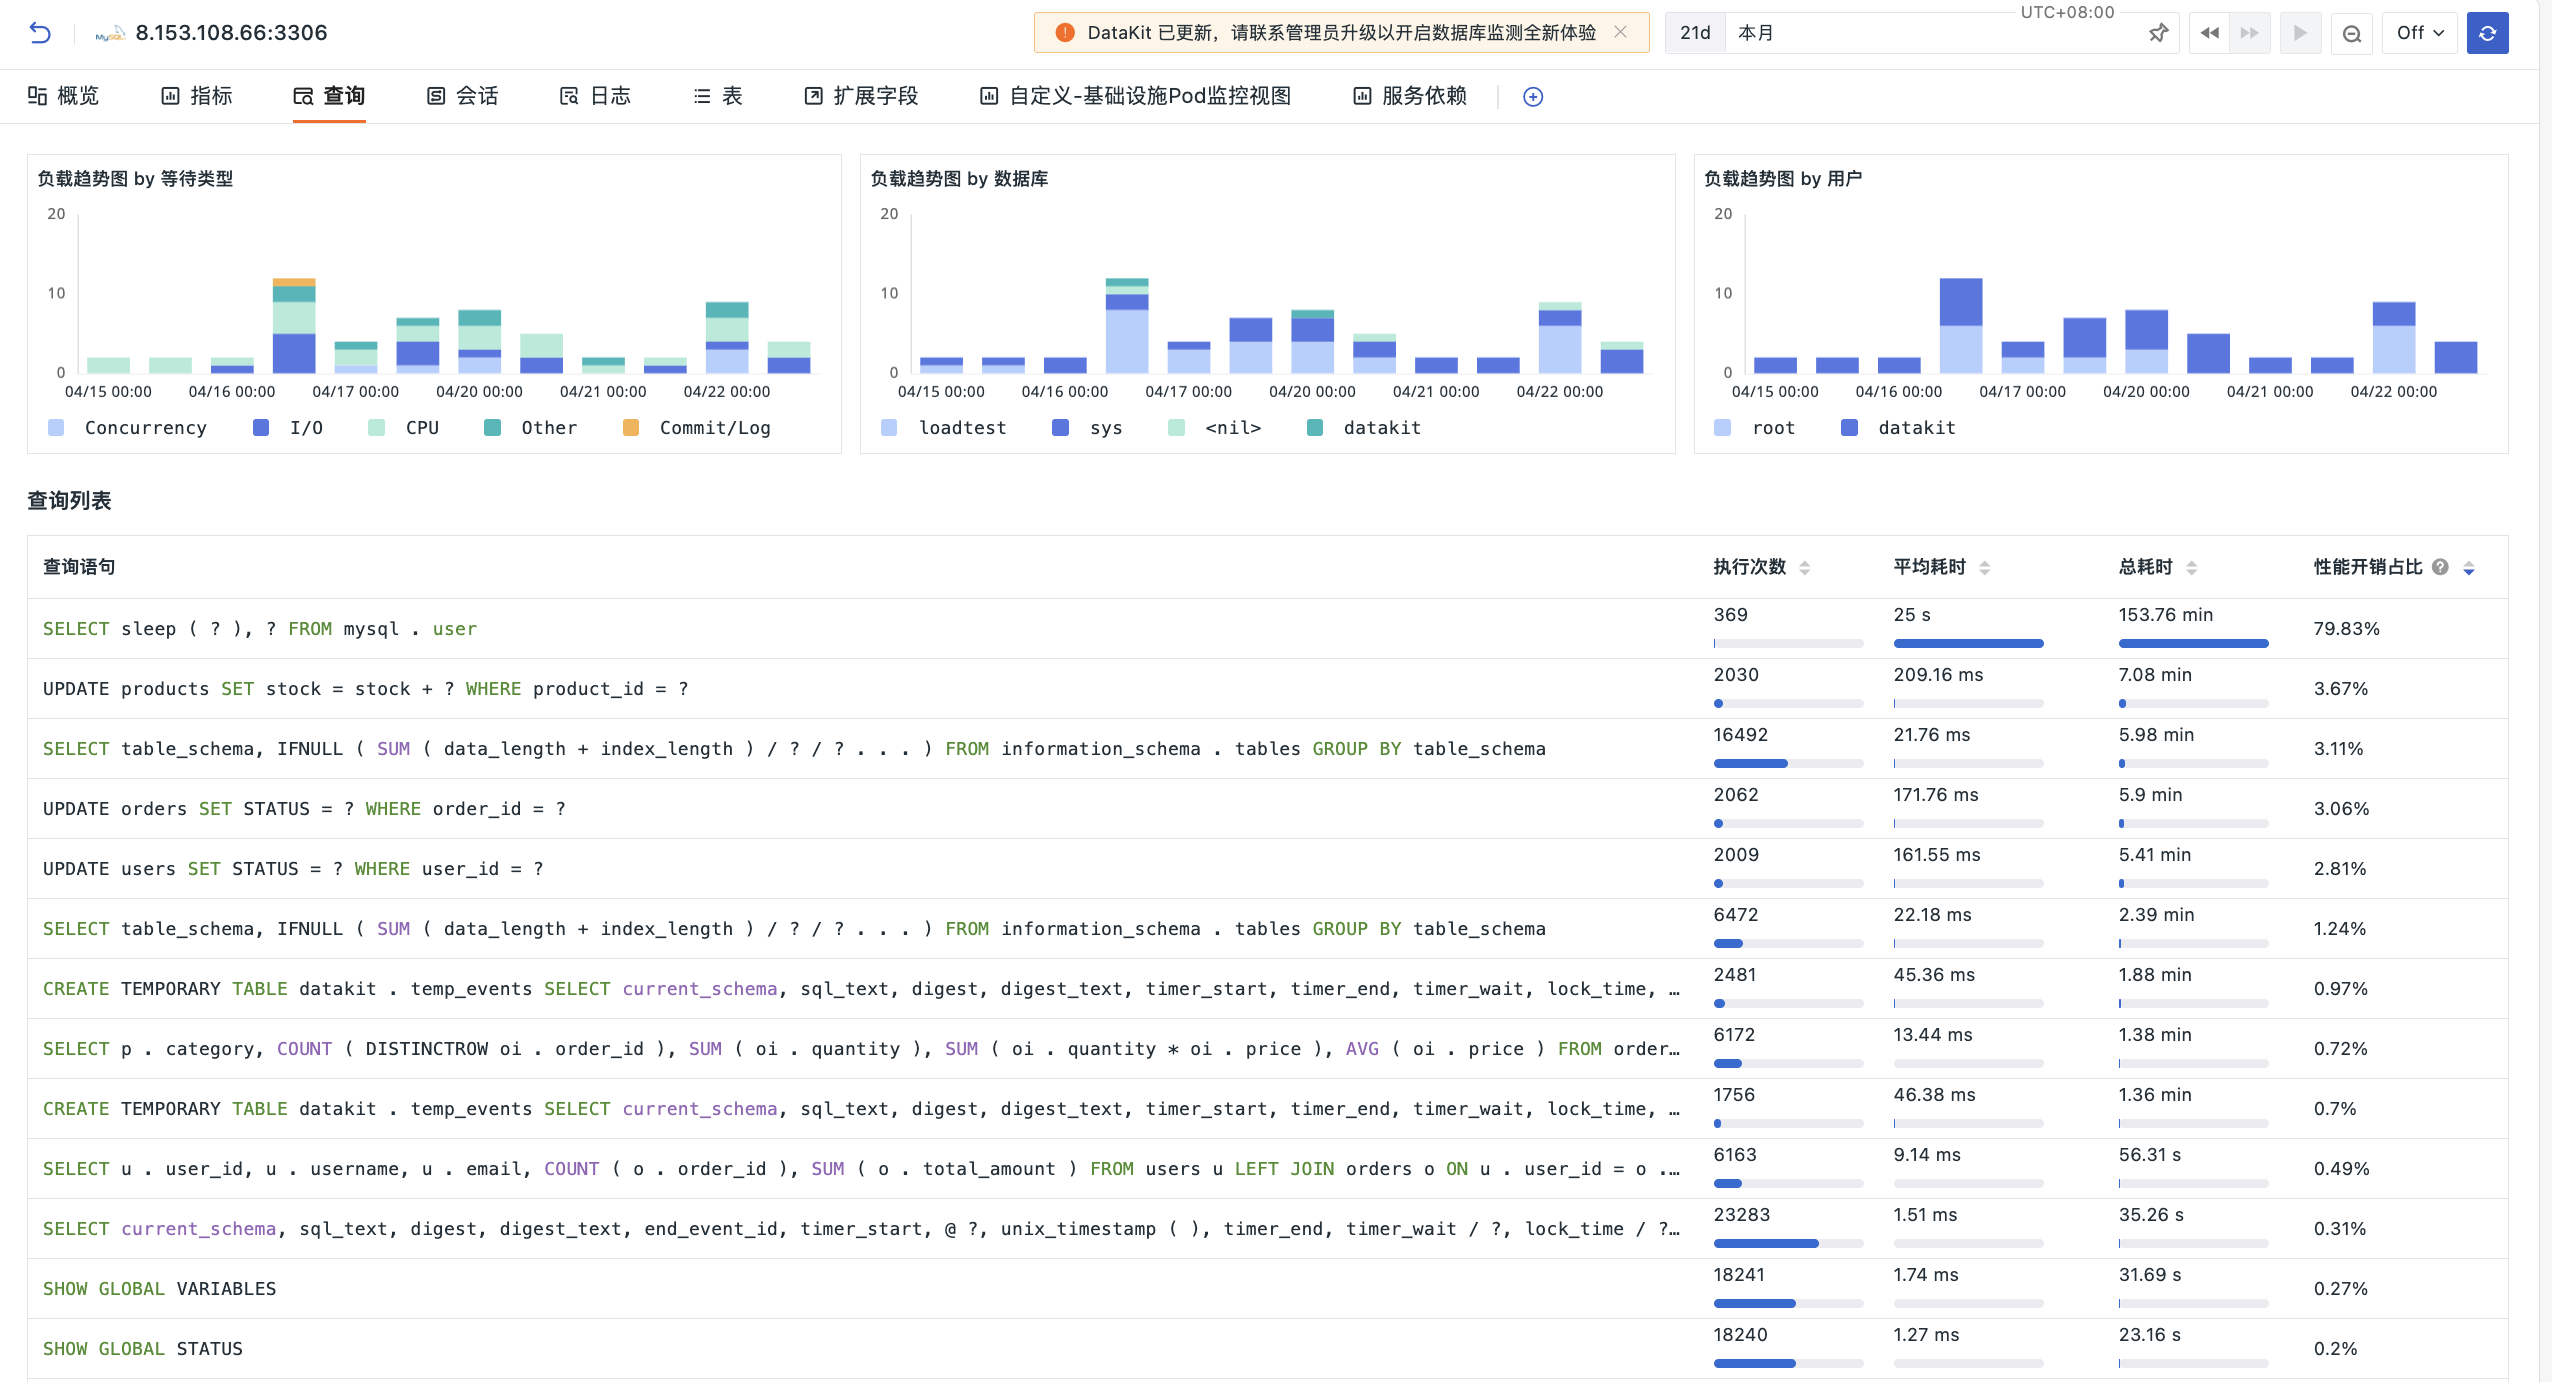
- In query views like MySQL and PostgreSQL, aggregate load trends by wait type, database, and user to quickly identify the most resource-consuming query.
- The query list displays execution count, average time, total time, and performance overhead ratio, helping the team determine whether performance degradation is caused by SQL itself, waiting for events, or resource competition.
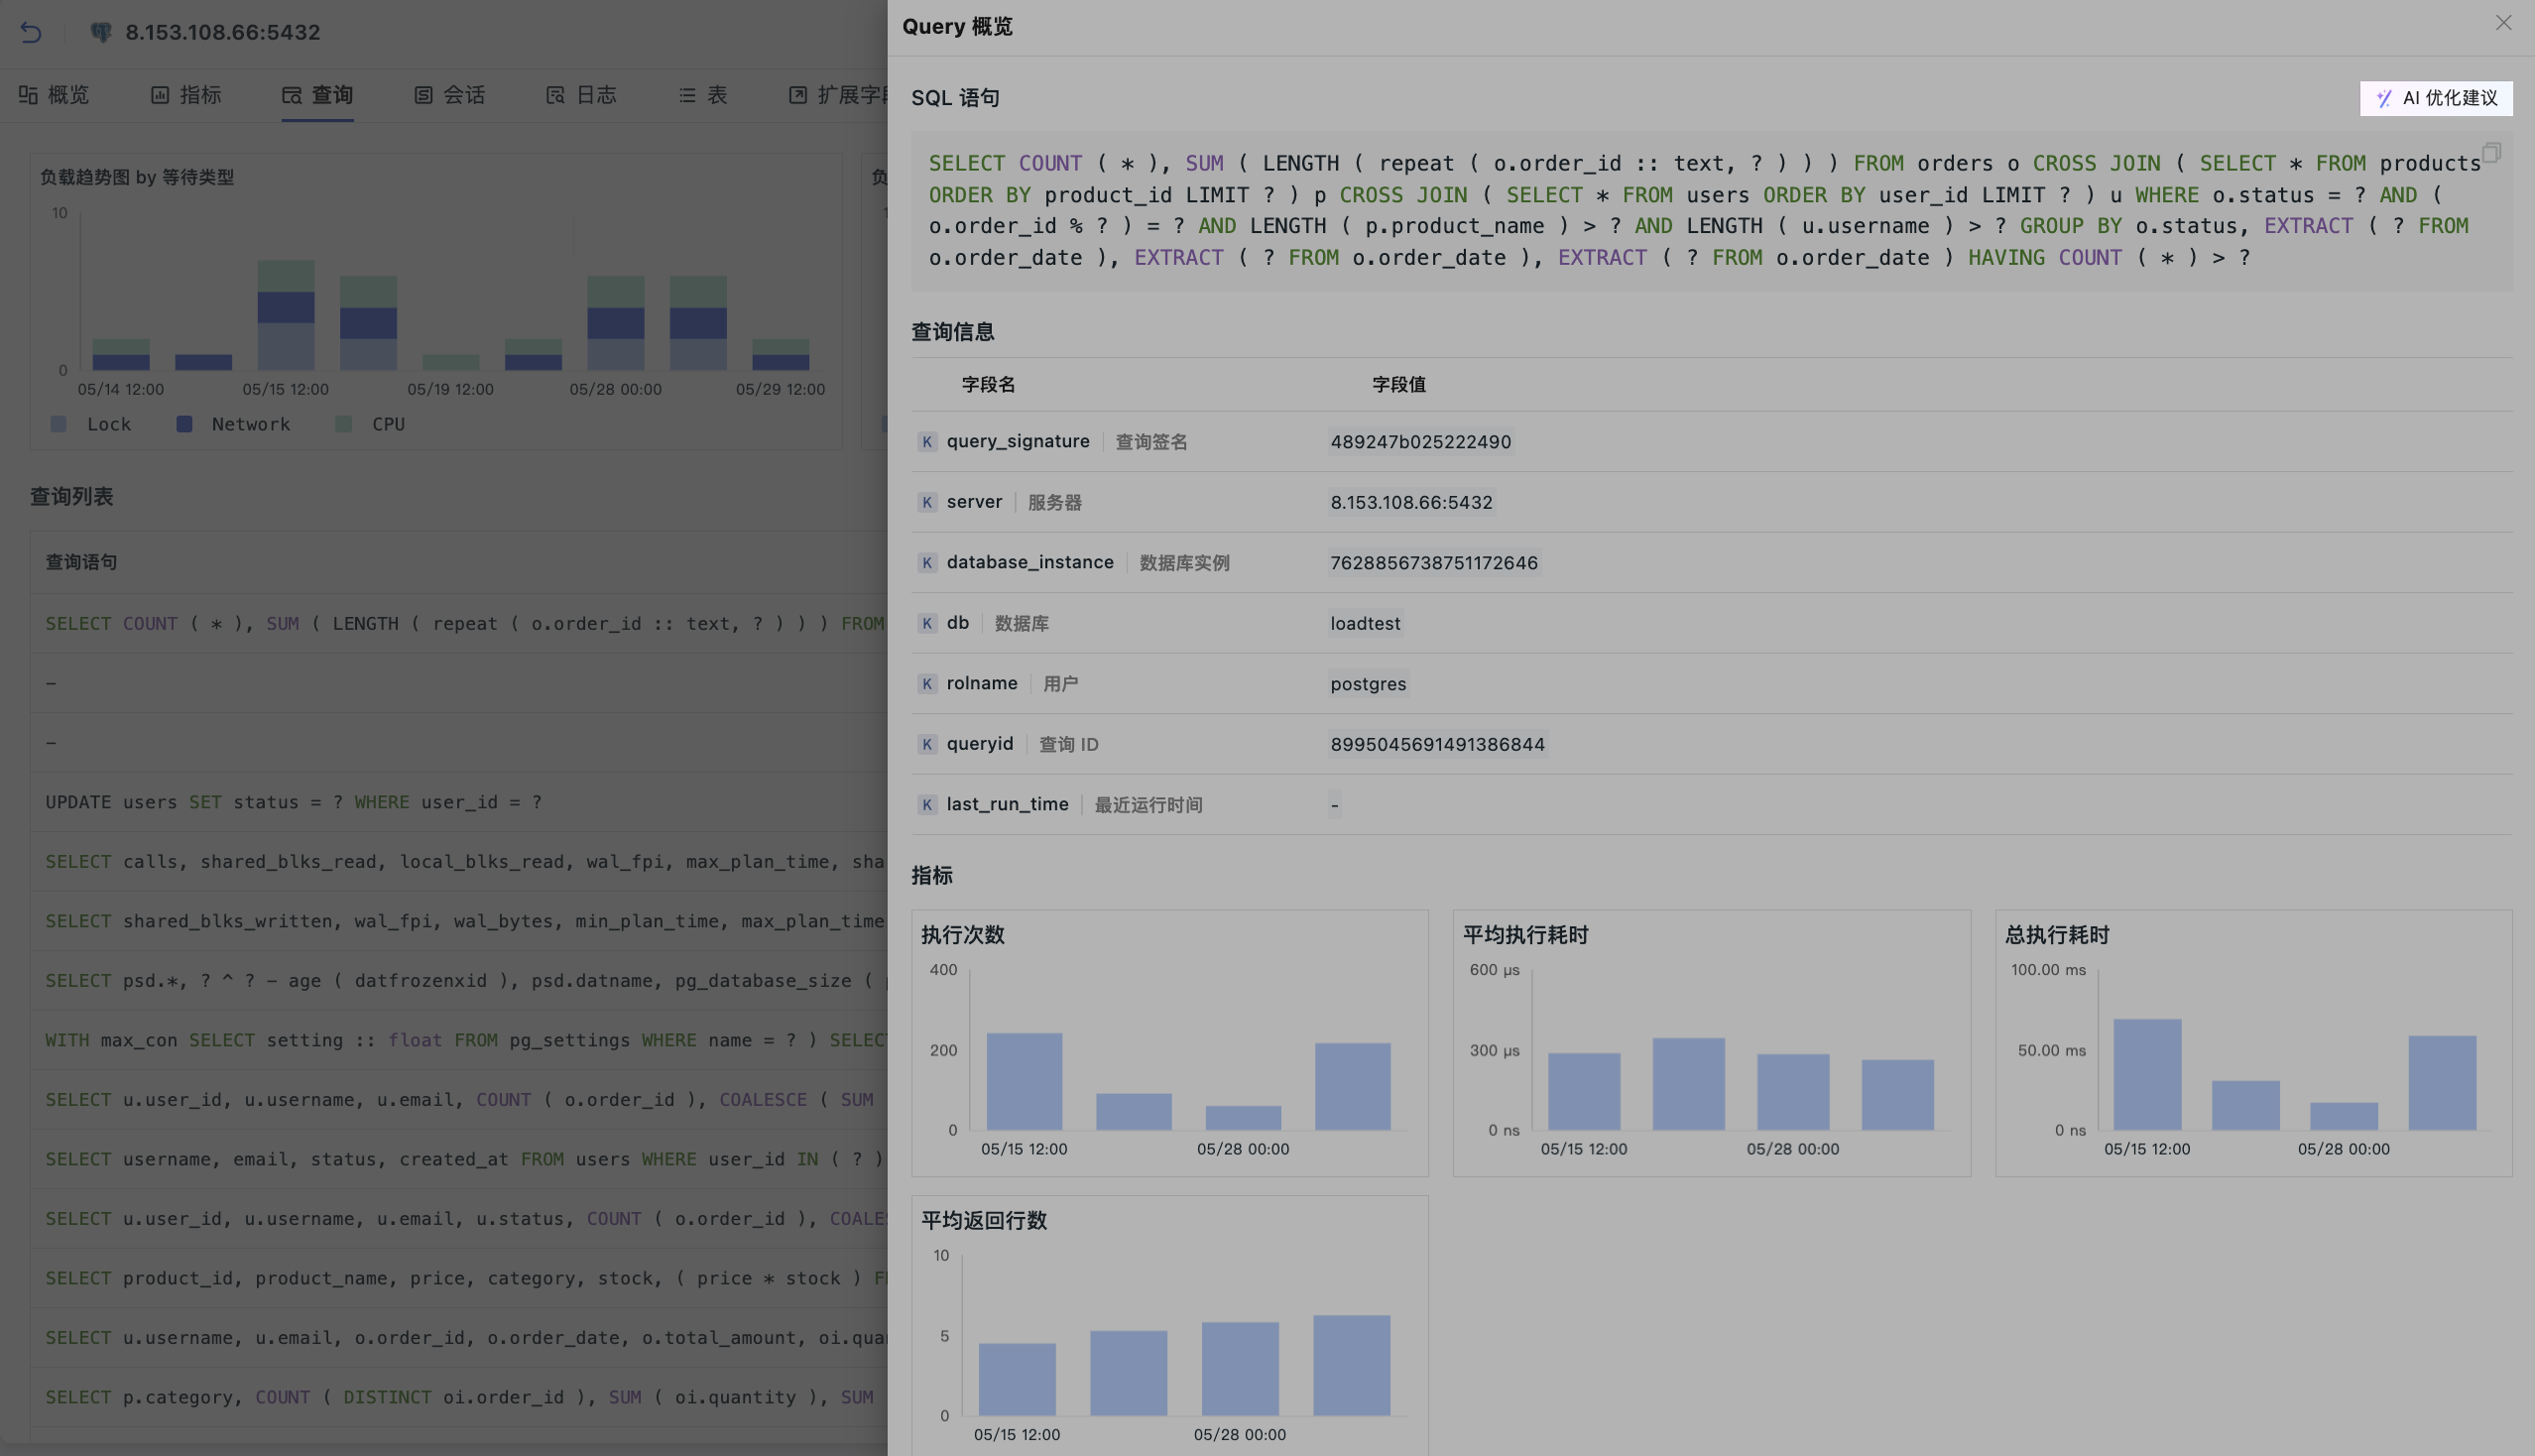
- Click any query to access the overview and sampling details, continuing to view statements, performance trends, and full log context.
Is lock waiting and connection stacking hard to explain? Use session snapshots to locate root blocking queries
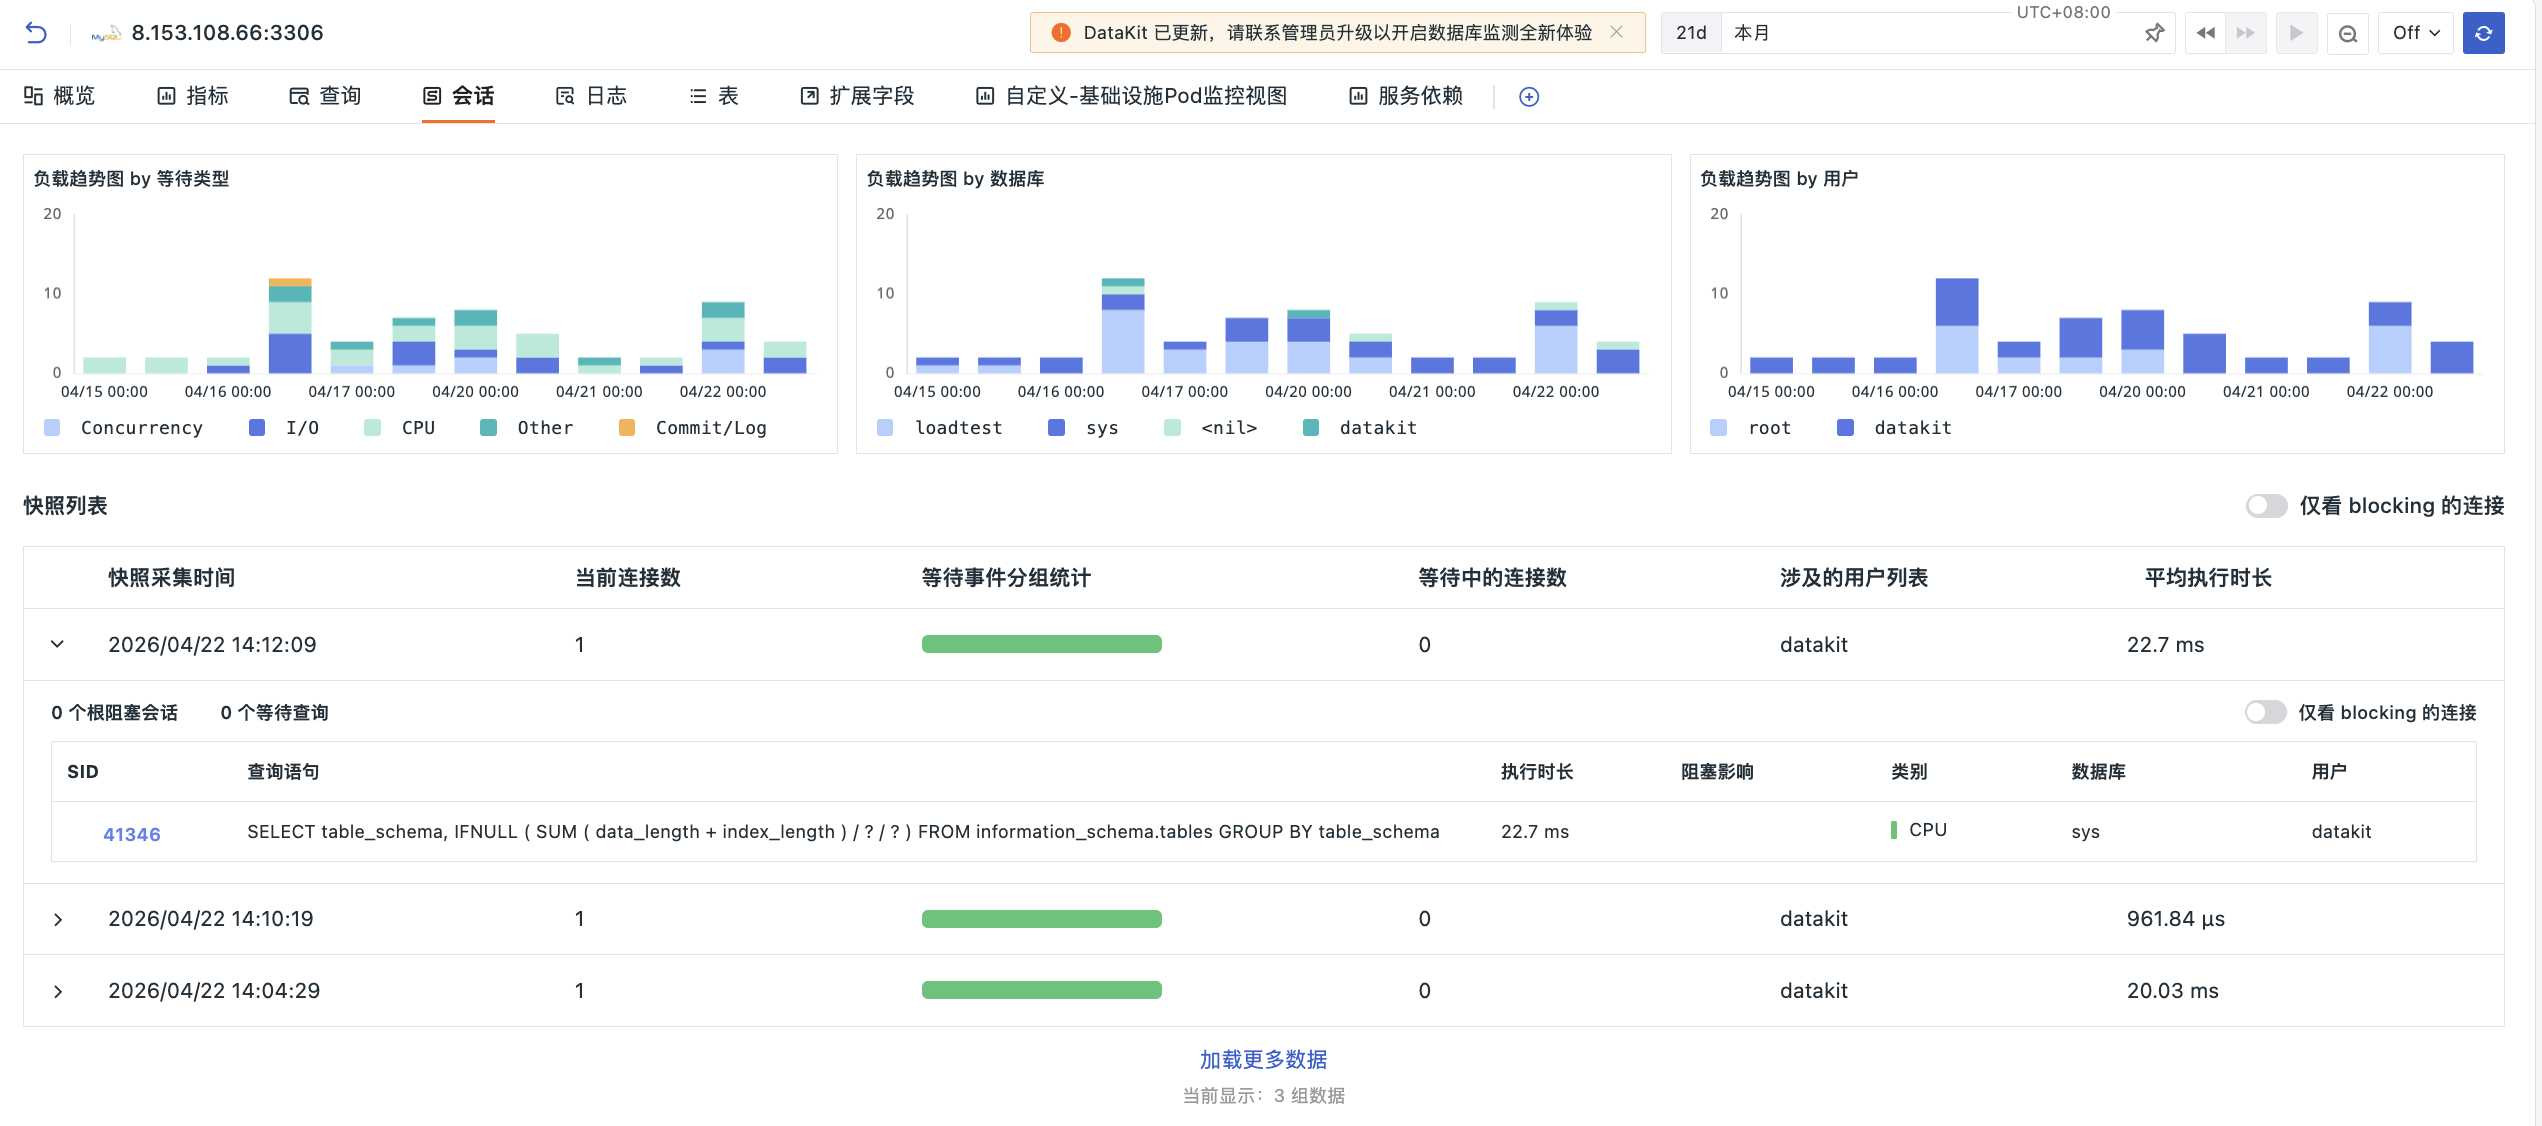
- The session view focuses on connection sessions, lock waits, and block analysis, with active session load trends displayed at the top by wait type, database, and user.
- Aggregate the snapshot list by collection time point by current number of connections, distribution of waiting events, number of connections in waiting, involved users, and average execution time.
- After expanding the snapshot, you can view the number of root blocking sessions, pending queries, and session details, and quickly narrow the problem scope with "Only Blocking Connections."
Is lock waiting and connection stacking hard to explain? Use session snapshots to locate root blocking queries
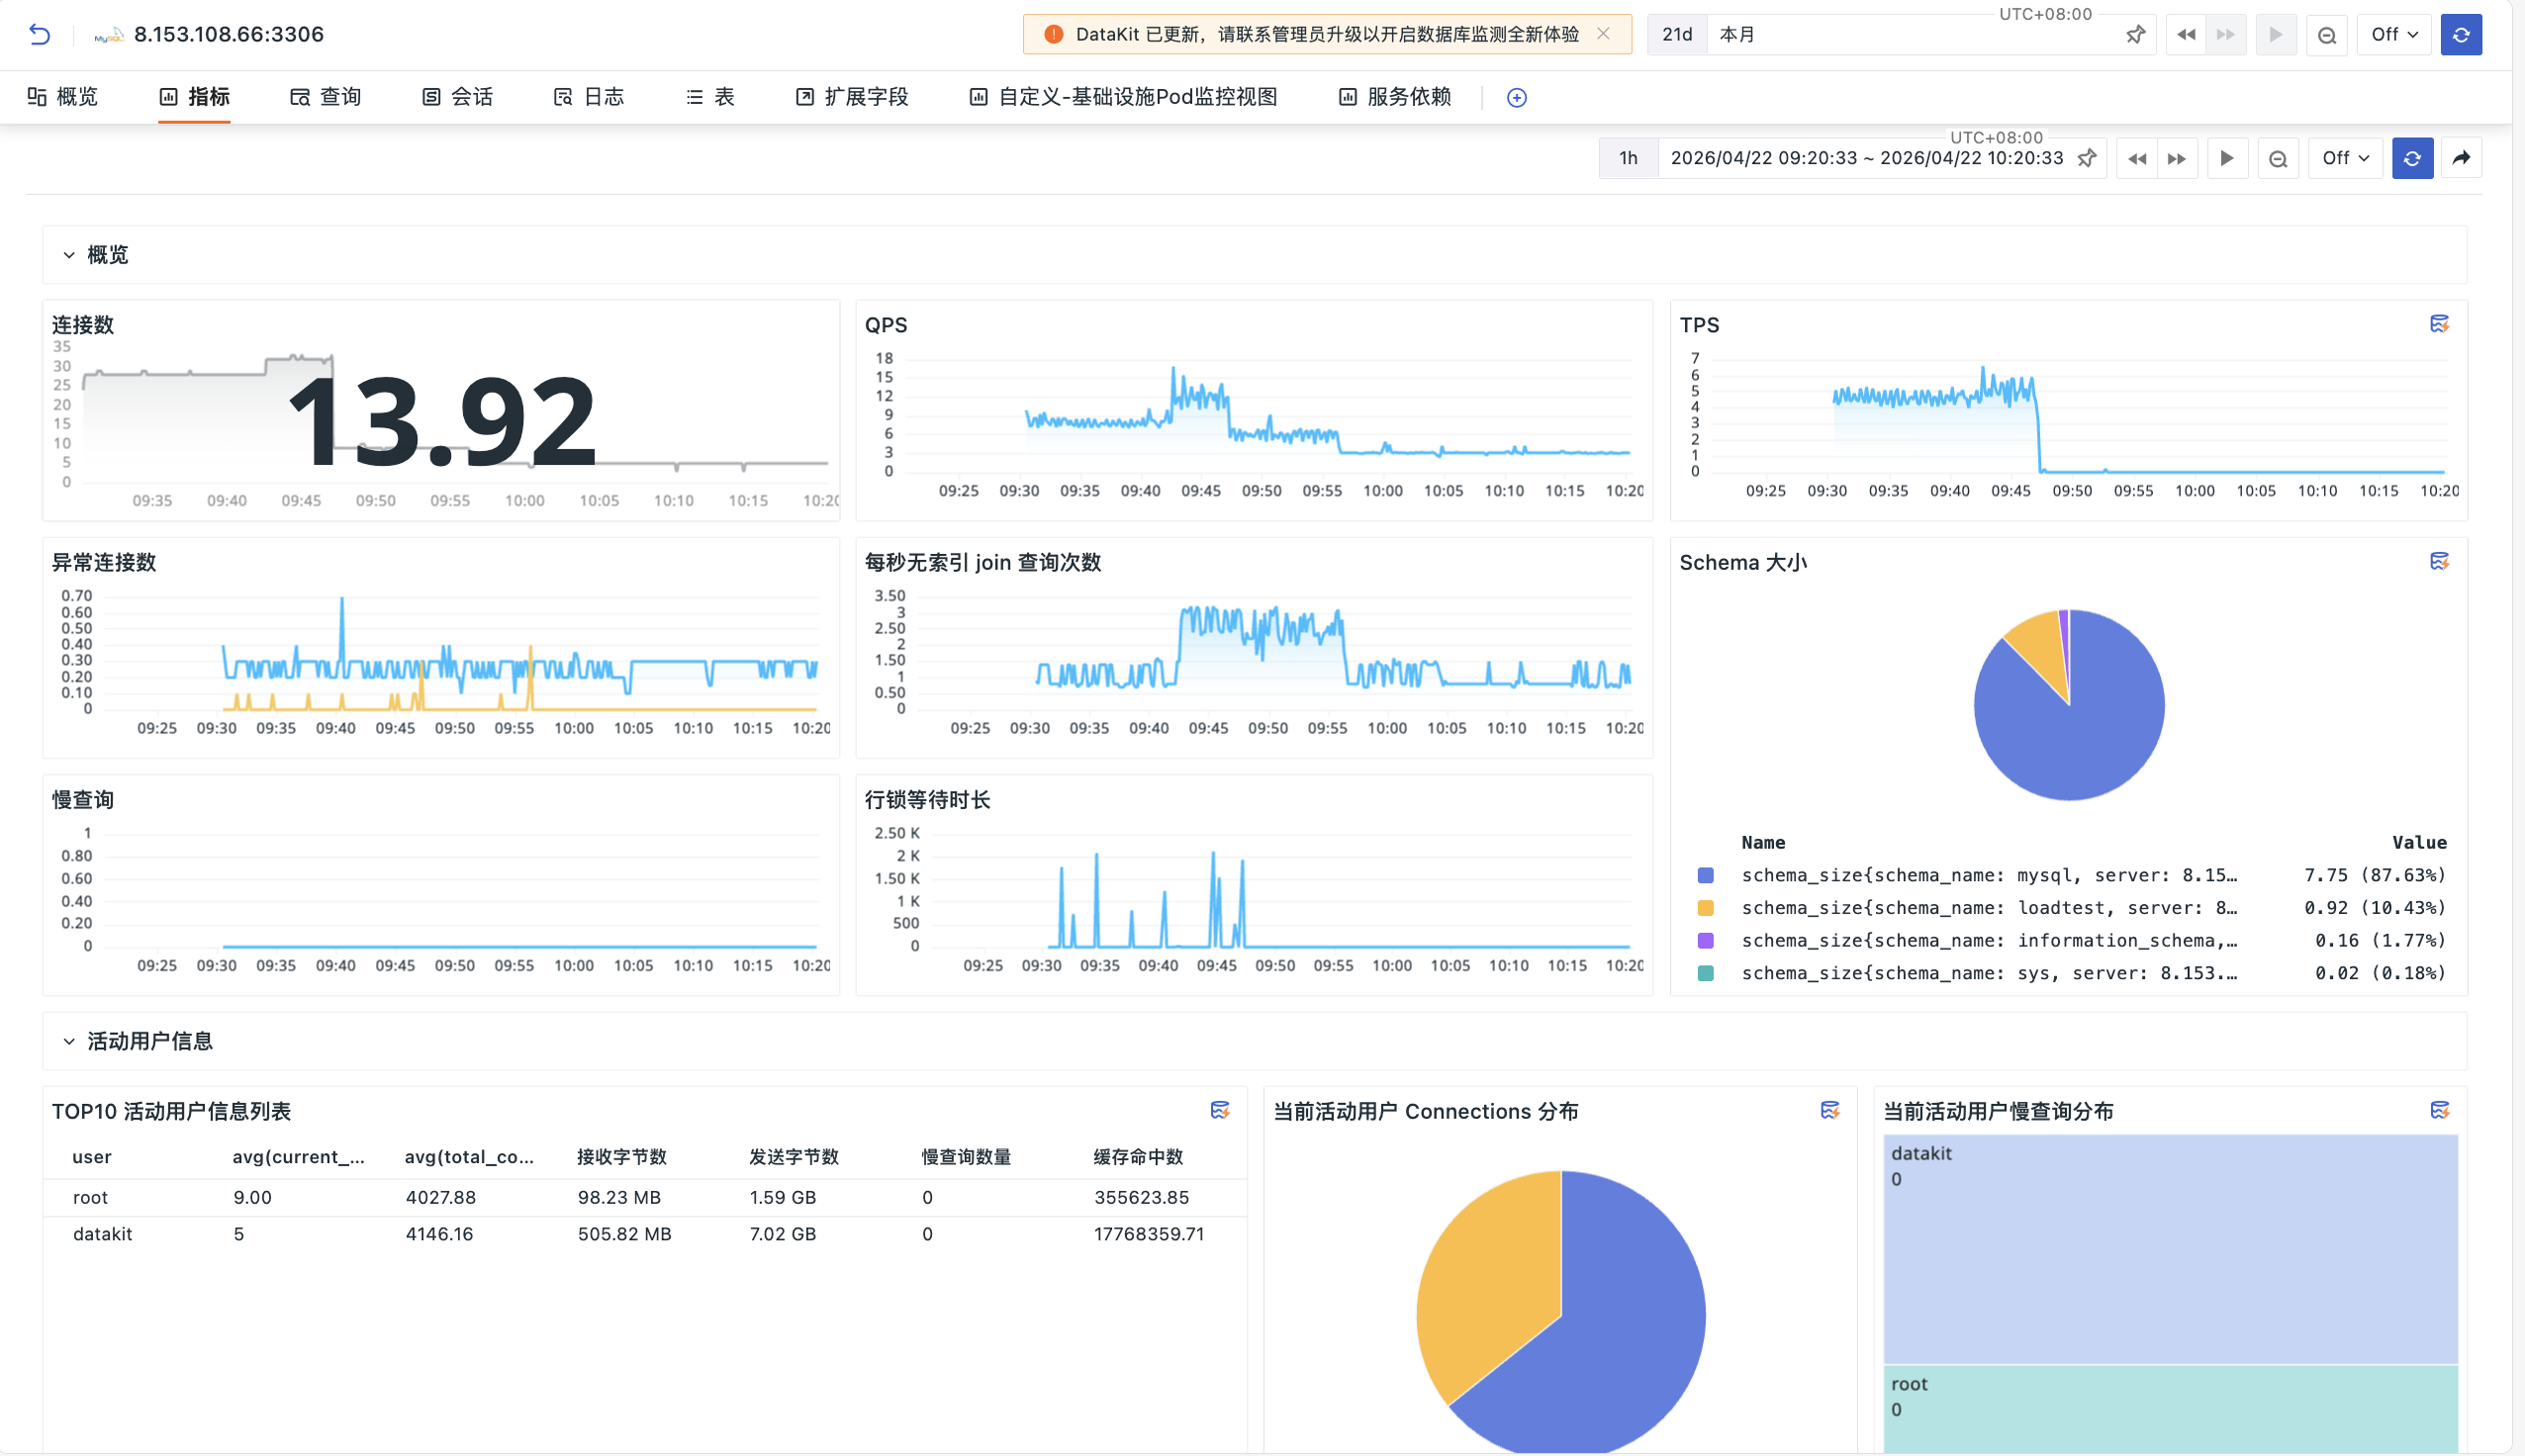
Database metrics alone aren't enough? Associate host resources, slow query logs, and table structures
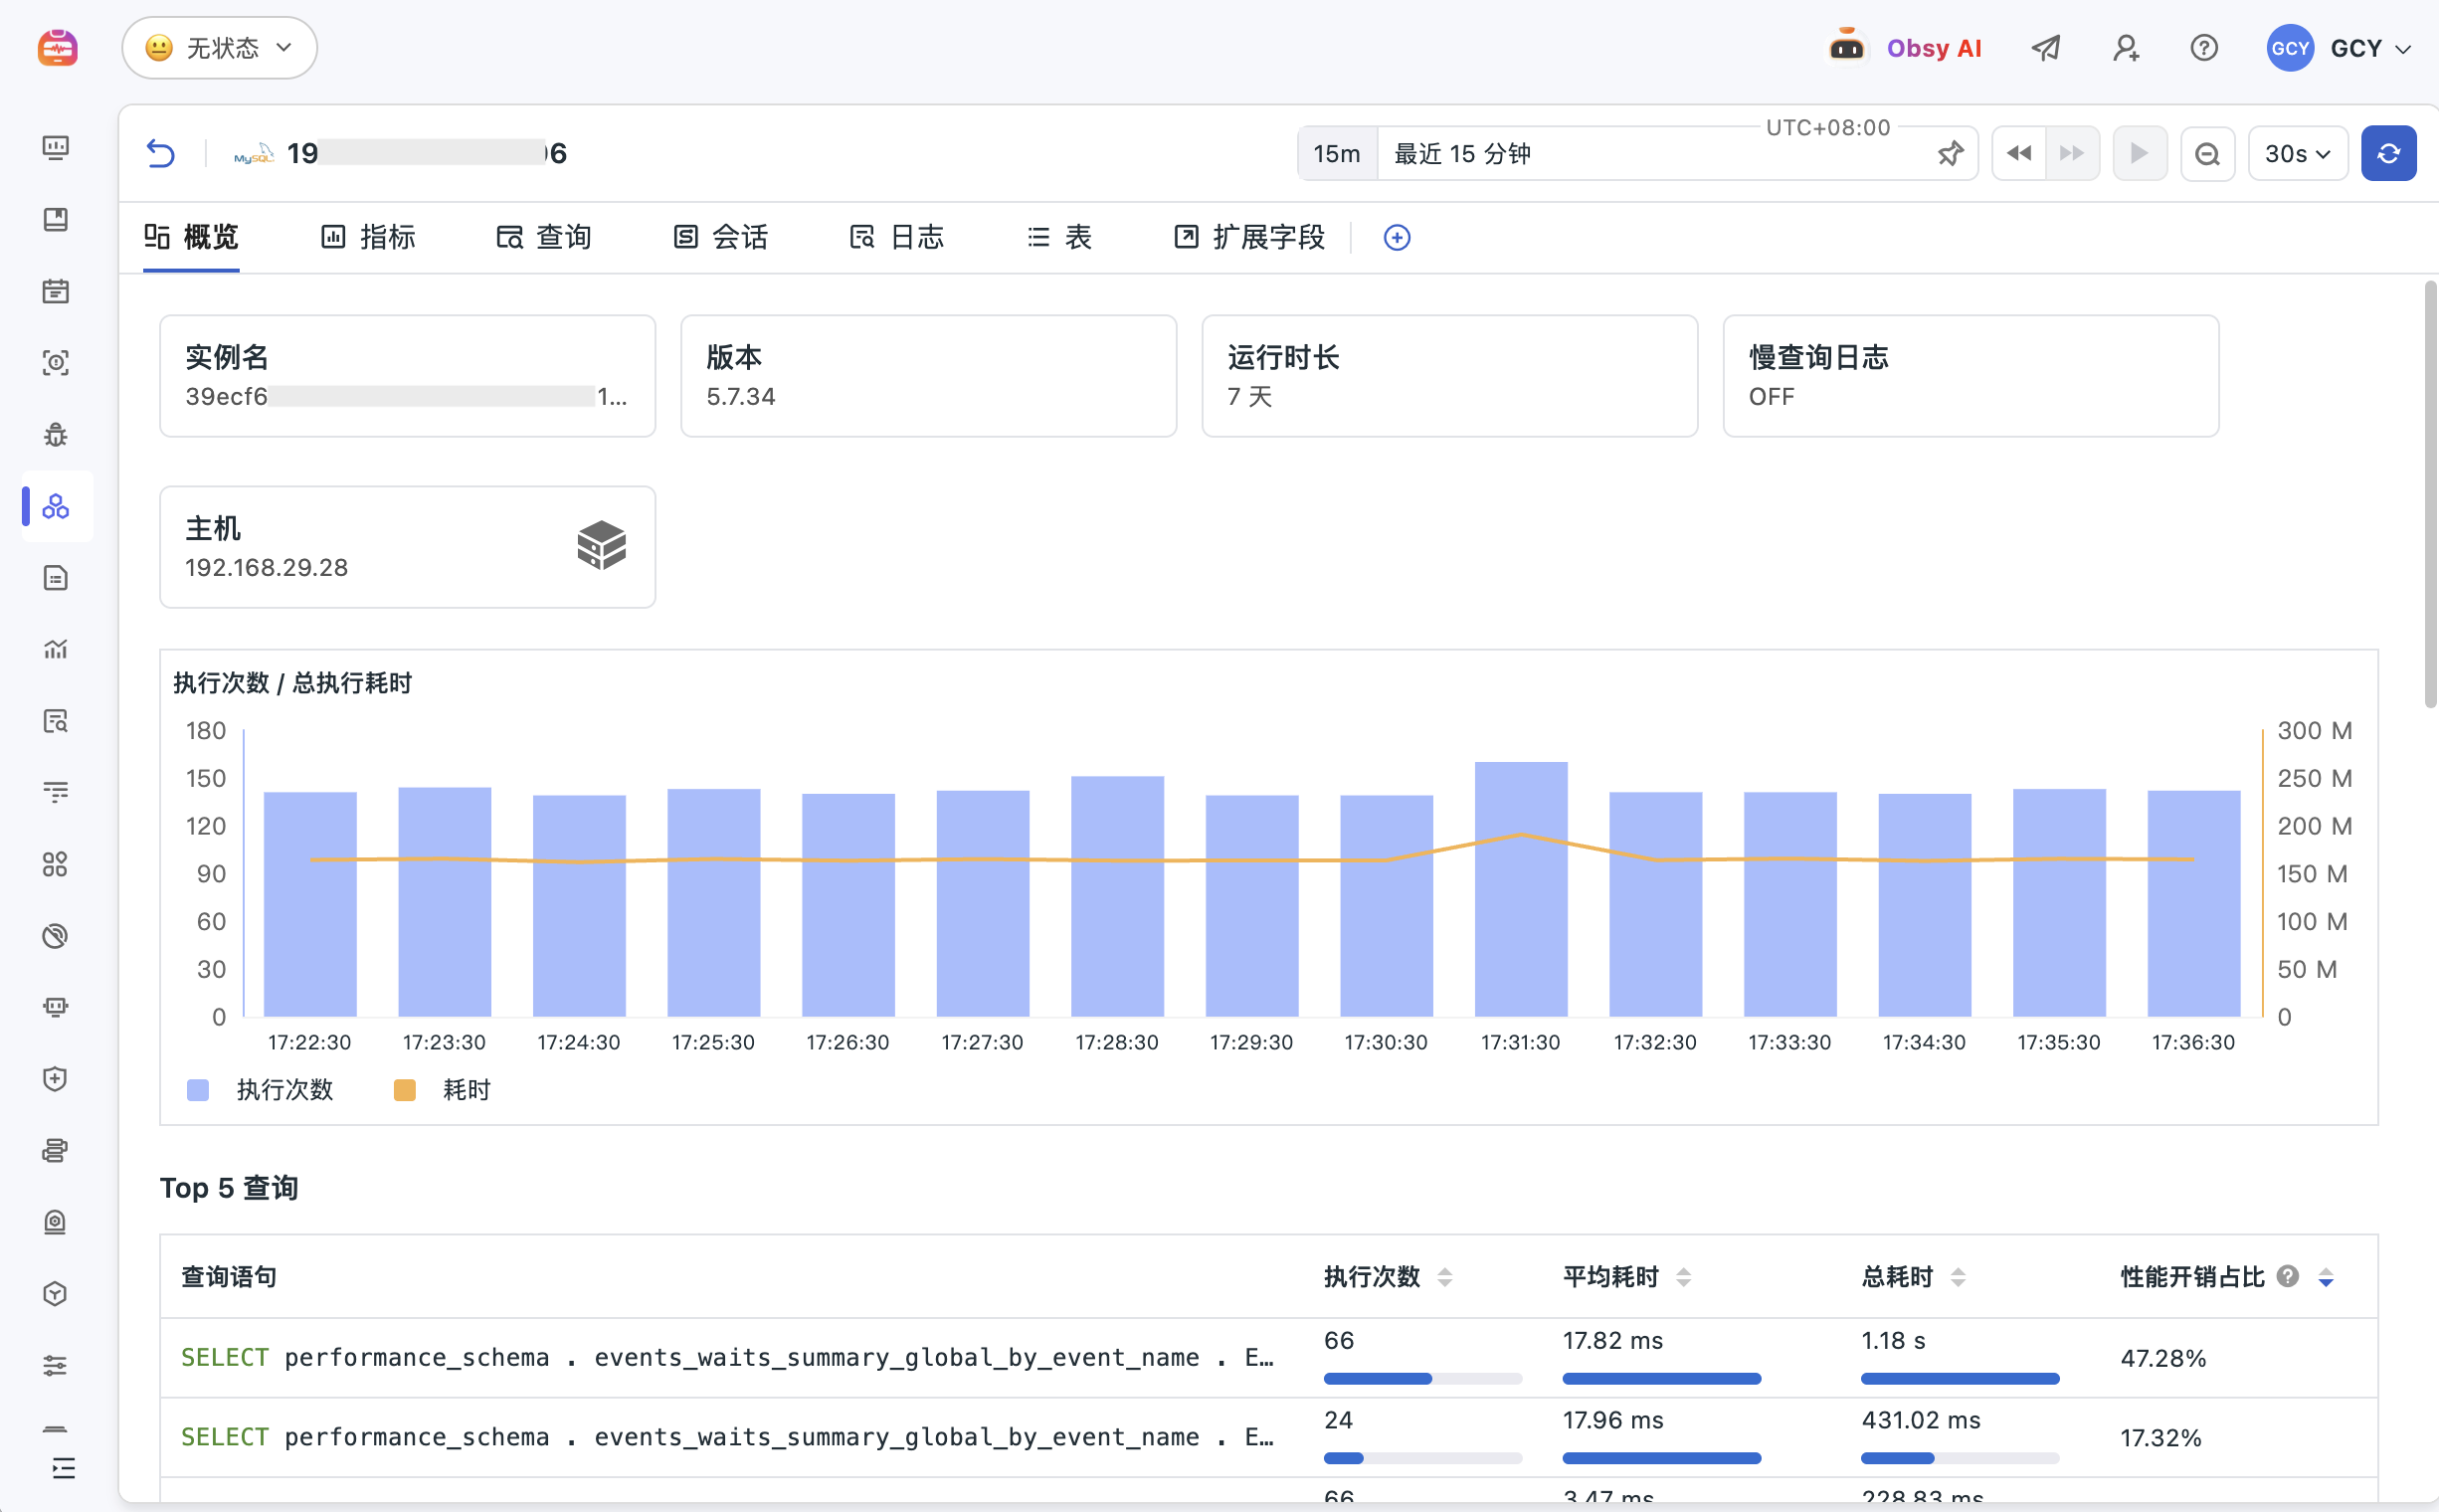
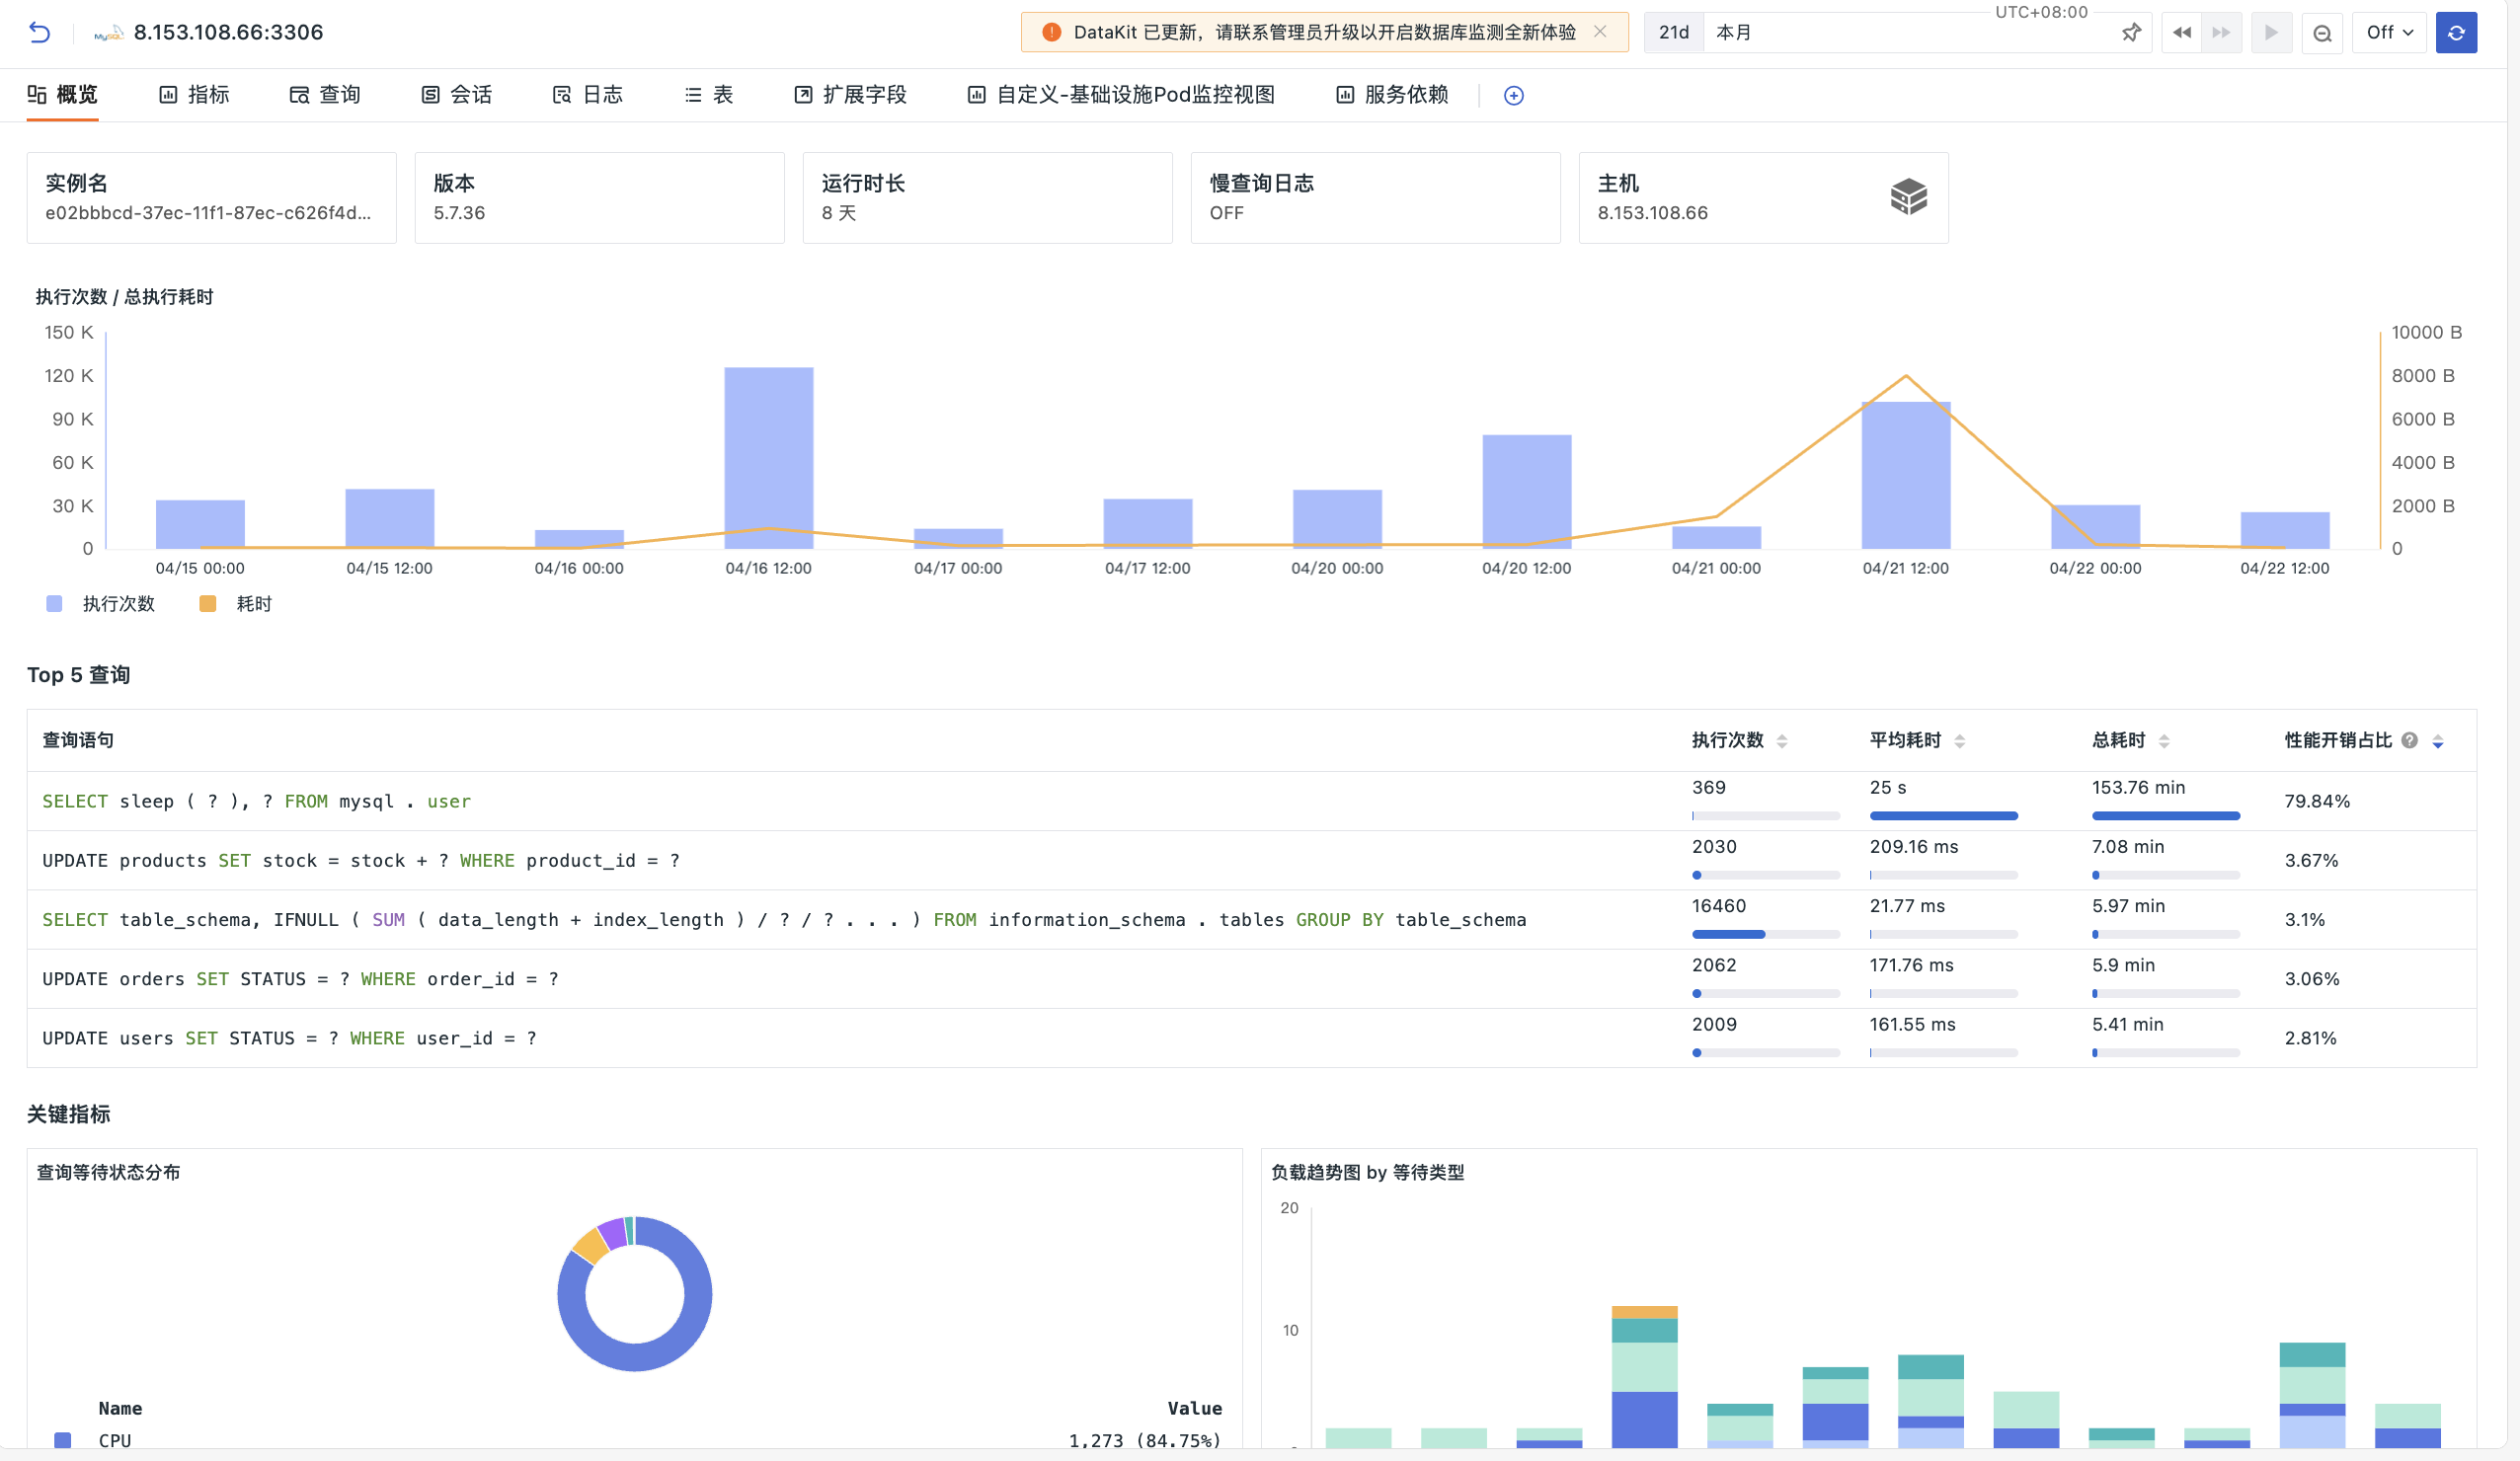
- The key metrics view displays wait status distribution, database load trends, and resource consumption of nodes such as CPU, disk, network, and memory.
- The metrics page allows you to view database performance metrics such as session count, response time, cache hit rate, tablespace usage, and PGA memory.
- The Log, Table, and Extended Field views allow continued viewing of slow query logs, error logs, table field structures, and instance metadata to form a complete chain of evidence for investigation.
Inconsistent Query Optimization Experience? Let Obsy AI take over SQL analysis advice
- Click AI Optimization Suggestions in the Query Details to trigger the Obsy AI side-scrolling panel, which automatically performs optimization analysis on the current statement.
- AI suggestions can combine query statements, performance trends, sampling records, and contextual metrics to help determine whether SQL needs to be rewritten, indexes supplemented, or database objects adjusted.
- R&D, DBA, and SRE can collaborate around a single database evidence chain, reducing the cost of repeated experiential communication.
Inconsistent Query Optimization Experience? Let Obsy AI take over SQL analysis advice

Frequently asked questions

What types of databases does Guance database monitoring support?

The database viewer targets database data collected by DataKit. The documentation covers common database types such as MySQL, SQL Server, PostgreSQL, Oracle, MongoDB, and quickly distinguishes instances in the list using type icons.

Can database monitoring help locate slow queries?

Yes, you can. Guance displays SQL execution count, average time, total time, and performance overhead ratio, and supports drilling down from query lists to query overviews, sampling records, and complete log data, helping to locate slow queries and high-cost SQL.

How can you troubleshoot database lock waiting and blocking issues?

You can enter the session view to view the number of active sessions, distribution of waiting events, number of connections in waiting, number of root blocking sessions, and number of waiting queries, and filter sessions with blocking activity using the "Blocking Only Connections" feature.

Can database monitoring be analyzed together with host resources and logs?

Yes, you can. On the database detail page, you can view core metrics, node CPU/disk/network/memory trends, slow query logs, error logs, table structures, and extension fields, making it suitable for checking databases, hosts, and log evidence in the same context.

What can Obsy AI do in database monitoring?

In the query view, users can summon Obsy AI optimization suggestions from the SQL statement area, allowing AI to perform optimization analysis based on the current query and relevant context, assisting in providing directions for SQL rewriting, indexing, or object adjustments.

Related reading

Want to see how database monitoring applies to your business systems?

Book a demo