


Comparison
Choosing application performance monitoring tools
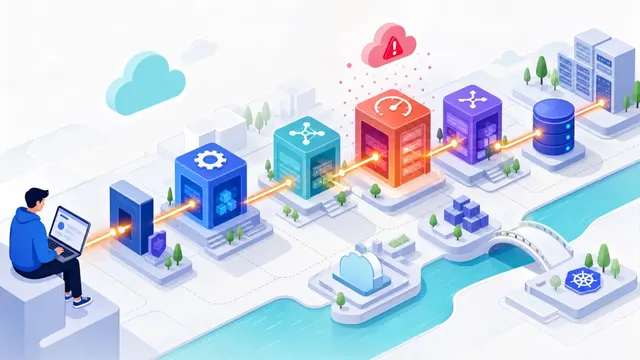
Compare APM tools through instrumentation, sampling, retained spans, log and RUM correlation, and the backend work and billing each route leaves to the team.
Side-by-side product analysis covering setup, workflows, pricing, deployment, and the trade-offs buyers need to verify.
Compare APM tools through instrumentation, sampling, retained spans, log and RUM correlation, and the backend work and billing each route leaves to the team.

Compare AIOps tools through alert correlation, evidence access and execution controls, with Guance, Datadog Bits, Splunk ITSI, BigPanda and PagerDuty.
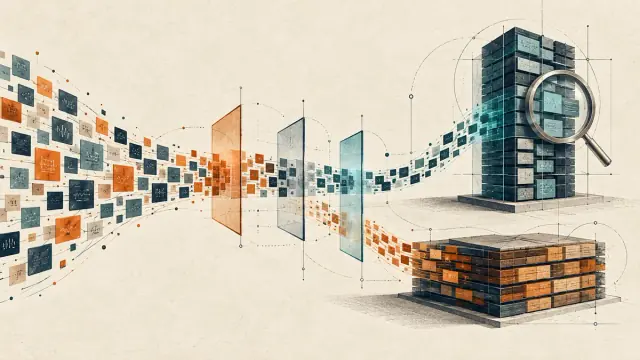
Compare log management tools through search engines, collection, retention and the work of running the platform, with Guance, Elastic, Loki, ClickHouse and cloud logging services.
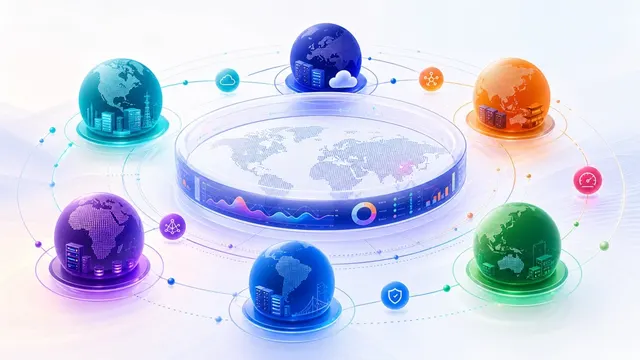
Compare cloud-native monitoring, shared backends and federated queries through resource identity, access, billing and the operational work each option leaves to your team.
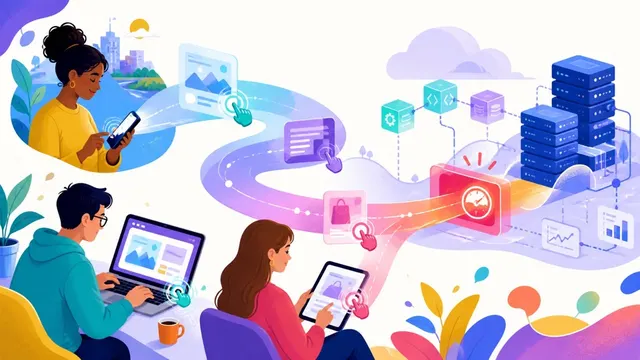
Compare real user monitoring tools through INP statistics, trace propagation, session and replay sampling, privacy and complete costs, including Guance and existing backend workflows.
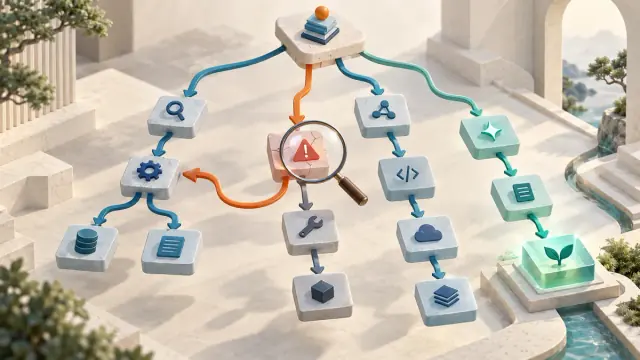
Compare AgentOps and LangSmith for multi-turn debugging, tool outcomes, regression datasets, trace retention, inference costs, and self-hosting operations.
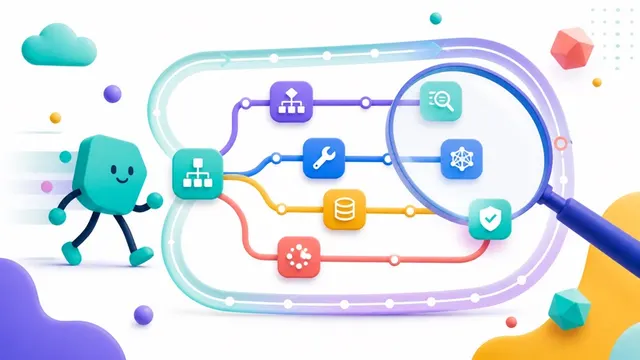
Compare Guance, AI-focused platforms, APM extensions, and self-hosted stacks by session debugging, evaluations, token attribution, data location, and operating cost.

Compare integrated observability, open-source alerting, incident-response SaaS, and cloud-native services by signal coverage, on-call workflows, AI controls, and cost.
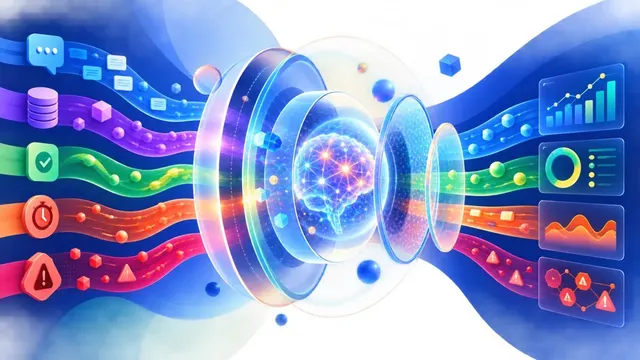
Compare Guance, AI-focused platforms, APM extensions, and gateway-based stacks by trace coverage, output evaluation, billing units, and deployment ownership.
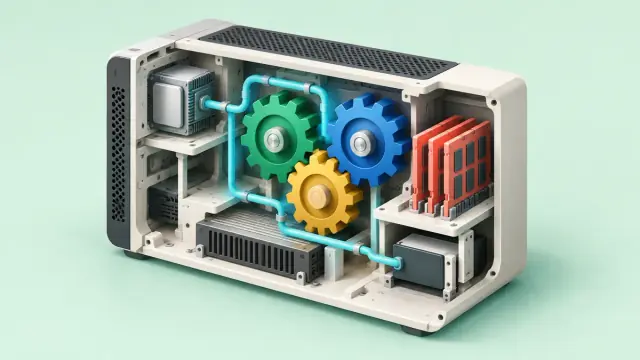
Understand CloudWatch and CloudTrail coverage, 90-day event history, data events, alerting, costs, and current CloudTrail Lake availability.
Compare Datadog and Splunk AppDynamics through a failed checkout: transaction models, snapshots, log correlation, deployment, and pricing.
Compare Datadog and CloudWatch through an investigation workflow, with collection paths, sampling, account governance, and usage-based costs.