

Choosing an APM platform in 2026: tracing, correlation, and operating cost
Compare integrated platforms, commercial APM, self-hosted tracing, and cloud services by trace coverage, connected signals, instrumentation, and full operating cost.
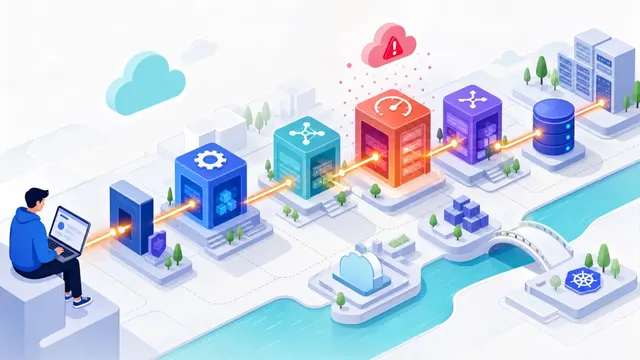
A slow request may spend its time in application code, a downstream dependency, or an overloaded host. An application performance monitoring (APM) platform should help an engineer distinguish those cases. A service map and a list of slow requests are useful starting points, but the decision turns on what the engineer can investigate next.
This guide compares four operating models: an integrated platform such as Guance, commercial APM products such as Datadog, Dynatrace, and New Relic, self-hosted tracing, and cloud-provider monitoring. Evaluate them against the same request paths, instrumentation requirements, and retention policies. A nominal host price or a promise of automatic instrumentation cannot establish the full cost or coverage.
Published by Guance. This is a documentation-based comparison reviewed on October 14, 2026, not a performance benchmark or a customer-cost study.
Overview
| Decision | Integrated platform, including Guance | Commercial APM | Self-hosted tracing | Cloud-provider monitoring |
|---|---|---|---|---|
| Investigation workflow | Configure shared identifiers and related signal views | Evaluate the selected product's trace, log, profile, and user-experience workflows | Integration work depends on the selected stack; capabilities differ substantially | Start with native cloud integrations, then test off-cloud dependencies |
| Instrumentation | Check each supported protocol and feature | Compare OpenTelemetry ingestion with vendor Agent capabilities | Choose compatible SDKs, collectors, and backends | Check supported OpenTelemetry distributions and cloud-specific instrumentation |
| Operations | SaaS shifts backend operation to the provider; private deployment needs an operating owner | Responsibility depends on the deployment and contract | Team owns capacity, upgrades, storage, and recovery | Provider operates managed components; team owns configuration and access |
| Cost | Quote the actual plan, signals, retention, processing, and compute | Model each product's separate meters and commitments | Include infrastructure, support, and engineering effort | Include telemetry, query, retention, and associated cloud-service charges |
Separate tracing from the rest of APM
Distributed tracing records instrumented operations as spans and connects them into request paths. A trace is complete only to the extent that instrumentation, context propagation, sampling, and delivery preserve those operations. It does not automatically include every service a request touched.
APM adds service-level analysis such as request rate, errors, latency, and dependency views. Broader observability connects that application view to logs, infrastructure metrics, and real user monitoring (RUM). These are related capabilities, not interchangeable definitions. A team can operate tracing independently, but it should account for the effort of connecting it to other diagnostic tools.
During evaluation, follow a slow trace to the relevant log events and host or container metrics. If browser experience matters, include a user session and its backend request. Confirm that the linked records describe the same operation and time window. An interface that opens another page is useful only when the right data is there.
An integrated platform: Guance
Guance offers application tracing alongside other telemetry. DataKit's OpenTelemetry integration provides a documented ingestion route, allowing teams to evaluate a backend without first replacing all application instrumentation. Compatibility still needs to be checked for the actual SDK, protocol, attributes, and required features. Guance OpenTelemetry integration
DataKit also documents separate SkyWalking, Jaeger, and Zipkin collection paths. These can help preserve existing instrumentation, but verify the supported wire protocol and version. Receiving spans does not migrate saved queries, sampling policies, or every feature of the original backend.
Trace details provide related investigation views. Shared trace identifiers, service attributes, collected infrastructure data, and compatible retention make those views useful. A missing or expired trace cannot be reconstructed from a log's trace_id. Similarly, RUM-to-trace navigation requires the relevant browser and backend instrumentation. Guance trace details
Evaluate service topology, resource timing, errors, and any profiling views against the languages and runtimes actually deployed. Treat AI-assisted analysis as a separate acceptance item: confirm the delivered feature, permissions, supplied context, and whether suggestions are supported by the underlying records. Do not equate an explanation with a verified cause.
Guance is a candidate for teams seeking a shared investigation workflow across applications and infrastructure. For data-location requirements, evaluate the selected SaaS site or private deployment. Obtain a plan-specific quote: the Enterprise Plan documentation distinguishes ingestion, processing, storage, tasks, and optional compute rather than reducing the entire service to one span price. Enterprise Plan billing
Commercial APM: Datadog, Dynatrace, and New Relic
Evaluate these as individual products. Their feature packages, instrumentation options, and billing structures are not identical. A feature demonstrated with a vendor Agent may not behave identically with an OpenTelemetry-only path. Compare the exact requirements for profiling, service discovery, application security, and trace retention.
The price comparison needs the same care. Datadog publishes distinct APM offerings and related products. Dynatrace publishes usage units across its platform capabilities. New Relic offers pricing options whose data and user or compute components depend on the selected arrangement. Use the current Datadog, Dynatrace, and New Relic rate information to build a quote for one workload, including commitments and overages.
For elastic Kubernetes workloads, identify exactly what is counted and when: a host, container, unit of memory, amount ingested, retained span, or user entitlement can produce different growth curves. Include logs and RUM only where those features are required, and include them consistently across candidates.
These products deserve attention when their documented integrations and investigation workflows match the application estate and the operating budget. For China-based workloads, validate service availability, processing locations, contractual terms, and the organization's data requirements. Vendor nationality alone does not establish either compliance or incompatibility.
Self-hosted tracing: Jaeger, SkyWalking, or Tempo
Self-hosting provides control over backend configuration and deployment, with an obligation to run it. The products also differ in scope. SkyWalking describes an APM system with multiple observability capabilities; it should not be treated as a trace database with every other feature missing. Tempo is a tracing backend commonly used with Grafana and other signals. SkyWalking architecture and Tempo introduction
Choose storage according to the tracing backend. Thanos and Cortex are metrics systems, not general-purpose long-term storage for Jaeger or Tempo traces. Separately plan the metrics, logs, alert evaluation, and visualization components your workload needs. Some capabilities are already supplied by the chosen platform; others require configuration or integration.
An open-source license can remove a software subscription without removing compute, retained data, backup, support, upgrade, or on-call work. Estimate those costs from the proposed deployment and the team's capacity. A mature platform team can have a very different incremental cost from an application team starting a new backend project.
This route fits teams that need control and can own recovery as well as installation. A successful small deployment is not evidence that its query capacity or operational staffing will support the production workload.
Cloud-provider APM
Alibaba Cloud application monitoring, AWS X-Ray and CloudWatch, and Azure Application Insights can be attractive when the application already relies heavily on that provider. The existing identity, resource inventory, and operations model can reduce setup work.
However, neither proprietary-only collection nor inevitable cross-cloud trace breaks should be assumed. Azure documents an OpenTelemetry distribution, while AWS documents X-Ray integration with CloudWatch. Verify how the chosen service receives telemetry and connects it to the resources you use. Azure OpenTelemetry setup and CloudWatch integration with X-Ray
Include an off-cloud dependency in the trial if one exists. Check propagation, identity, network access, data transfer charges, and whether responders must use several consoles. A cloud-native option fits when those boundaries are acceptable; a mixed estate may justify a shared backend or a deliberate integration between systems.
Run a trial that reveals missing coverage
Use a real service chain with one normal request, one slow dependency, one failure, and an asynchronous operation. First export through the intended OpenTelemetry or vendor path. Check which spans, attributes, and higher-level features arrive.
Next, investigate the failure from the trace. Record the steps required to reach related logs, infrastructure measurements, and user experience data. Measure actual setup effort, including collector deployment, permissions, propagation fixes, sampling, dashboards, and alert changes.
Finally, model three years of cost using observed span volume and peak load. Include retention, related signals, expected growth, support, and migration overlap. Keep one-time work separate from recurring expenses. Review data placement and access requirements with the people responsible for that decision.
Choose the integrated or commercial route when it reduces investigation and backend work enough to justify the fee. Choose self-hosting when control and an established operating capability outweigh that benefit. Choose a cloud-provider service when its integration boundary matches the business. Preserve an existing tracing system if the new workflow does not repay the migration.
Common questions
Is it worth moving from SkyWalking or Jaeger?
Start with the missing workflow. If responders already have the required context, a backend change may offer little. If correlation is a recurring problem, test compatible ingestion before replacing instrumentation. Saved queries, alerts, sampling, retention, and operational processes still need migration.
Can OpenTelemetry replace every vendor Agent?
It can provide portable telemetry for supported signals and libraries. It does not promise identical profiling, security, discovery, or vendor-specific analysis. Compare required features using the actual OpenTelemetry ingestion path.
Should APM and the rest of observability be purchased together?
Shared tooling can reduce integration work, but separate tools can be a deliberate choice. Evaluate the complete investigation, including identifiers, links, access control, and retention. Procurement structure alone does not determine whether the signals can be correlated.
Does eBPF remove the need for code instrumentation?
Kernel- and runtime-level observation can expand coverage, depending on the implementation. Business-specific operations and custom attributes may still need SDK instrumentation. Test supported kernels, runtimes, and trace propagation rather than assuming that “zero-code” means complete application semantics.
How should real cost be estimated?
Start with request volume, spans per request, sampling, retention, and the other signals required during incidents. Convert those quantities into each plan's meters. Add collection resources, backend operation where applicable, and migration effort. A lower rate on one meter does not establish a lower total cost.
Contact us
Join the community

to join the community
Try Guance
Start online and pay only for what you use.
Get startedChoose a Guance plan