Contact us

Join the community

Scan with WeChat
Join the official community group

Try Guance

Start online with usage-based pricing and a true cloud service.

Get started

Choose a Guance edition

Code repositories

Mobile RUM

App performance monitoring and mobile RUM

Guance App performance monitoring covers iOS, Android, mini-programs, and cross-platform frameworks, continuously analyzing app launches, page lag, crashes, resource requests, access paths, and session playbacks to help mobile R&D, SREs, and product teams identify the impact of on-device experience issues on retention and conversion.

App performance monitoring and mobile RUM
Book a demo

What problems does mobile RUM solve?

From app launches, lag, and crashes to user paths, we can clearly see the mobile experience issues

Mobile experience issues usually occur on specific devices, system versions, network environments, or after a specific release. Guance mobile RUM places startup time, page performance, crashes, stuttering, resource requests, access paths, and session playback into the same context, helping teams assess impact scope, reproduce scenes, and quickly pinpoint responsibility boundaries.

Apps, mini programs, and cross-platform frameworks all need to be unified in terms of real user experience
Guance mobile RUM supports iOS, Android, React Native, Flutter, Mini Programs, UniApp, macOS, tvOS, Unity, and more. Whether your team uses native apps or multi-platform integrated development, you can collect startup, page, resources, errors, and access experience data in a unified way.
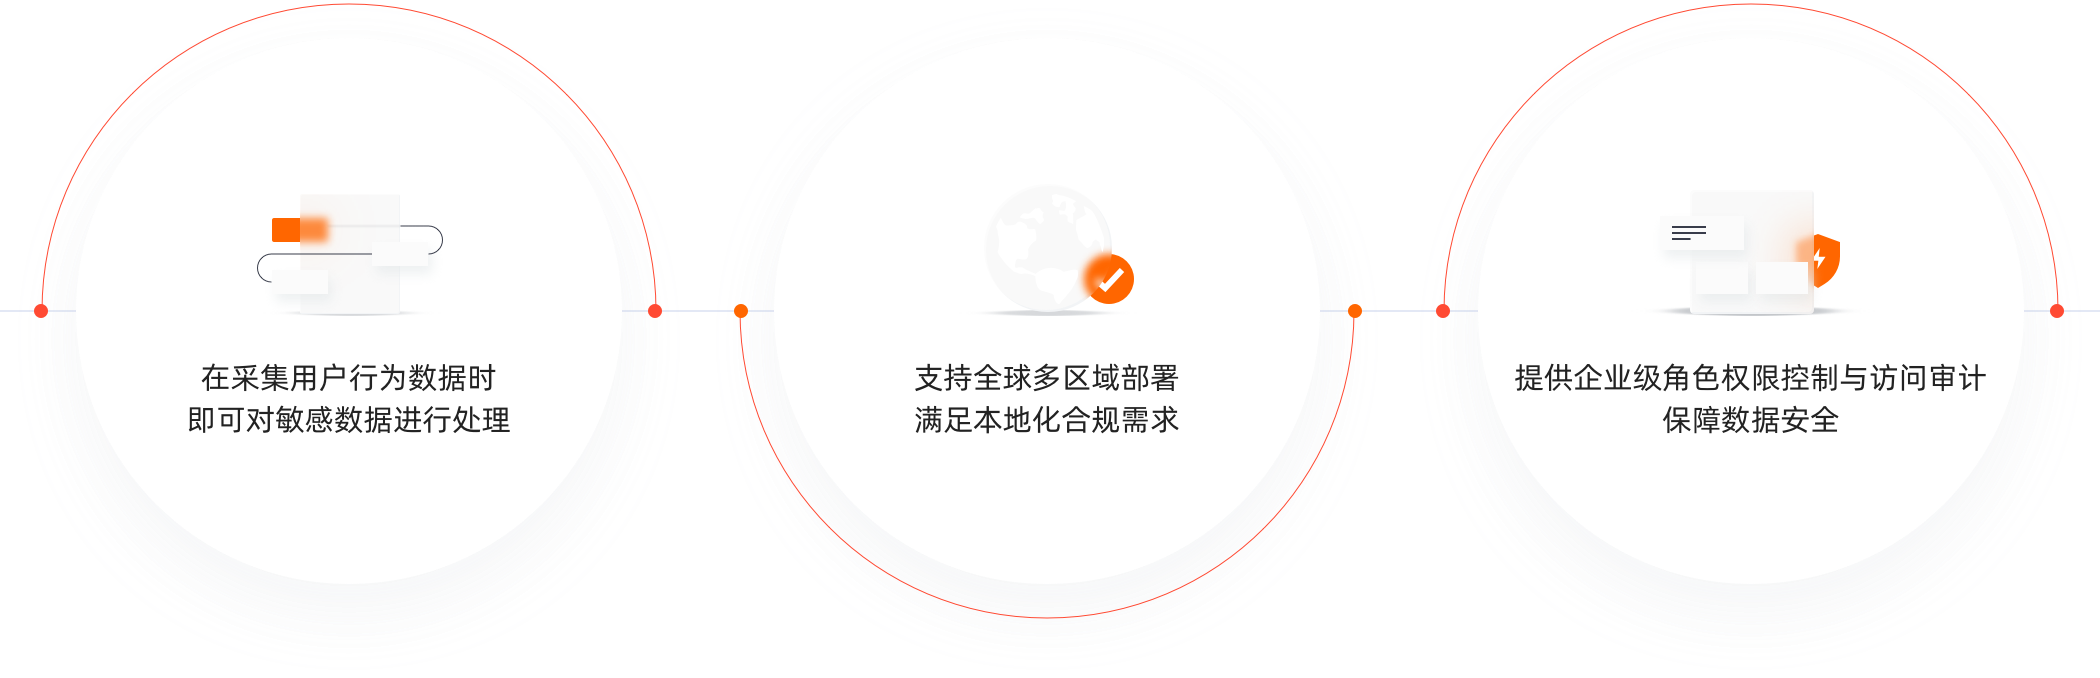
The collection process supports fine-grained control and privacy protection, configurable sampling, field ansensitization, sensitive input masking, and collection scope, meeting the shared needs of mobile experience analysis and data compliance.
Apps, mini programs, and cross-platform frameworks all need to be unified in terms of real user experience
If users say the app is stuck, crashes, or won't open, first locate the device, version, and page
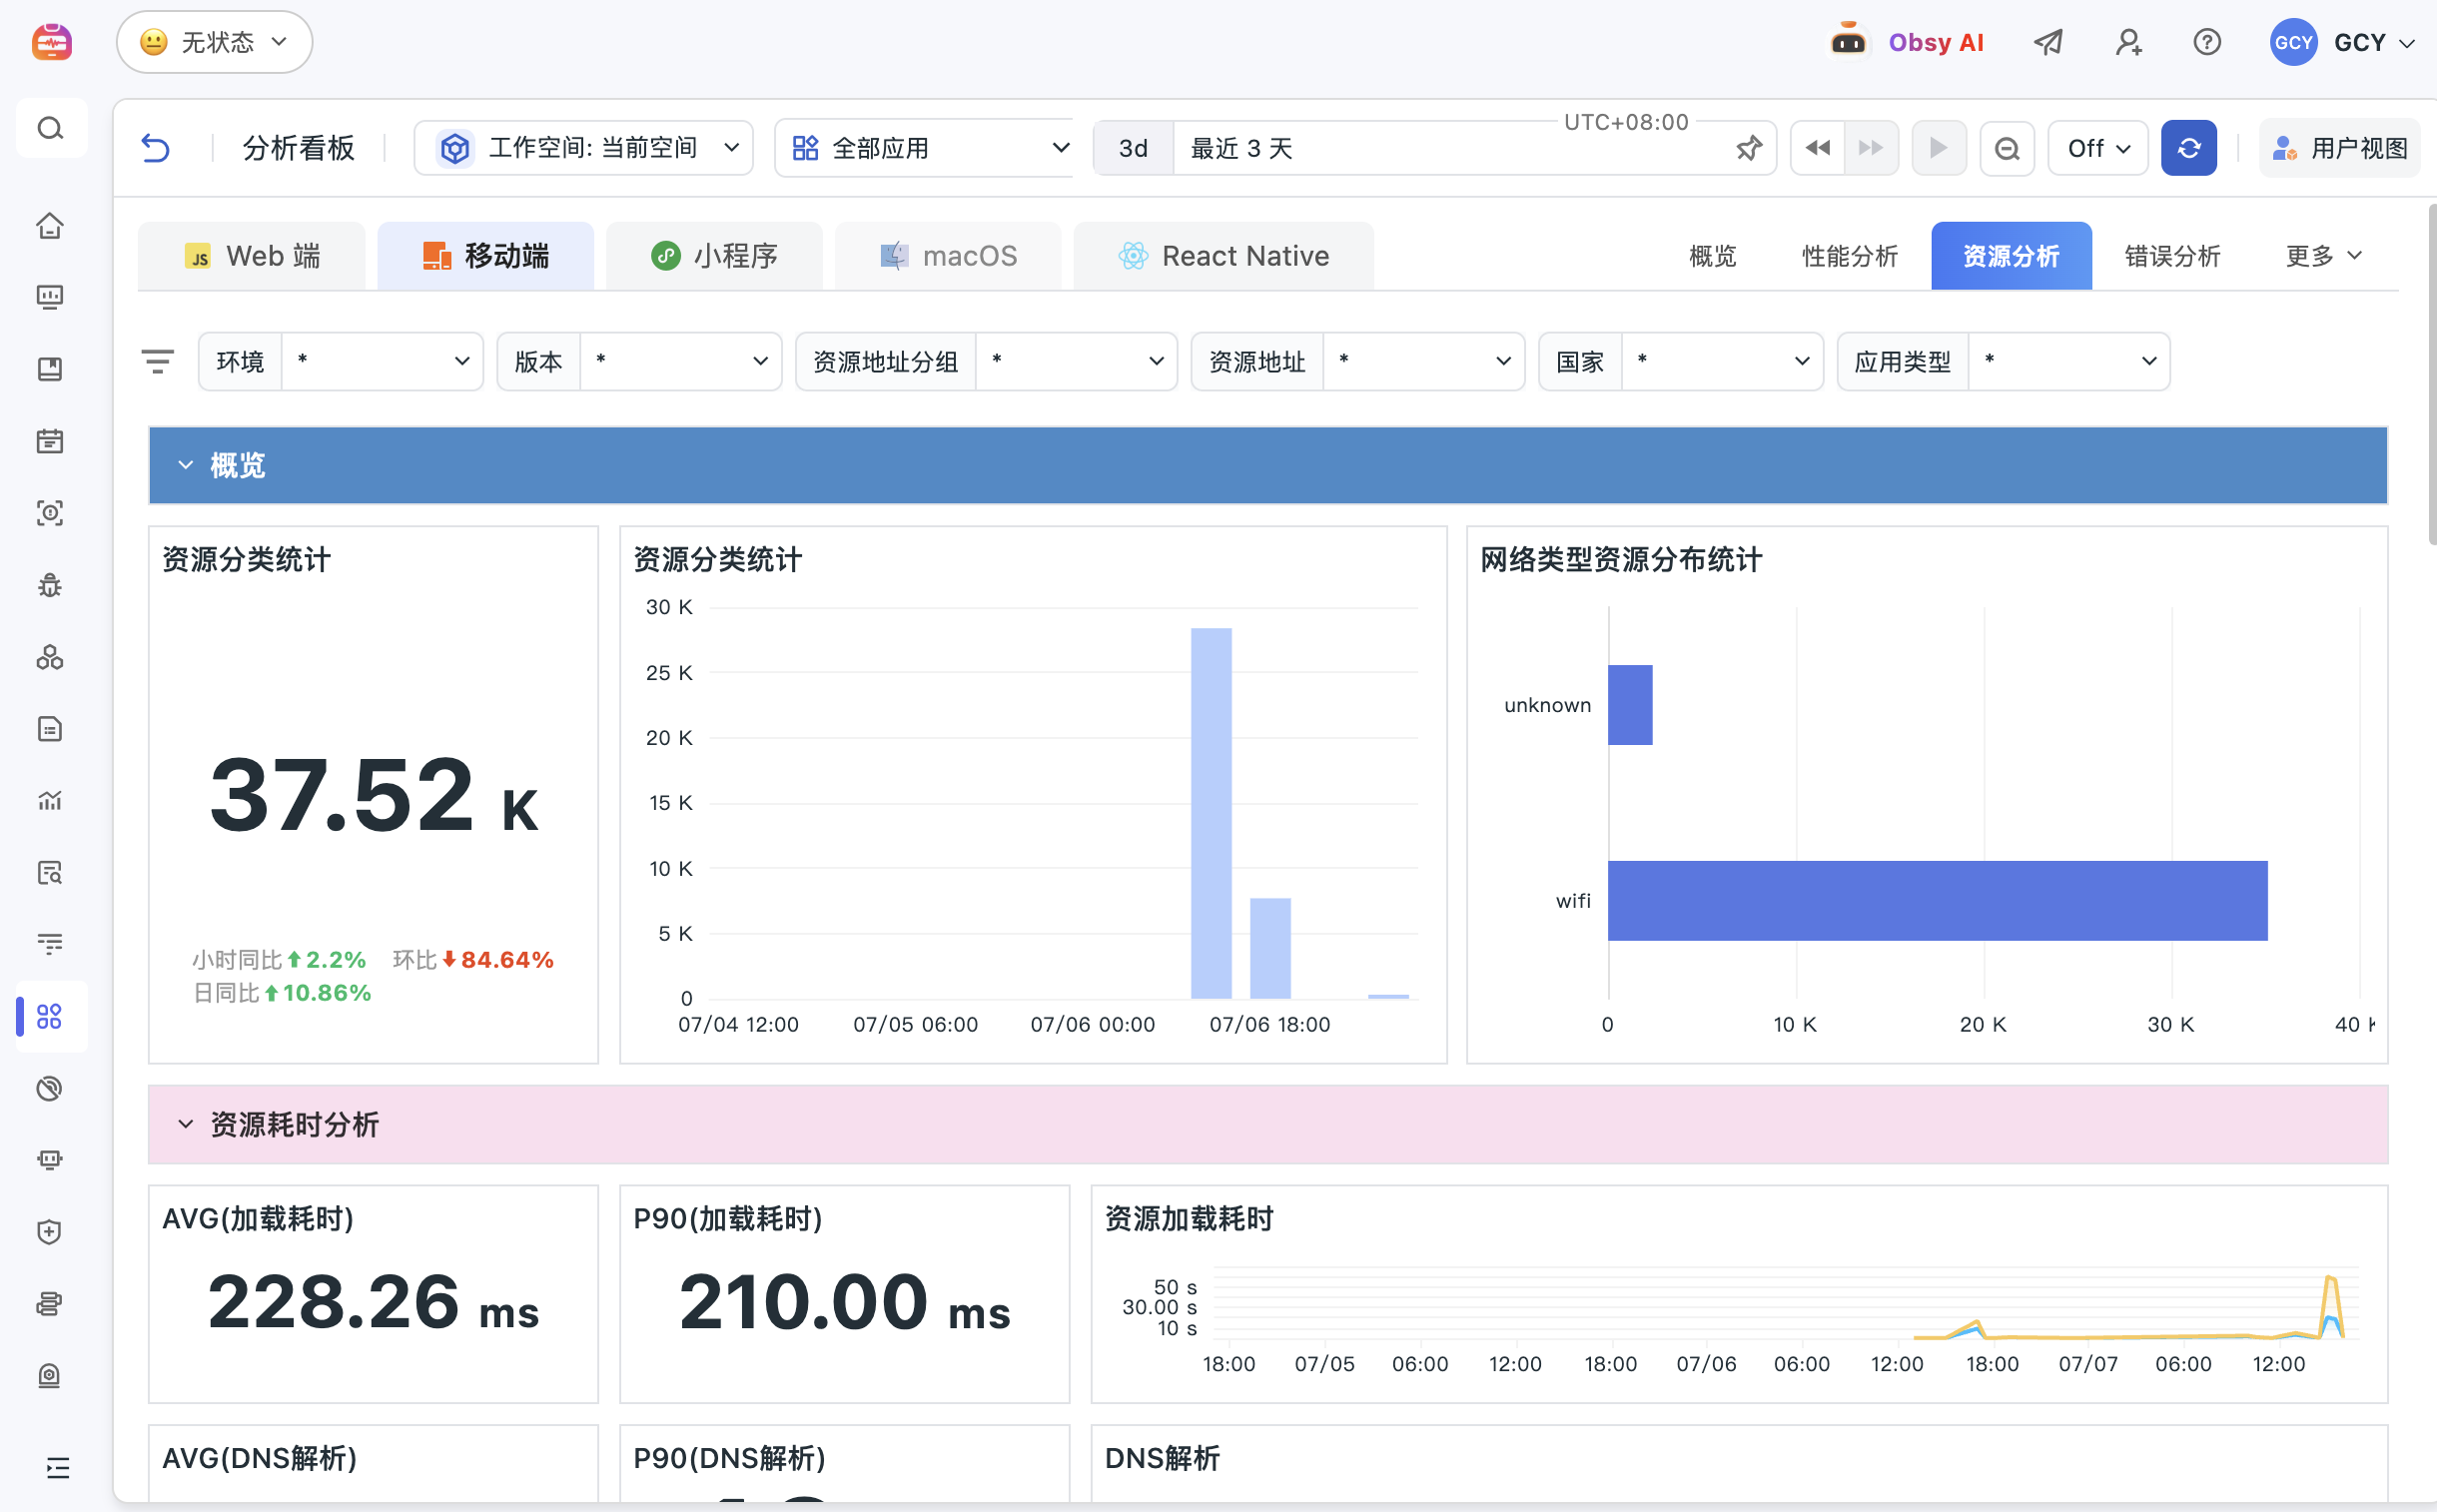
Mobile RUM automatically captures cold start, hot start, page loading, main thread stuttering, crashes, ANR, and resource request anomalies, aggregating common issues by device, system version, app version, region, and page aggregation. The team can first identify the user groups affected, then pinpoint which page, version, or operation path the anomaly is on.
What did users do before the crash? Recreate the scene using mobile session playback
Mobile Session Replay records the operation paths before and after clicks, swipes, page switches, app front-back and back-end switches, and exceptions. Mobile R&D does not rely solely on user descriptions and log fragments; it can directly restore the problem scene and determine root causes by combining device information, error stacks, and network requests.
What did users do before the crash? Recreate the scene using mobile session playback
When mobile users see slow requests, the backend Trace and Log must also be able to connect
Mobile RUM can be linked with APM Trace, logs, and infrastructure metrics. Teams can jump from a single user click or resource request to the backend service chain, interface time, error logs, and resource status, determining whether the experience issue comes from on-end rendering, network requests, service dependencies, or backend exceptions.
Performance metrics must be linked to business actions to determine whether they affect retention and conversion
Mobile RUM supports custom user IDs, versions, channels, and business events, such as key actions like login, payment, sharing, submission, and order placement. Teams can link crash rates, startup times, resource failures, and interface time to business paths to determine whether experience issues are affecting retention, payment success rates, or critical conversions.
Performance metrics must be linked to business actions to determine whether they affect retention and conversion

Frequently asked questions

What is App Performance Monitoring?

App performance monitoring is used to collect real-world experience data from apps, mini-programs, or cross-platform applications, including startup, page, resource requests, crashes, lag, errors, access paths, and device environments, helping teams identify on-device experience issues.

Which platforms can mobile RUM monitor?

Guance mobile RUM can cover iOS, Android, Mini Programs, React Native, Flutter, UniApp, Unity, and various other mobile and cross-platform development environments.

How do mobile RUM locations crashes and lag?

Teams can analyze crashes, lag, ANR, and resource anomalies by app version, device model, system version, page, region, and user dimensions, and combine session replay, error stack, network requests, and backend traces to reproduce the scene.

Can mobile RUM analyze business conversions?

Yes, you can. Teams can report custom business events such as login, payment, ordering, and sharing, and link these events to startup times, interface errors, page lag, and crash data to determine whether experience issues affect retention and conversion.

Reliable, secure, and compliant

Visit the Trust Center
Guance stable, reliable, and secure compliance capabilities

Related reading

Customer Case: A Detailed Record of Troubleshooting in the Ordering Mini Program of a Well-Known Chain Coffee Brand

Customer Case: A Detailed Record of Troubleshooting in the Ordering Mini Program of a Well-Known Chain Coffee Brand

By achieving observability, improving service quality, and driving business growth!

Customer stories Retail
Use Guance RUM to analyze a VIP visit journey

Use Guance RUM to analyze a VIP visit journey

Currently, every company has its own website, mini program, app, and OA system. After front-end development completes a website or mini program, it is published on the public network for user use. As platforms become more commercialized, each platform has paid customers (for example, a certain video platform, where you have to subscribe to a membership to access certain resources). So, how can you retain these paying VIP customers and continue using the platform?

Best practices
Best practices for monitoring observability in mall mini program projects

Best practices for monitoring observability in mall mini program projects

WeChat Mini Programs are lightweight applications that users can use directly within WeChat without downloading or installing them. It has an independent development framework and ecosystem, supporting rich features and interactions, including social, shopping, services, and more. Guance monitoring of WeChat Mini Programs can collect performance metrics, error logs, and resource request data in real time, using visual analysis to enhance user experience, optimize performance, quickly identify issues, and increase development efficiency.

Best practices
Guance Session Replay: Reconstructs the experience issues encountered during the visit

Guance Session Replay: Reconstructs the experience issues encountered during the visit

Session resets under compliant desensitization configuration to restore page states and key interactions, linking frontend errors, resource requests, and interface time consumption, helping teams reproduce process blockages and experience anomalies.

Product capabilities

Want to see how App Performance Monitoring is being implemented in your business system?

Book a demo