






Phone:400-882-3320
Inspect the complete instrumented request path
Use Trace and Span hierarchy: See the temporal relationship among model, retrieval, tool, API, and application operations.

Incident Management

Platform
Dedicated compute
Dedicated compute keeps concurrent queries stable and complex analysis fast.
Learn moreDedicated compute
Dedicated compute keeps concurrent queries stable and complex analysis fast.
Learn more
Scan to follow
Guance WeChat

Scan to add
Guance assistant
What LLM observability should answer
A useful LLM trace preserves the model, input and output, token use, duration, status, retrieval and tool steps, and downstream service context that were actually instrumented. Operational telemetry does not by itself prove response quality or factual accuracy.
Guance LLM Explorer organises documented LLM Trace and Span data so teams can search and inspect model calls and their execution path. Available fields, providers, frameworks, scores, and correlation depend on the selected instrumentation and current integration documentation.
One response contains many steps: Retrieval, tools, model calls, APIs, and application code can each introduce latency or failure.
Token use lacks context: A total does not explain which model, prompt path, tool, tenant, or release generated the usage.
Unexpected output is difficult to reproduce: Model behaviour depends on input, context, parameters, retrieval results, tools, and versioned application logic.
Prompt data may be sensitive: Inputs, outputs, user attributes, and retrieved content require minimisation, masking, access, and retention decisions.
Instrument documented LLM operations: Capture supported Trace and Span fields for model, retrieval, tool, and application steps.
Analyse performance and usage in context: Compare duration, status, token consumption, models, routes, releases, and workflow steps.
Continue into application evidence: Use shared trace and service context to inspect downstream APIs, logs, databases, and infrastructure where configured.
Govern captured content: Define whether inputs and outputs are collected, masked, sampled, retained, and visible to each role.
Use Trace and Span hierarchy: See the temporal relationship among model, retrieval, tool, API, and application operations.
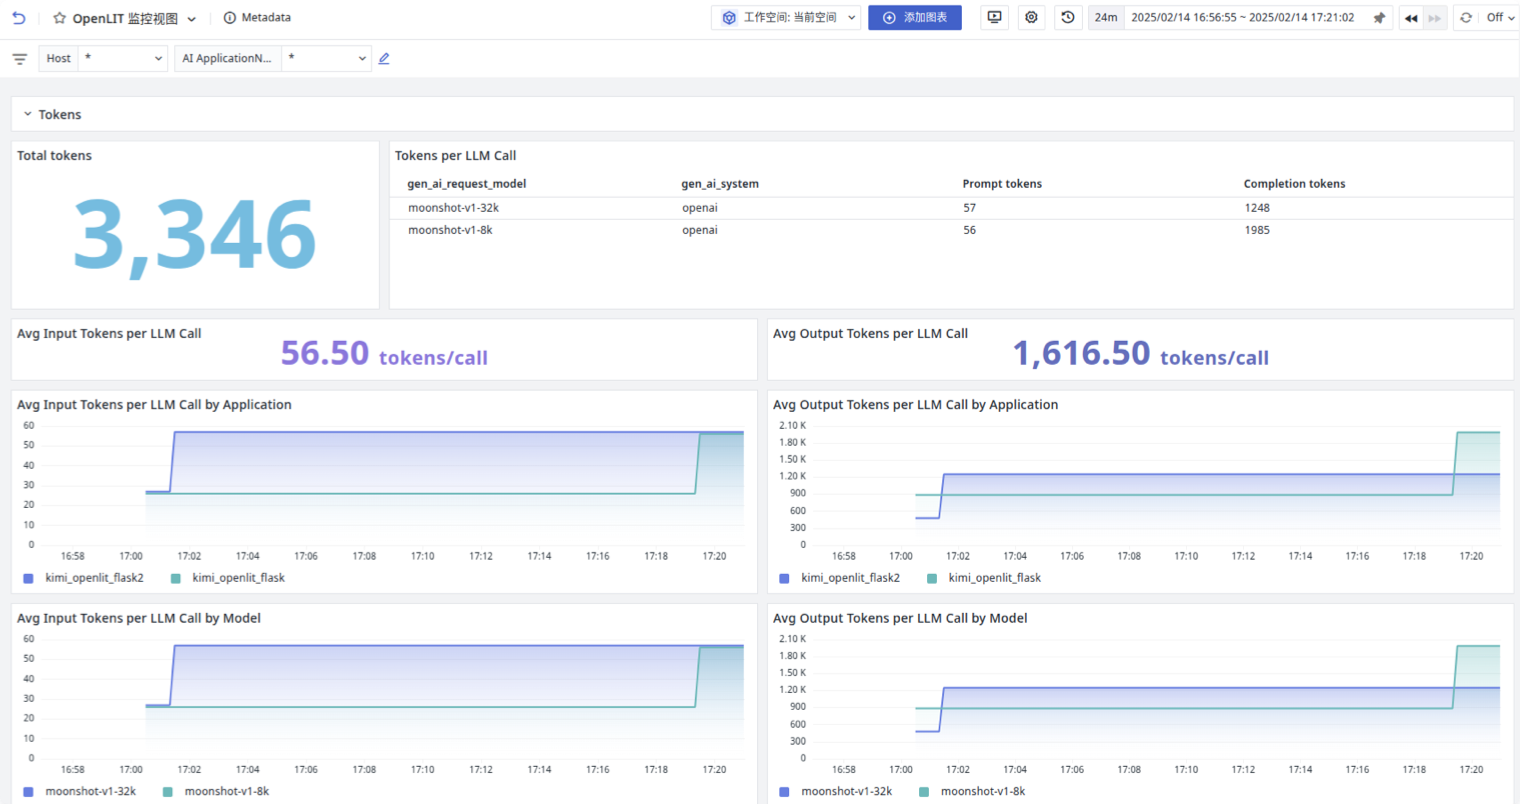
Compare like with like: Segment by model, operation, release, status, route, and workflow before drawing a conclusion.
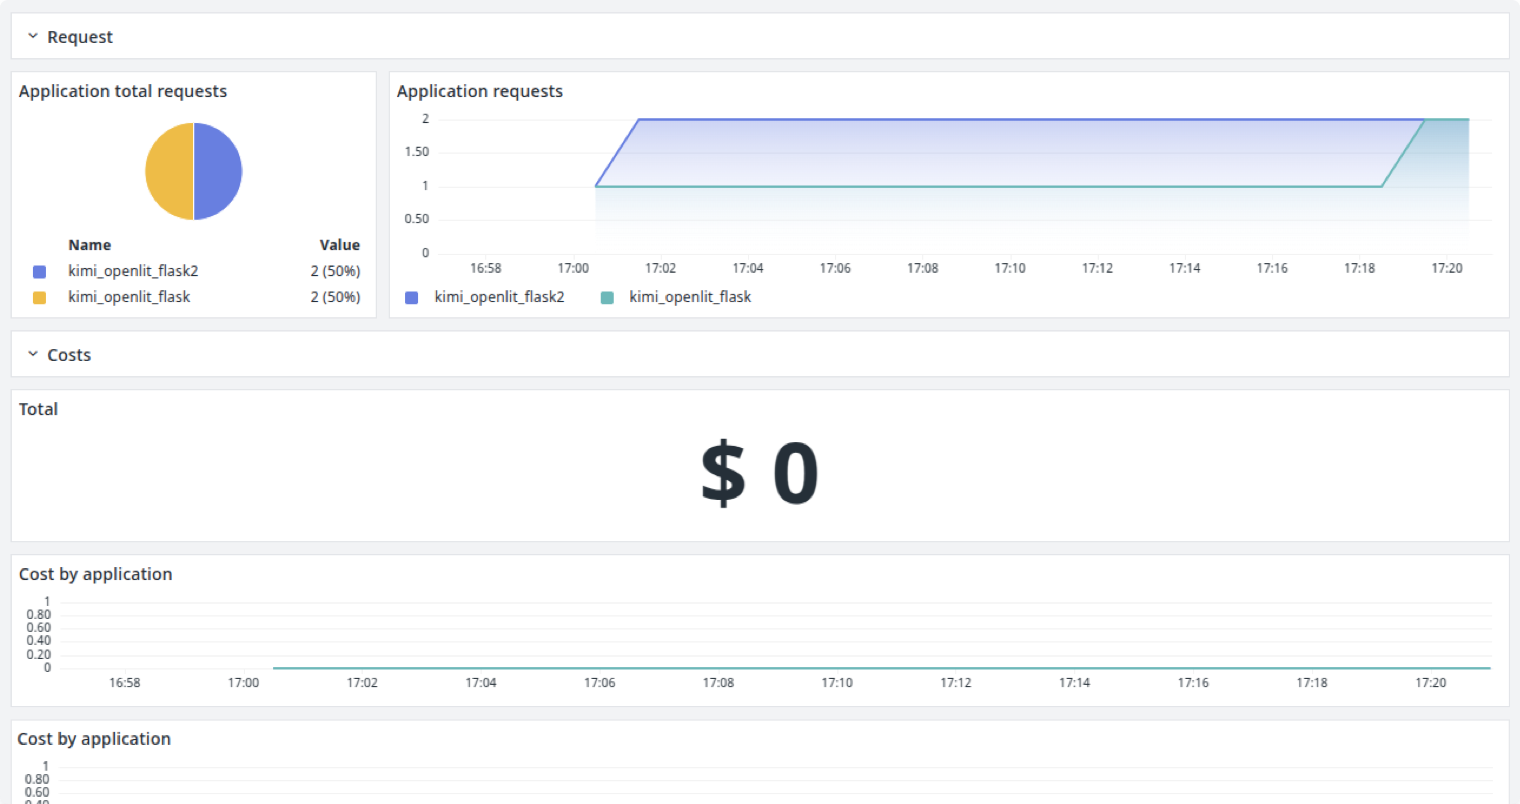
Keep trace context: Continue from an LLM operation into supported service, log, dependency, and runtime evidence.
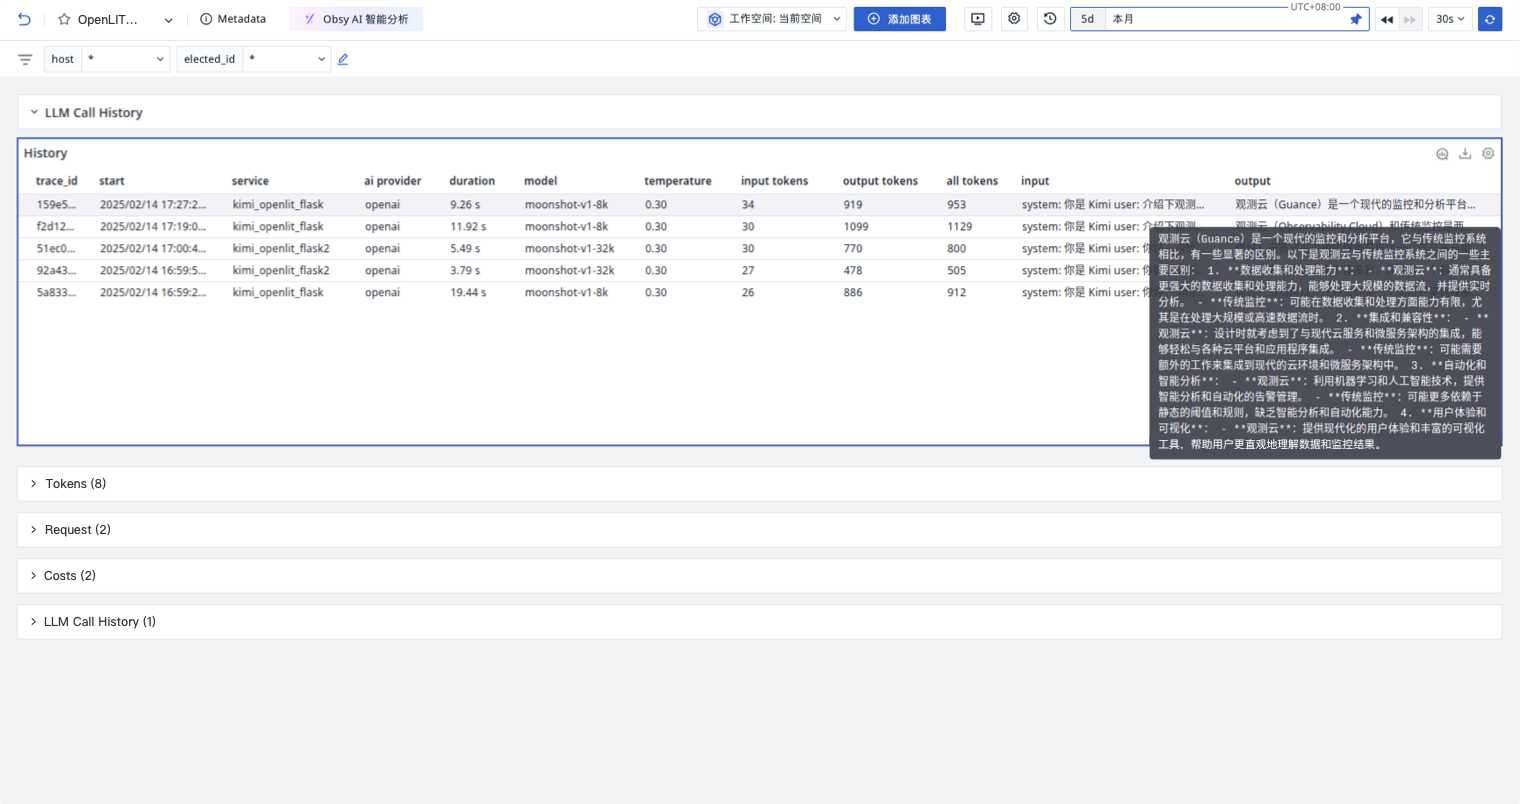
Collect deliberately: Minimise sensitive content, configure masking and access, and set retention according to policy.
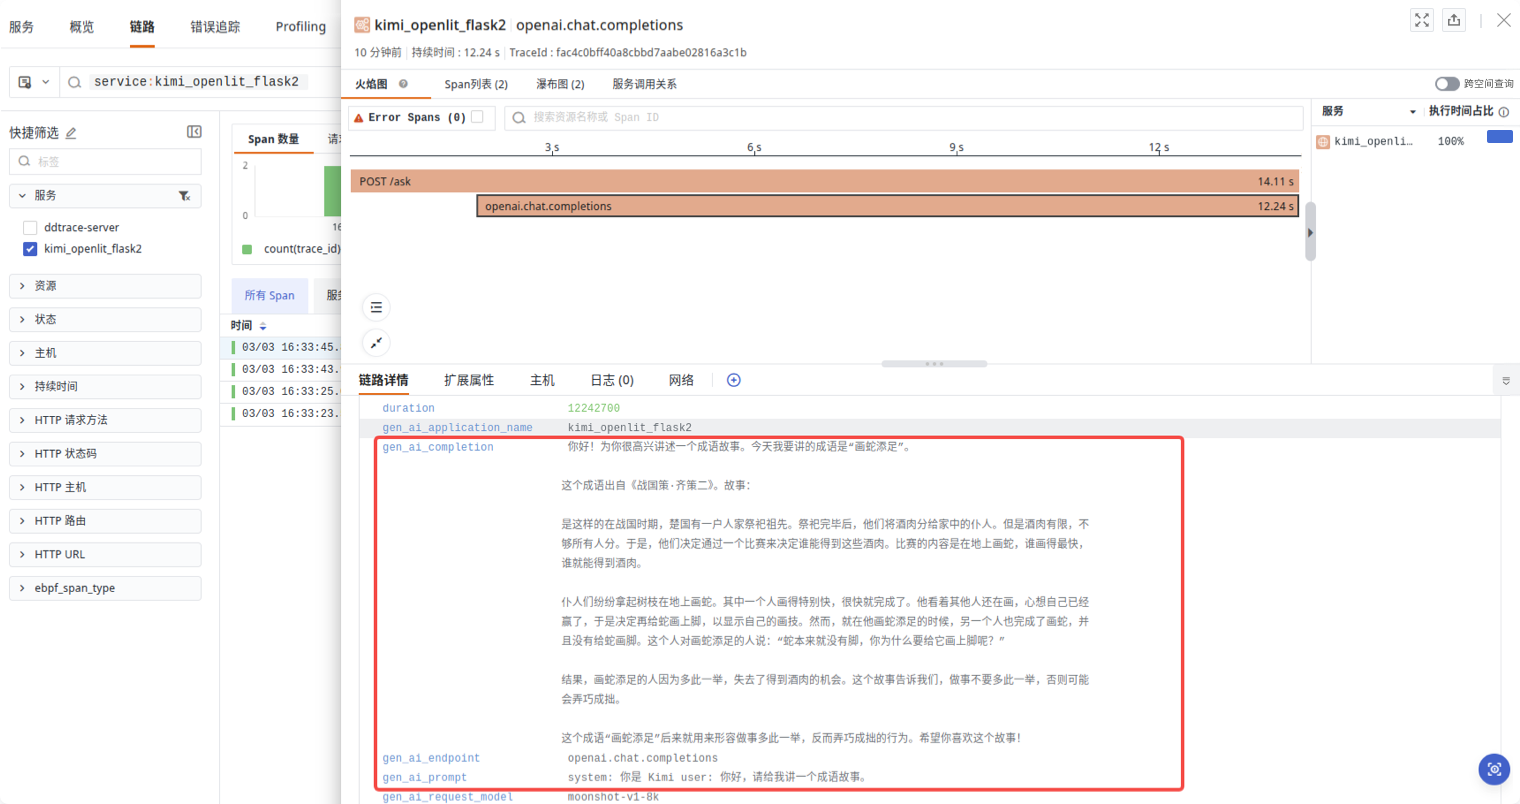
The current documentation describes LLM Trace and Span views with input, output, model, token consumption, duration, status, execution hierarchy, metrics, and scores where those fields are instrumented and reported.
Start with duration or status, inspect the Trace tree, and compare model calls, retrieval, tools, APIs, and downstream service evidence. The available path depends on configured instrumentation.
Operational telemetry can carry configured scores and evaluation results, but it does not automatically establish factual accuracy or business quality. Define evaluation criteria, datasets, review, and ownership separately.
Collect only what the investigation requires, mask or omit sensitive content, restrict access, define retention, and verify the controls available for the selected deployment and instrumentation.
