Contact us

Join the community

Scan with WeChat
Join the official community group

Try Guance

Start online with usage-based pricing and a true cloud service.

Get started

Choose a Guance edition

Code repositories

Dashboards / Data Visualization

Data insights

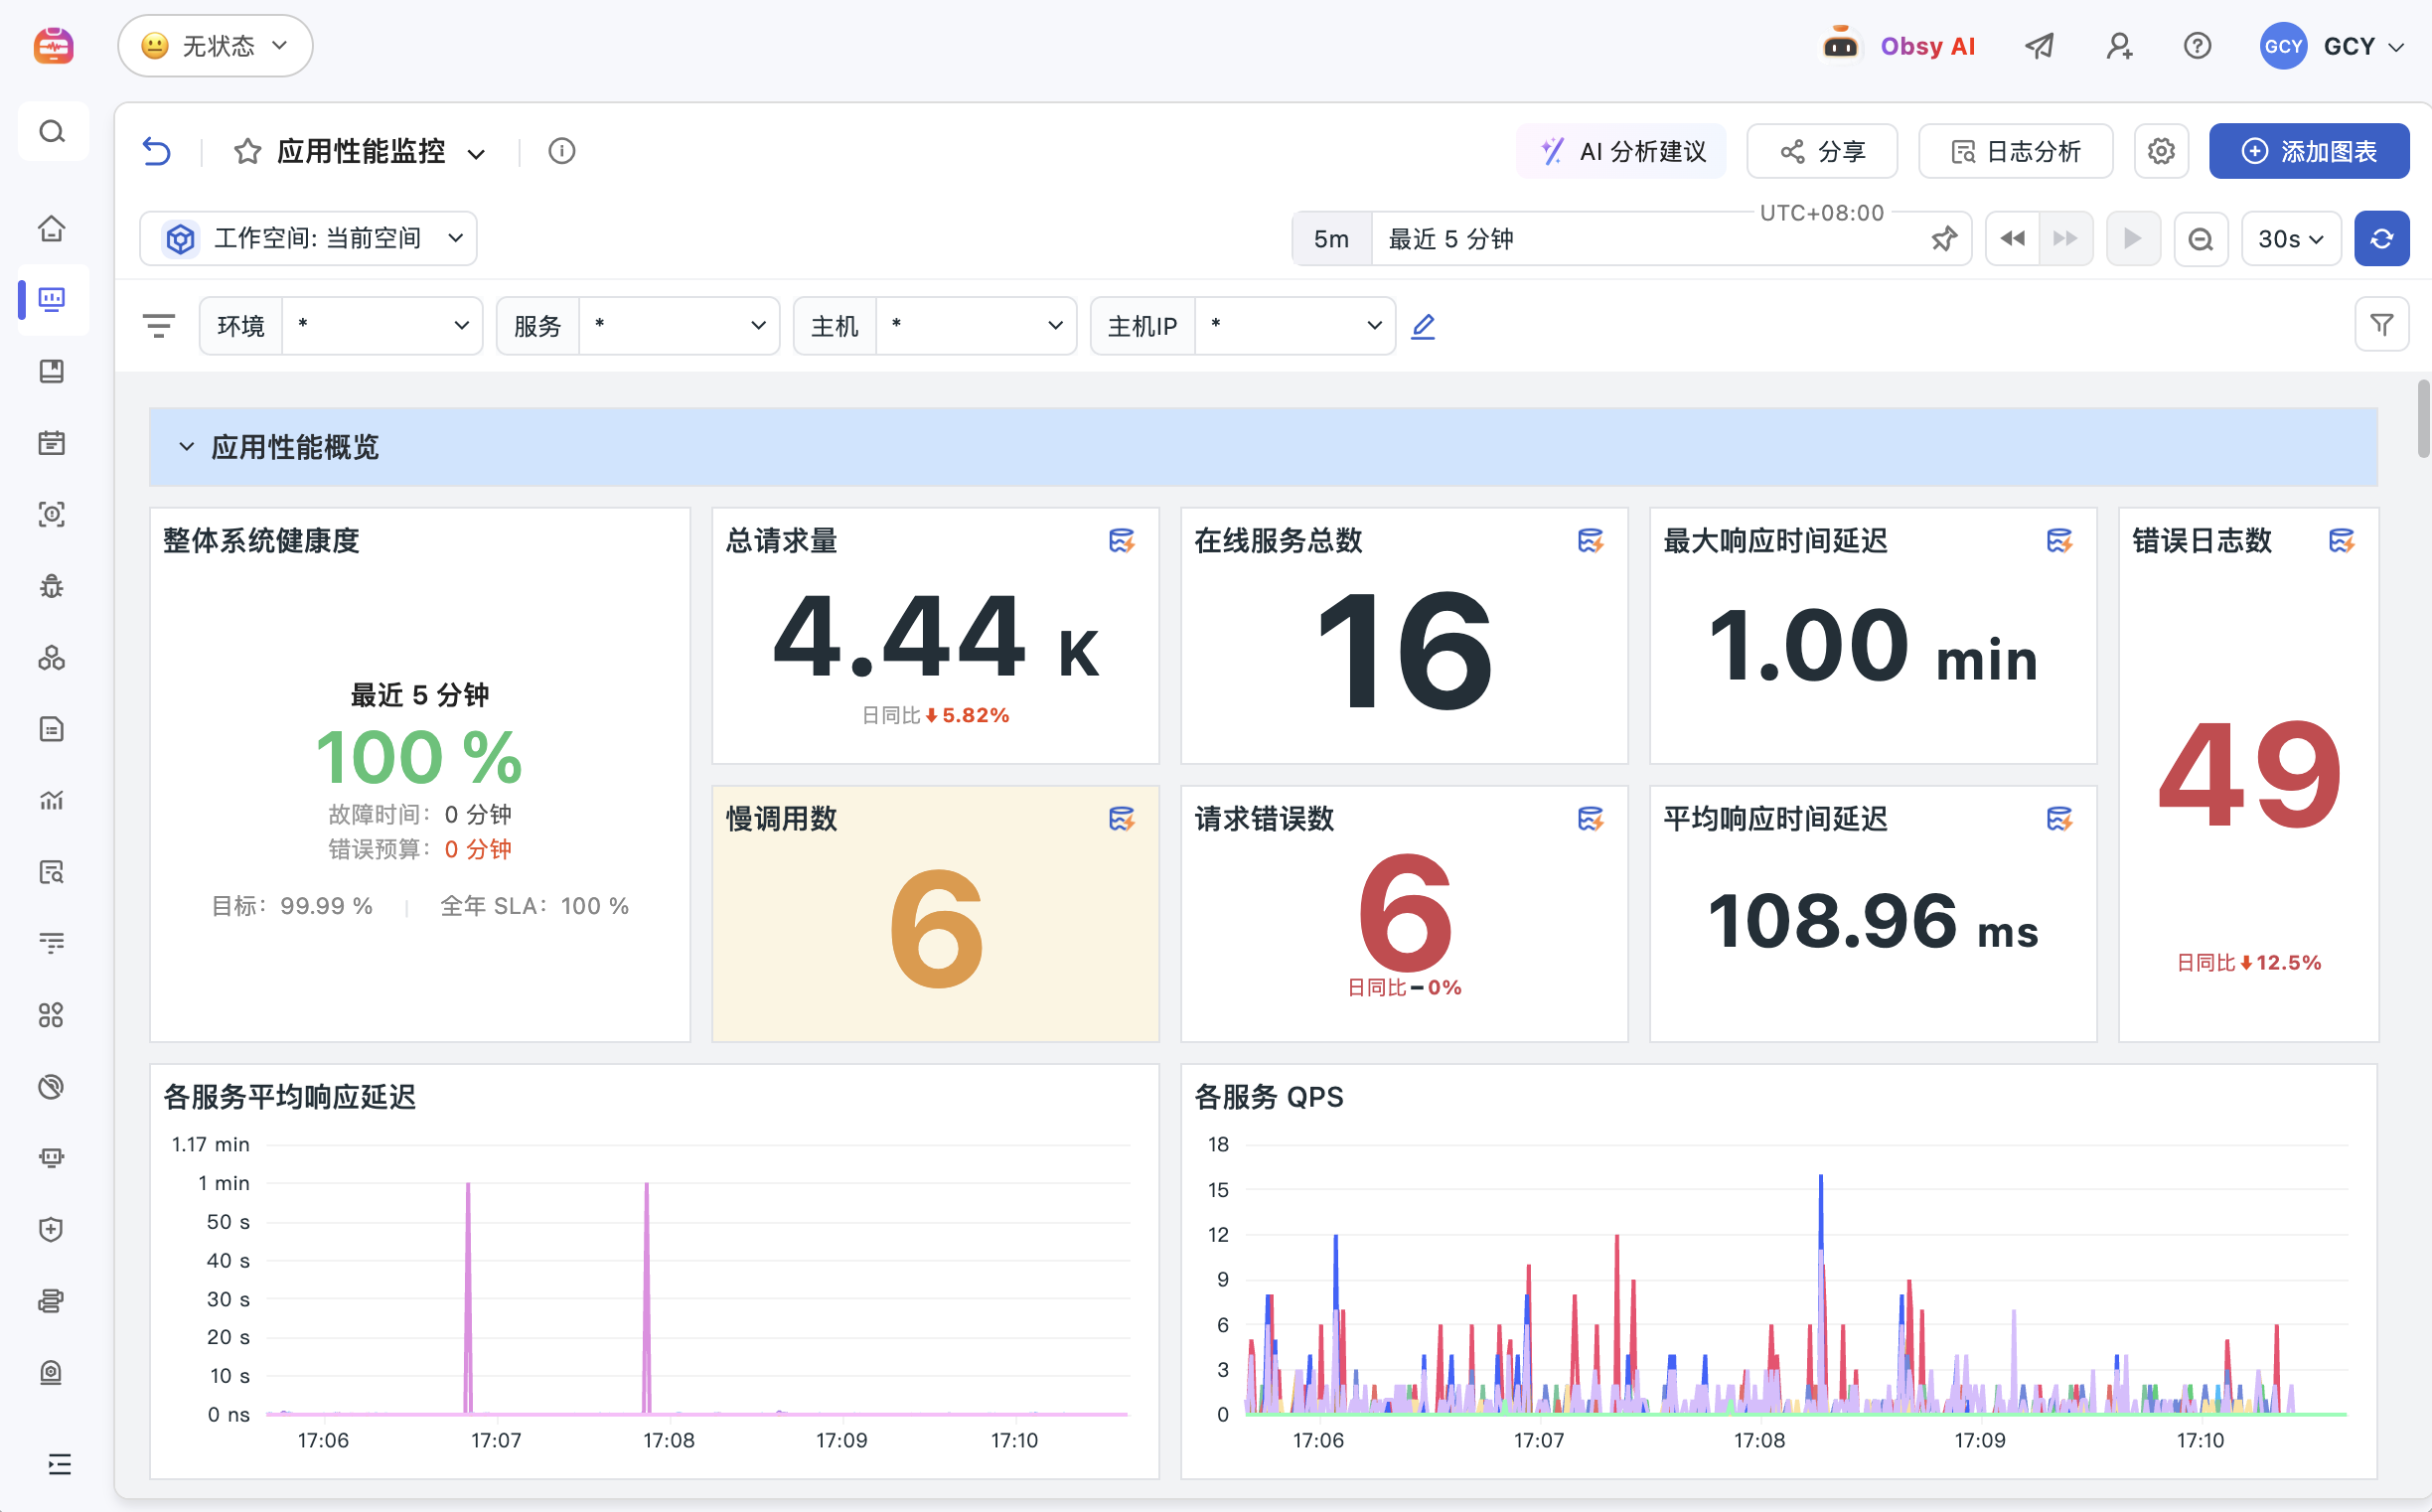
Guance Data Insights analyzes metrics, logs, links, access experiences, infrastructure, and business data in a unified view, helping teams quickly build dashboards, viewers, and notes, transforming scattered data into interpretable, collaborative, and actionable monitoring scenarios.

Data insights
Book a demo
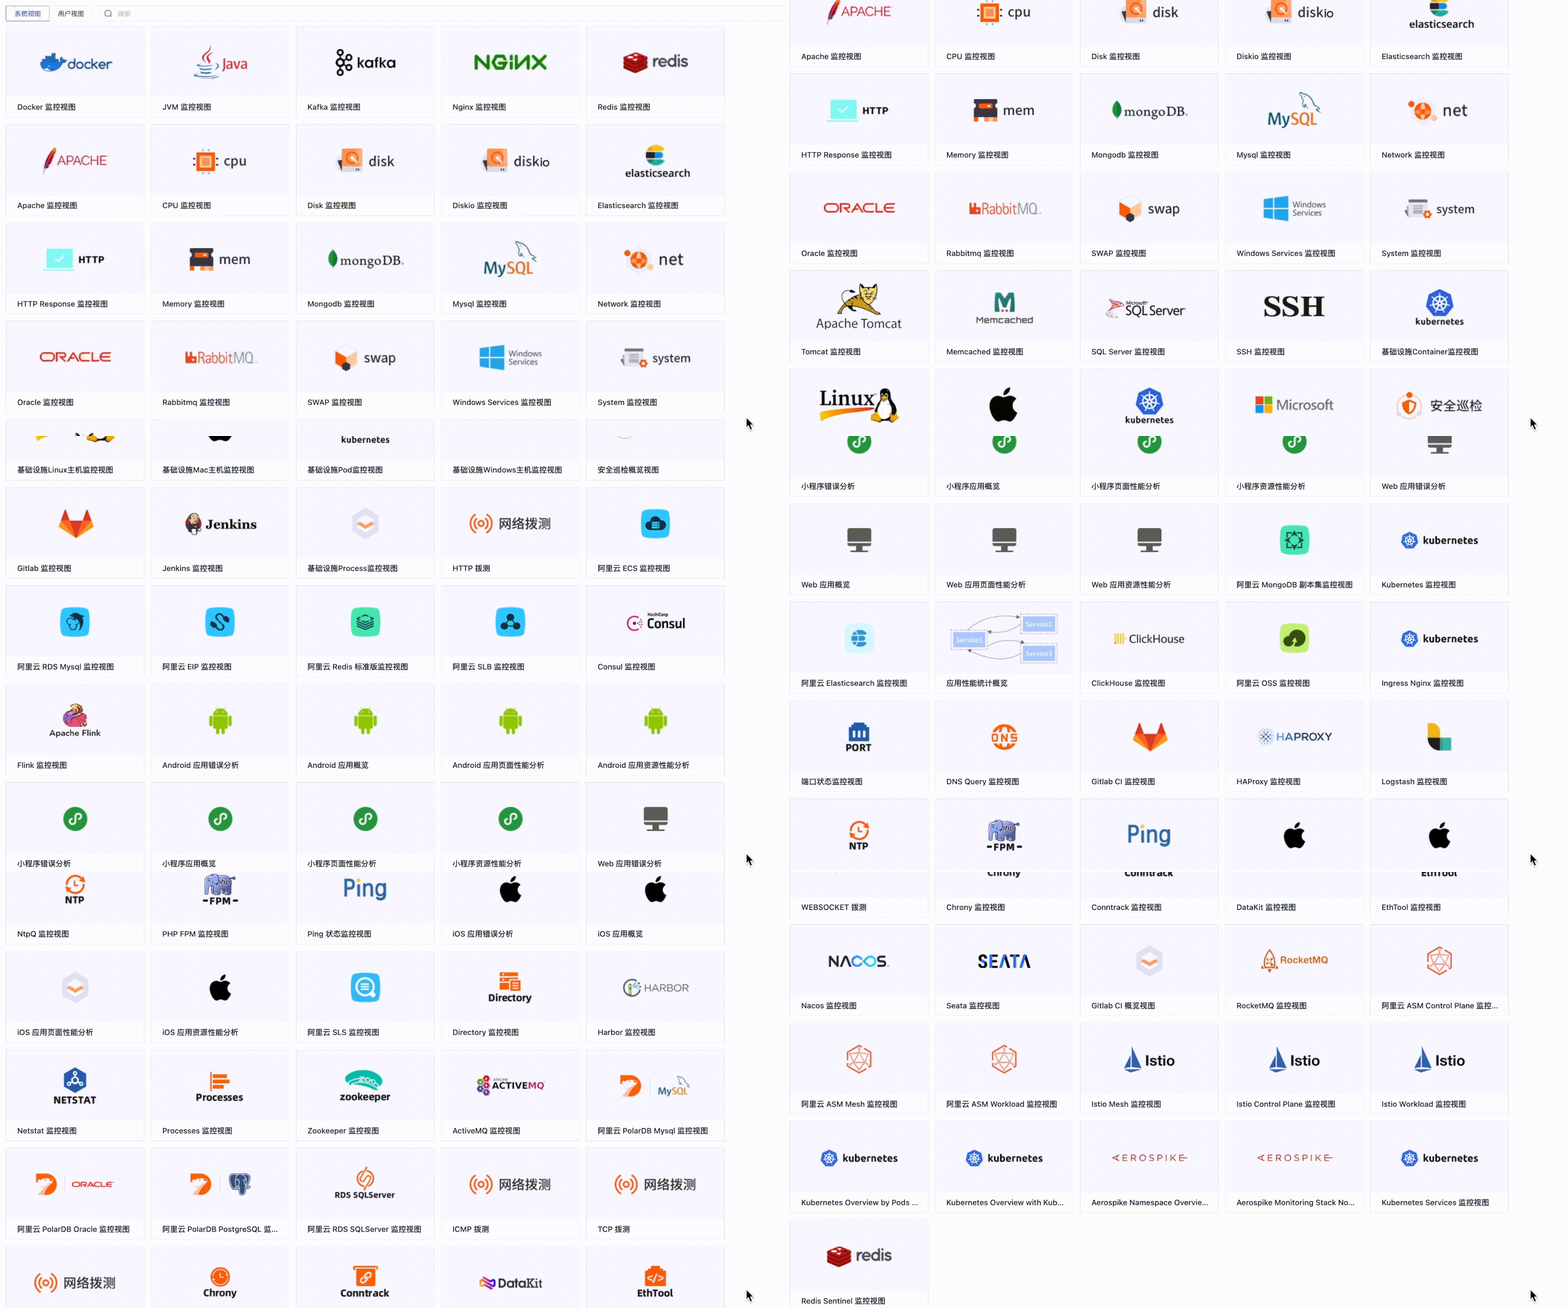
Don't want to build a Kanban from scratch? Quickly cover core monitoring scenarios with templates
'Guance' Built-in monitoring view templates covering infrastructure, middleware, Kubernetes, applications, availability, cloud resources, and more. Teams can first use templates to establish standard observation entries, then adjust according to business, environment, responsible person, or service dimensions, reducing the cost of redundant setup.
Don't want to build a Kanban from scratch? Quickly cover core monitoring scenarios with templates
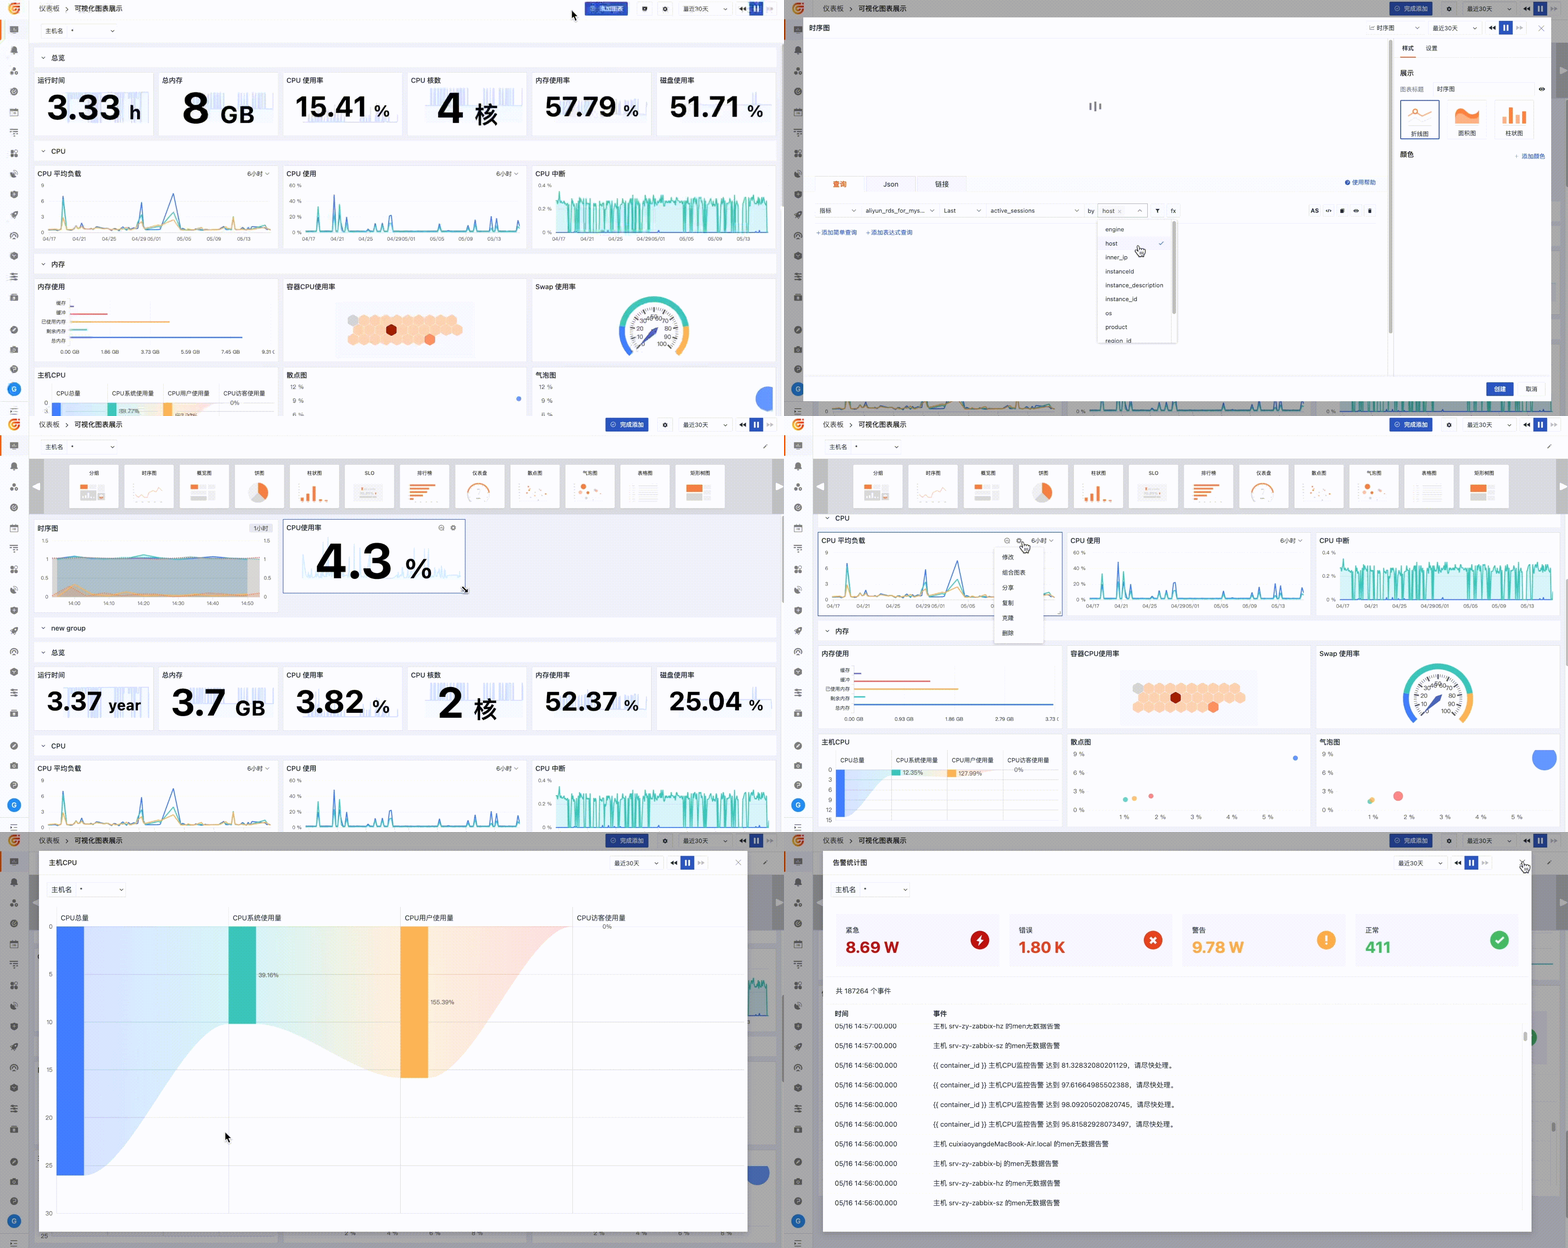
Not enough dashboard? Customize views according to team troubleshooting habits
Through flexible layout, chart components, DQL queries, and variable linkage, teams can organize key metrics, logs, links, events, and business data into a single monitoring scenario. The custom viewer can also adjust display modes based on data type and field structure, making troubleshooting entry points more closely related to real workflows.
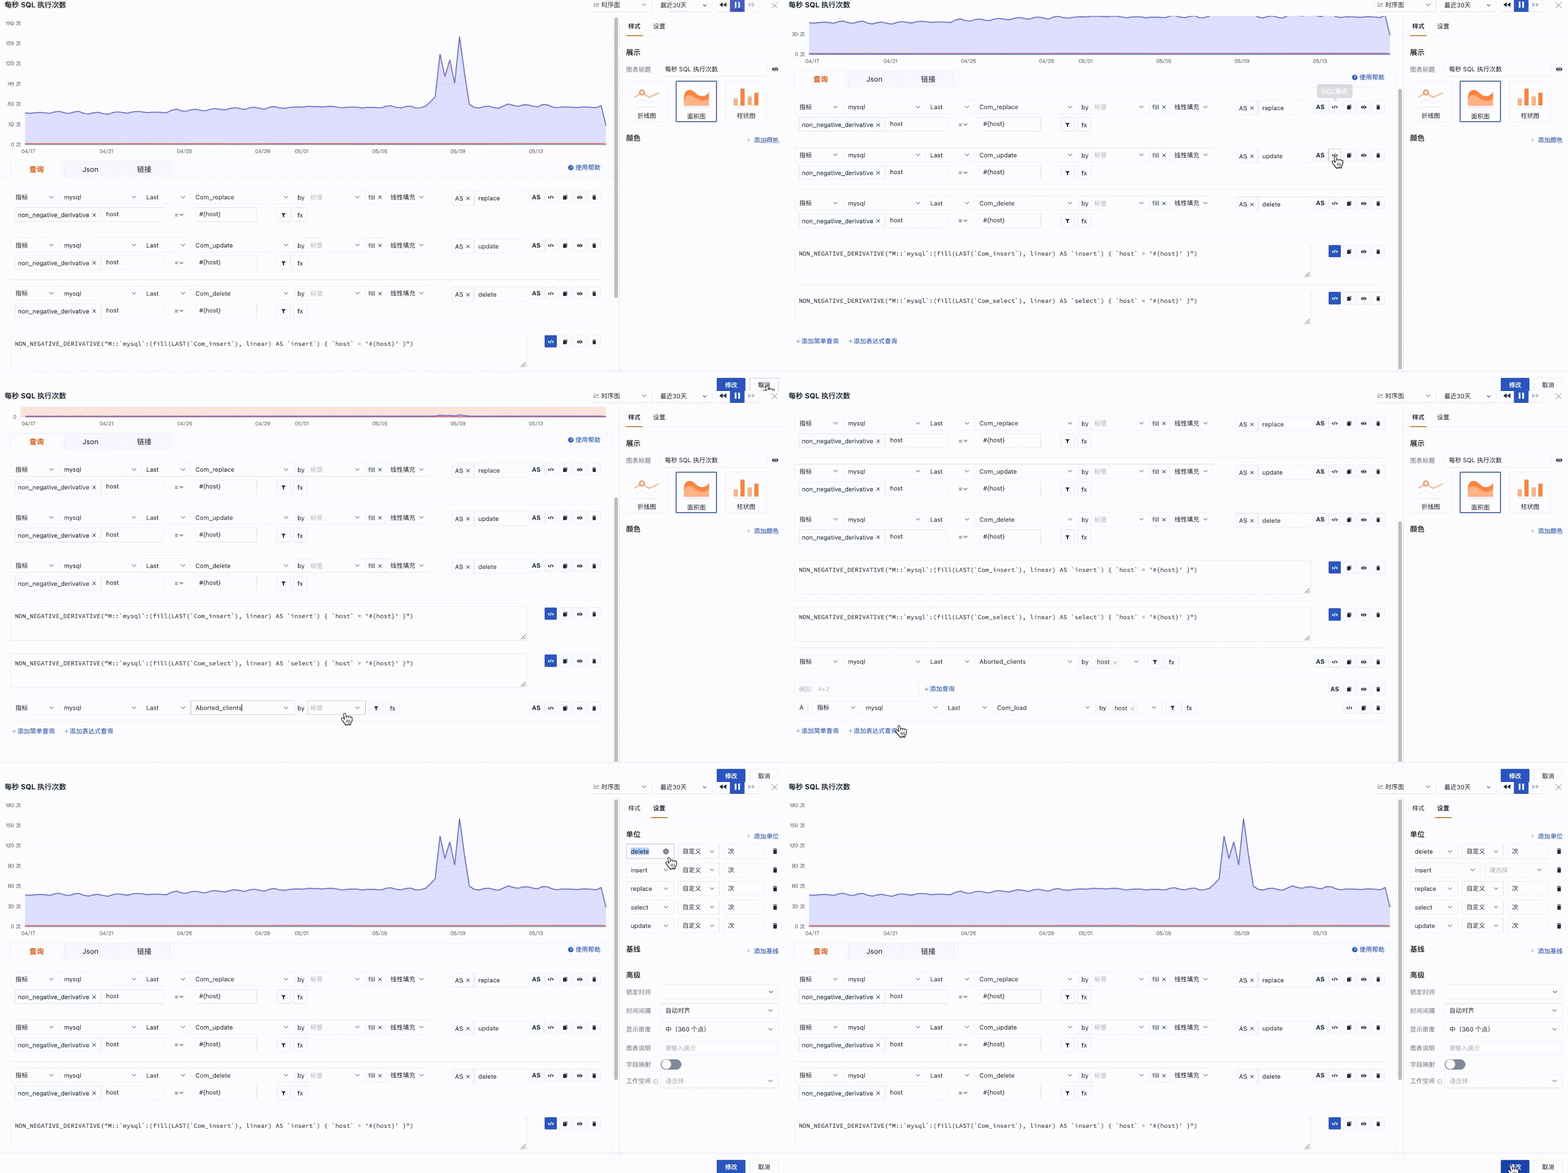
Are there many sources of data? Connect the context with unified queries
Metrics, logs, links, infrastructure, network, security, application performance, and access experience data can all be unified into a unified analytical perspective. Through simple queries, expression queries, DQL queries, aliases, unit conversions, time locking, and association links, the team can more quickly explain the causes behind abnormal trends.
Are there many sources of data? Connect the context with unified queries
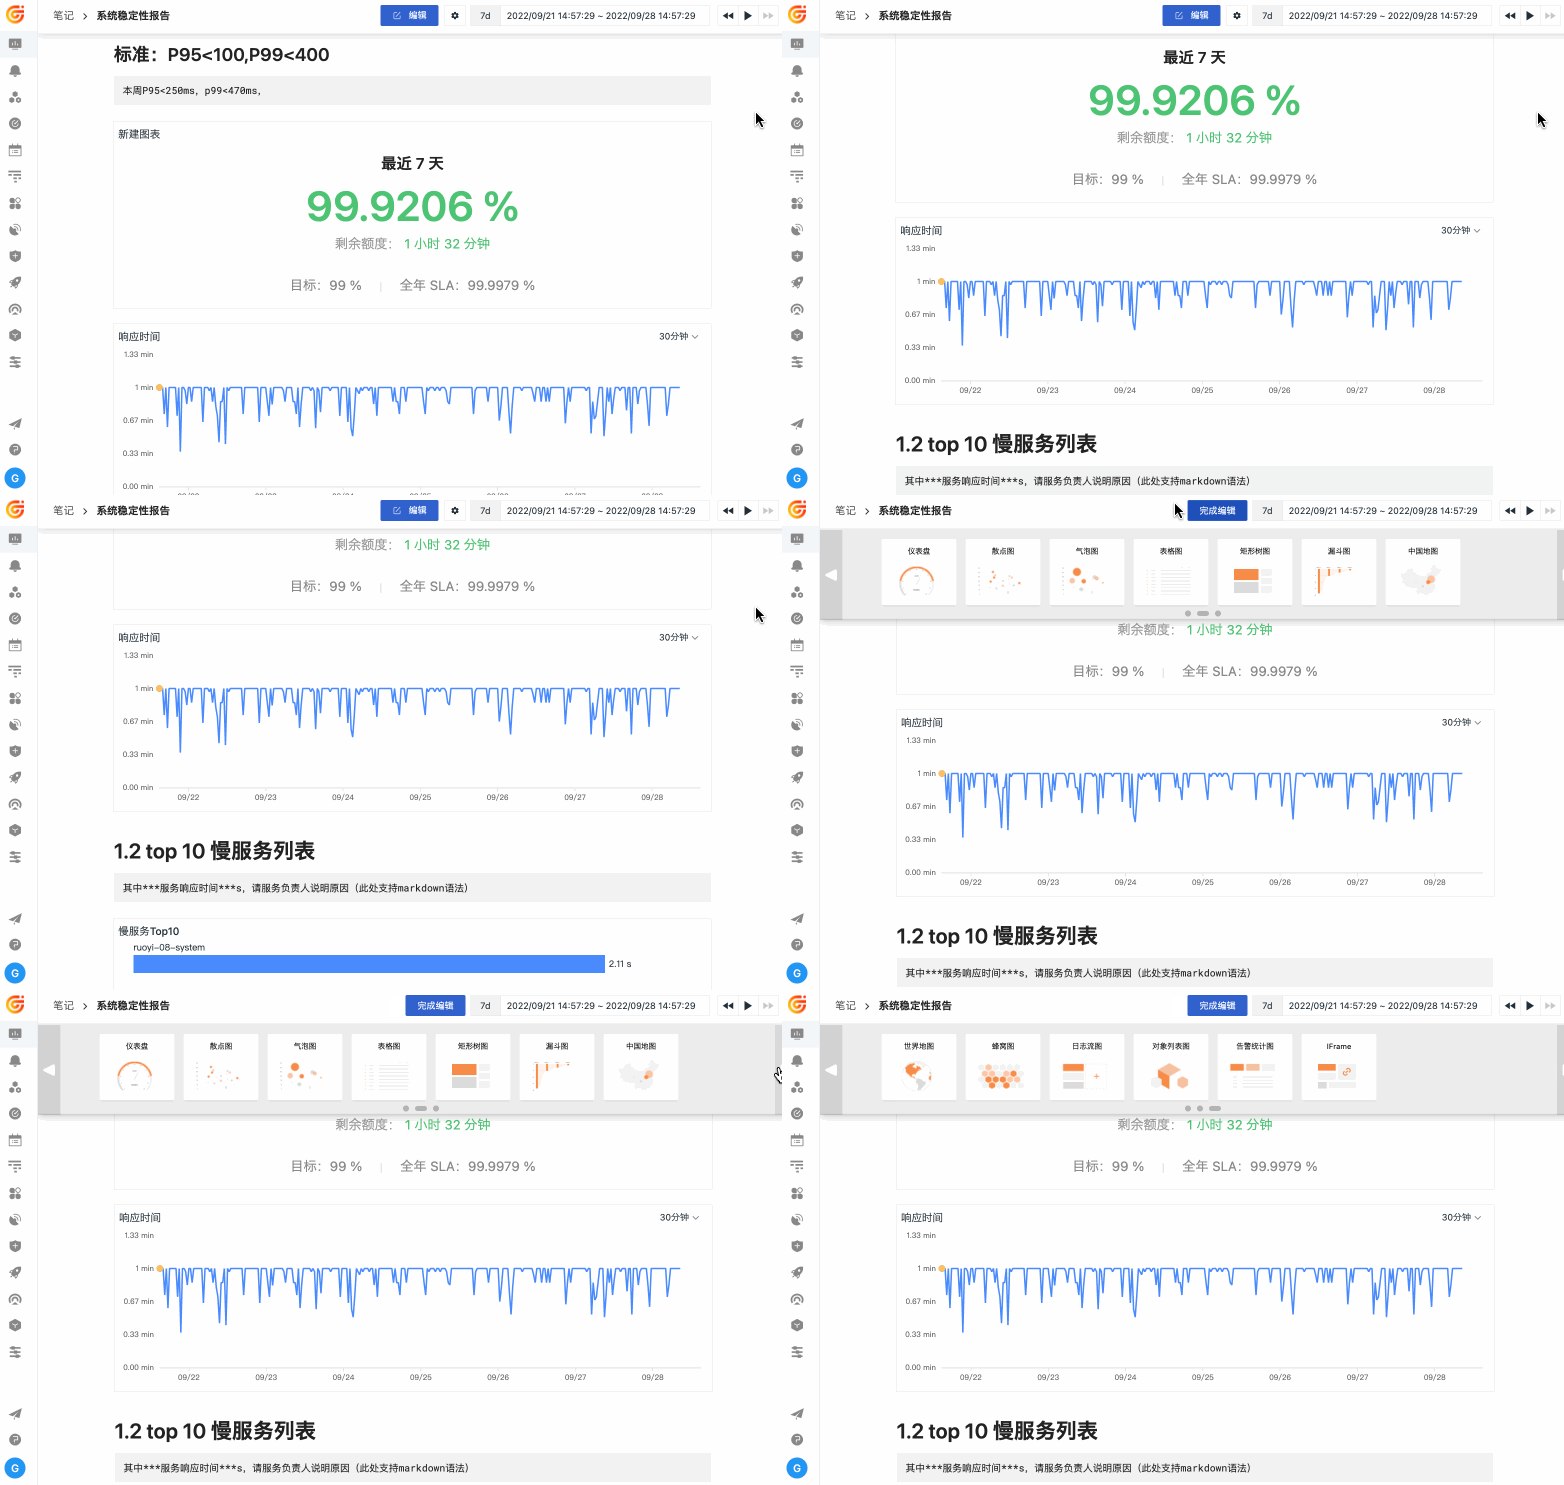
Should the investigation process be thoroughly examined? Use notes to preserve charts, conclusions, and evidence
Graphic notes can preserve key charts, query conditions, anomalies, and handling conclusions. When new members, cross-team collaboration, or fault reviews occur, there is no need to re-stitch the context; data evidence and judgment processes can be directly returned to that time.

Frequently asked questions

What are data insights suitable for?

Data insights are ideal for organizing metrics, logs, links, access experiences, infrastructure, and business data into dashboards, viewers, and notes for daily monitoring, troubleshooting, business reviews, and cross-team collaboration.

What is the difference between data insights and a regular dashboard?

Regular dashboards typically only display fixed metrics, but Guance data insights can link together multiple types of observable data through DQL, variables, association links, and custom viewers, helping teams continue tracking trends down to logs, links, events, and resource objects.

How can teams use data insights to improve troubleshooting efficiency?

Teams can consolidate commonly used troubleshooting paths into scene views, write key charts, filter criteria, and explanations into notes, and share snapshots with relevant members, reducing the cost of repeated queries and verbal synchronization.

Explore more

Resources and further reading

Choose the next step from product documentation, related solutions, and technical guidance.

Related reading

Selected product practices, troubleshooting guidance, and technical solutions

A powerful log viewer to support data linkage analysis

A powerful log viewer to support data linkage analysis

Guance viewer's powerful query filtering and search functions help users quickly and accurately retrieve data and locate faults. The log viewer not only helps us collect and manage various log files, but also enables correlation analysis with multi-party data, providing users with more comprehensive and accurate data information to support efficient decision-making.

Product capabilities
Leverage Guance to build a unified enterprise-level log center

Leverage Guance to build a unified enterprise-level log center

Guance adheres to the philosophy of "unified collection, unified processing, and unified analysis," building an efficient observation data analysis platform. This article Guance how to help enterprises quickly and effectively build unified log centers through the various processes of log collection, processing, storage, and analysis.

Best practices
Pipeline helps you easily manage massive amounts of data!

Pipeline helps you easily manage massive amounts of data!

Data governance has become crucial in today's information age. As the volume of data continues to grow and diversify, organizations need to effectively manage and utilize this data to support business decisions and innovative development. Whether for data analysis or parsing, using Pipeline helps organizations automate and standardize data governance; Providing organizations with clearer and more actionable data views to strongly support data governance.

Product capabilities
Guance VS ELK: Who is the king of log monitoring?

Guance VS ELK: Who is the king of log monitoring?

This article provides a detailed analysis of Guance and ELK from multiple dimensions including data collection, data storage, data query, data visualization, and usage costs, providing a reference for users when making a choice.

Industry insights

Want to see how data insights are reflected in your business systems?

Book a demo