Contact us

Join the community

Scan with WeChat
Join the official community group

Try Guance

Start online with usage-based pricing and a true cloud service.

Get started

Choose a Guance edition

Code repositories

CI Visibility

CI visualization

Guance CI visualization continuously tracks the status, time, failure rate, and log context of pipelines, stages, and jobs, helping R&D, DevOps, and platform teams identify pipeline failures, build slowdowns, and release quality issues, making continuous integration processes observable, analyzable, and optimizeable.

Book a demo

What problems does CI visualization solve?

Ensure every build, test, and release has a traceable quality context

When the pipeline fails, builds slow down, or releases are unstable, the team needs to know which pipeline, stage, or job the problem occurred in, what the reasons for the failures, and whether it affects delivery rhythm. Guance CI visualization brings continuous integration processes, task logs, time usage trends, and exception context into a single view, helping teams recover delivery efficiency more quickly.

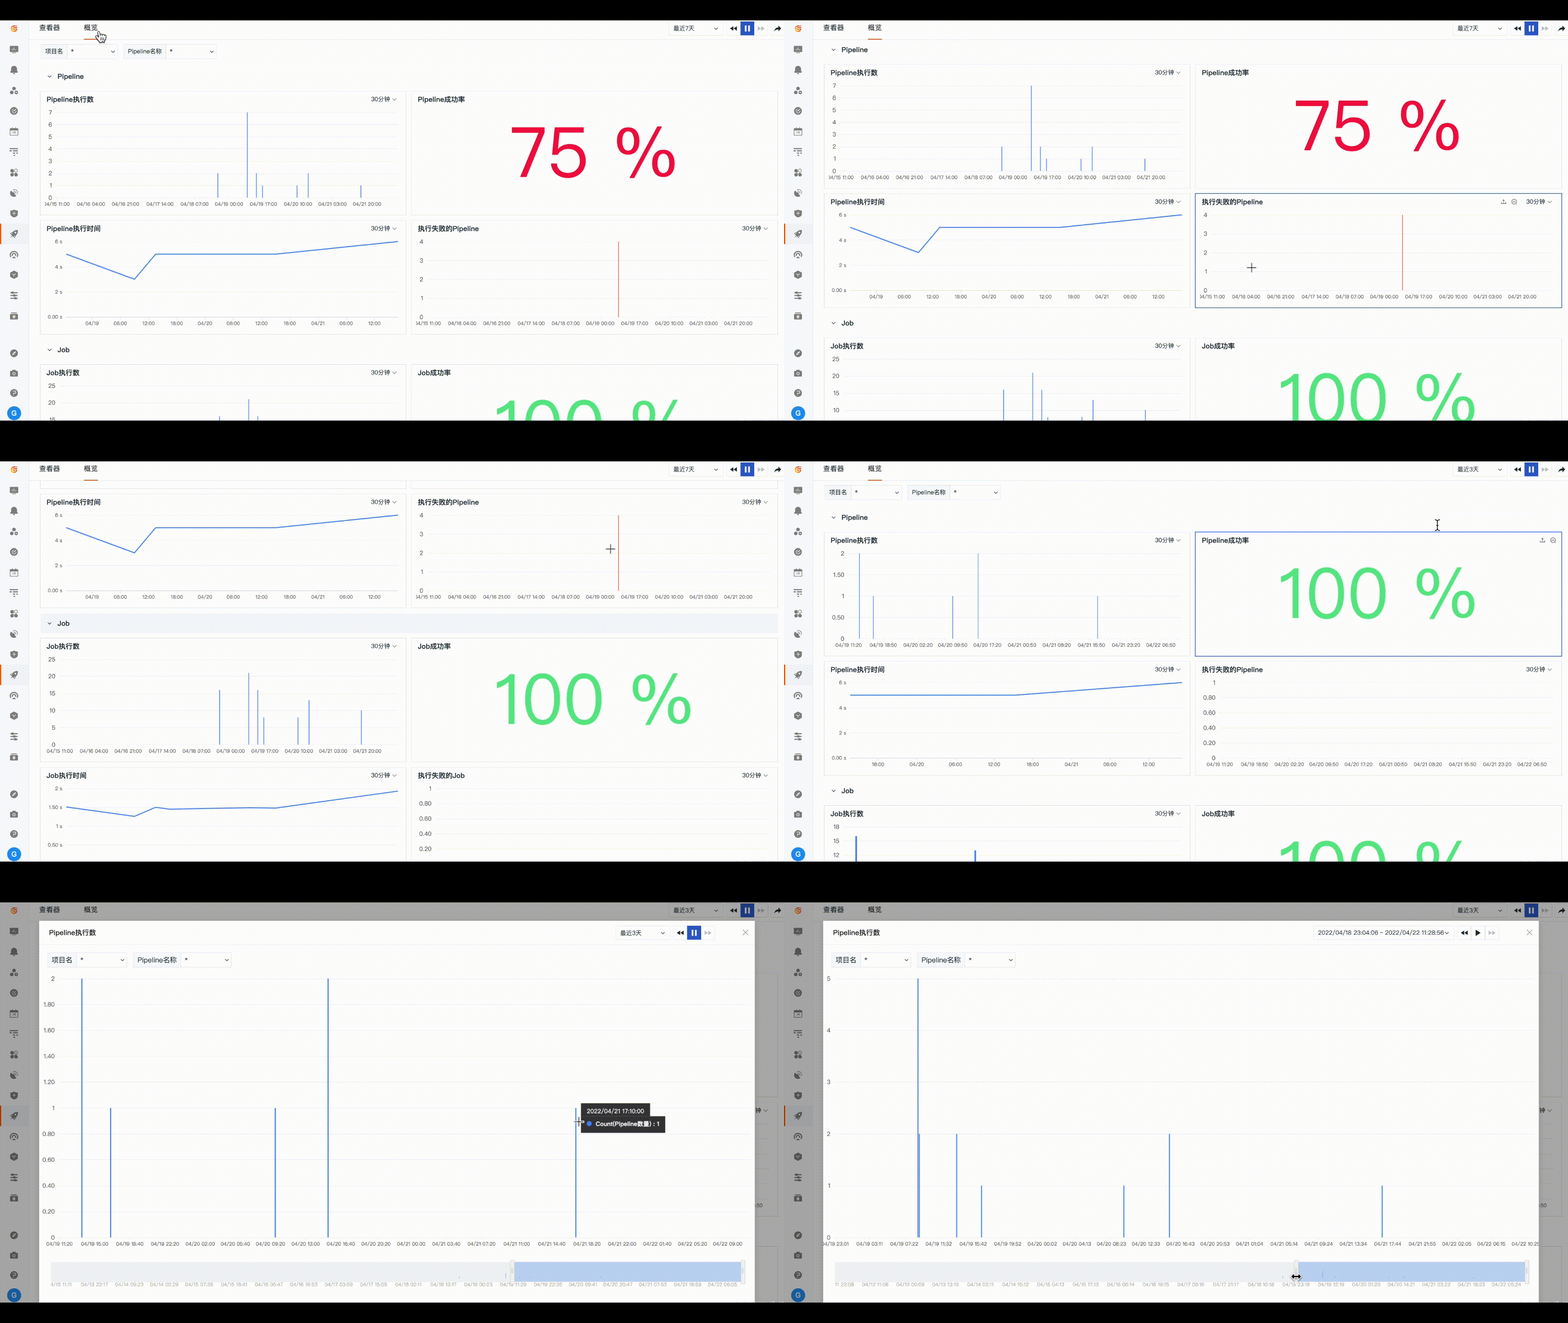
Is the assembly line healthy overall? First, look at success rates, failure rates, and time consumption trends
CI visualization aggregates execution count, success rate, failure rate, average time, and trend changes during continuous integration into a unified view. R&D and DevOps teams can quickly determine whether the release chain is stable and whether a project, branch, or stage is continuously delaying delivery.
Is the assembly line healthy overall? First, look at success rates, failure rates, and time consumption trends
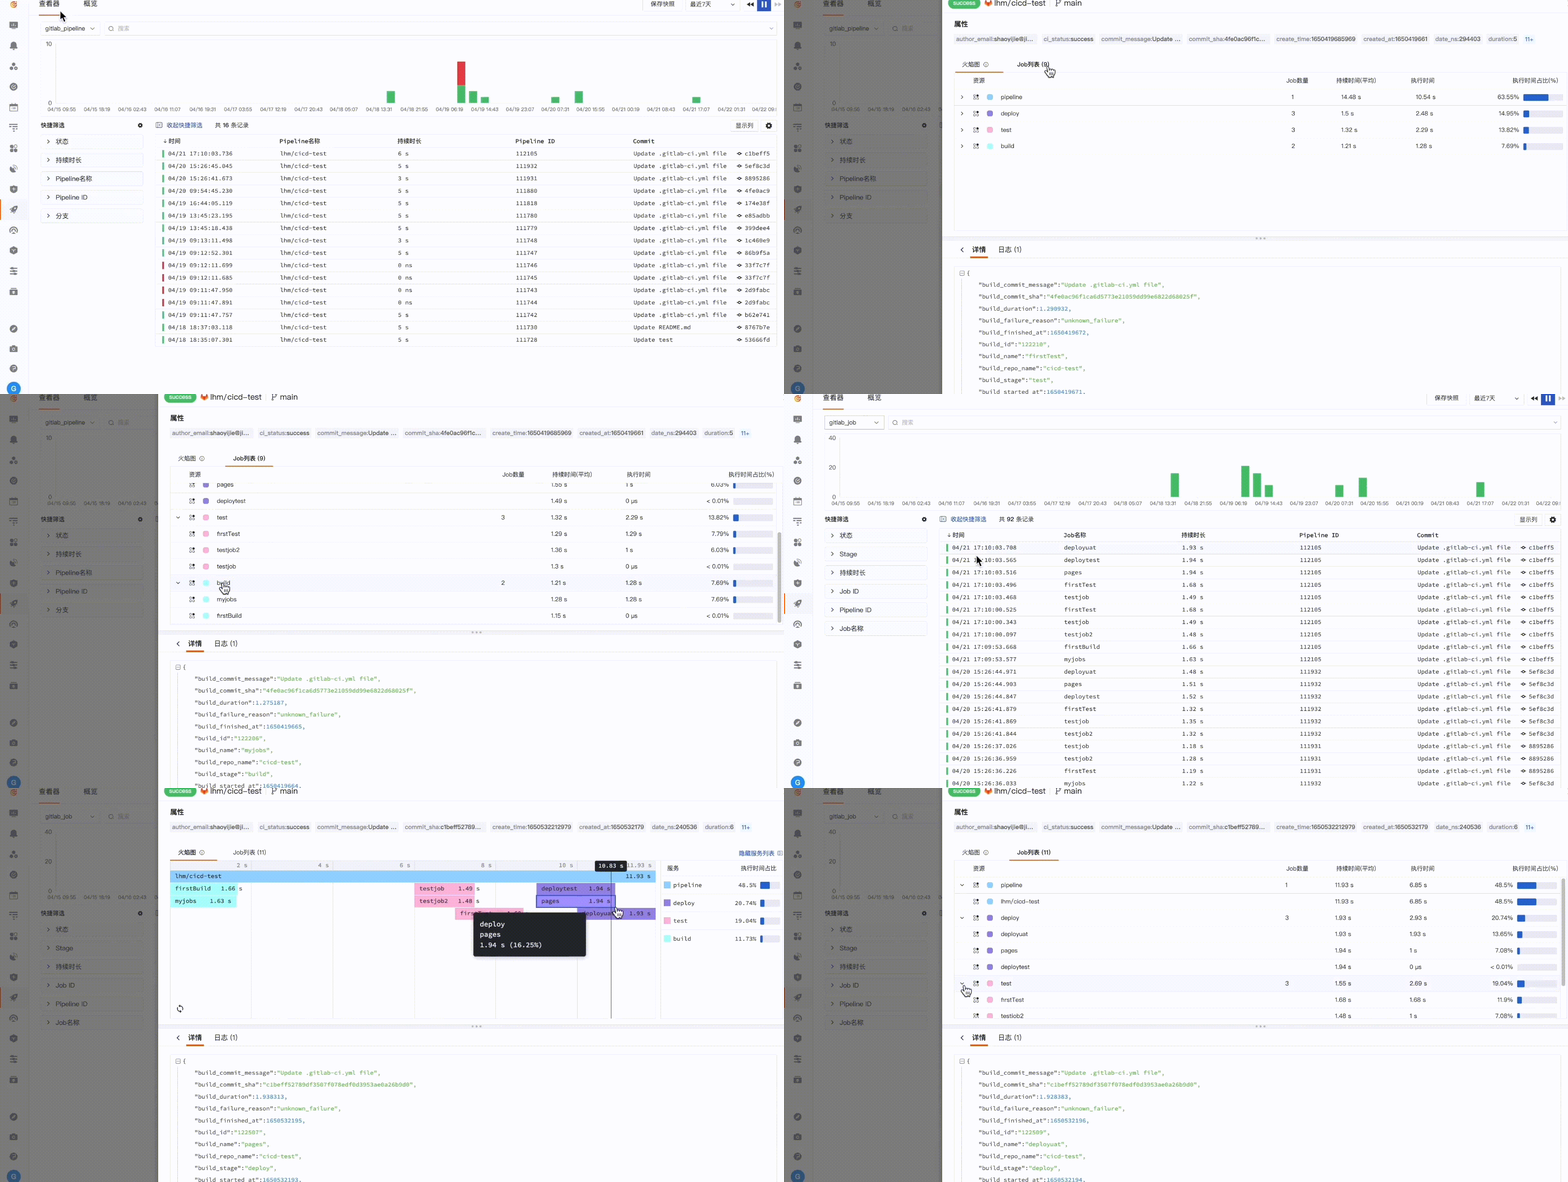
Which job delayed the release? Press Pipeline, Stage, and Job to drill down
The CI Visualization Viewer records runtime, execution results, failure reasons, and log information for each pipeline, stage, and job. Teams can move from a failed build to specific tasks, determining whether issues arise from dependencies, downloads, test cases, build scripts, environment configuration, or deployment steps.
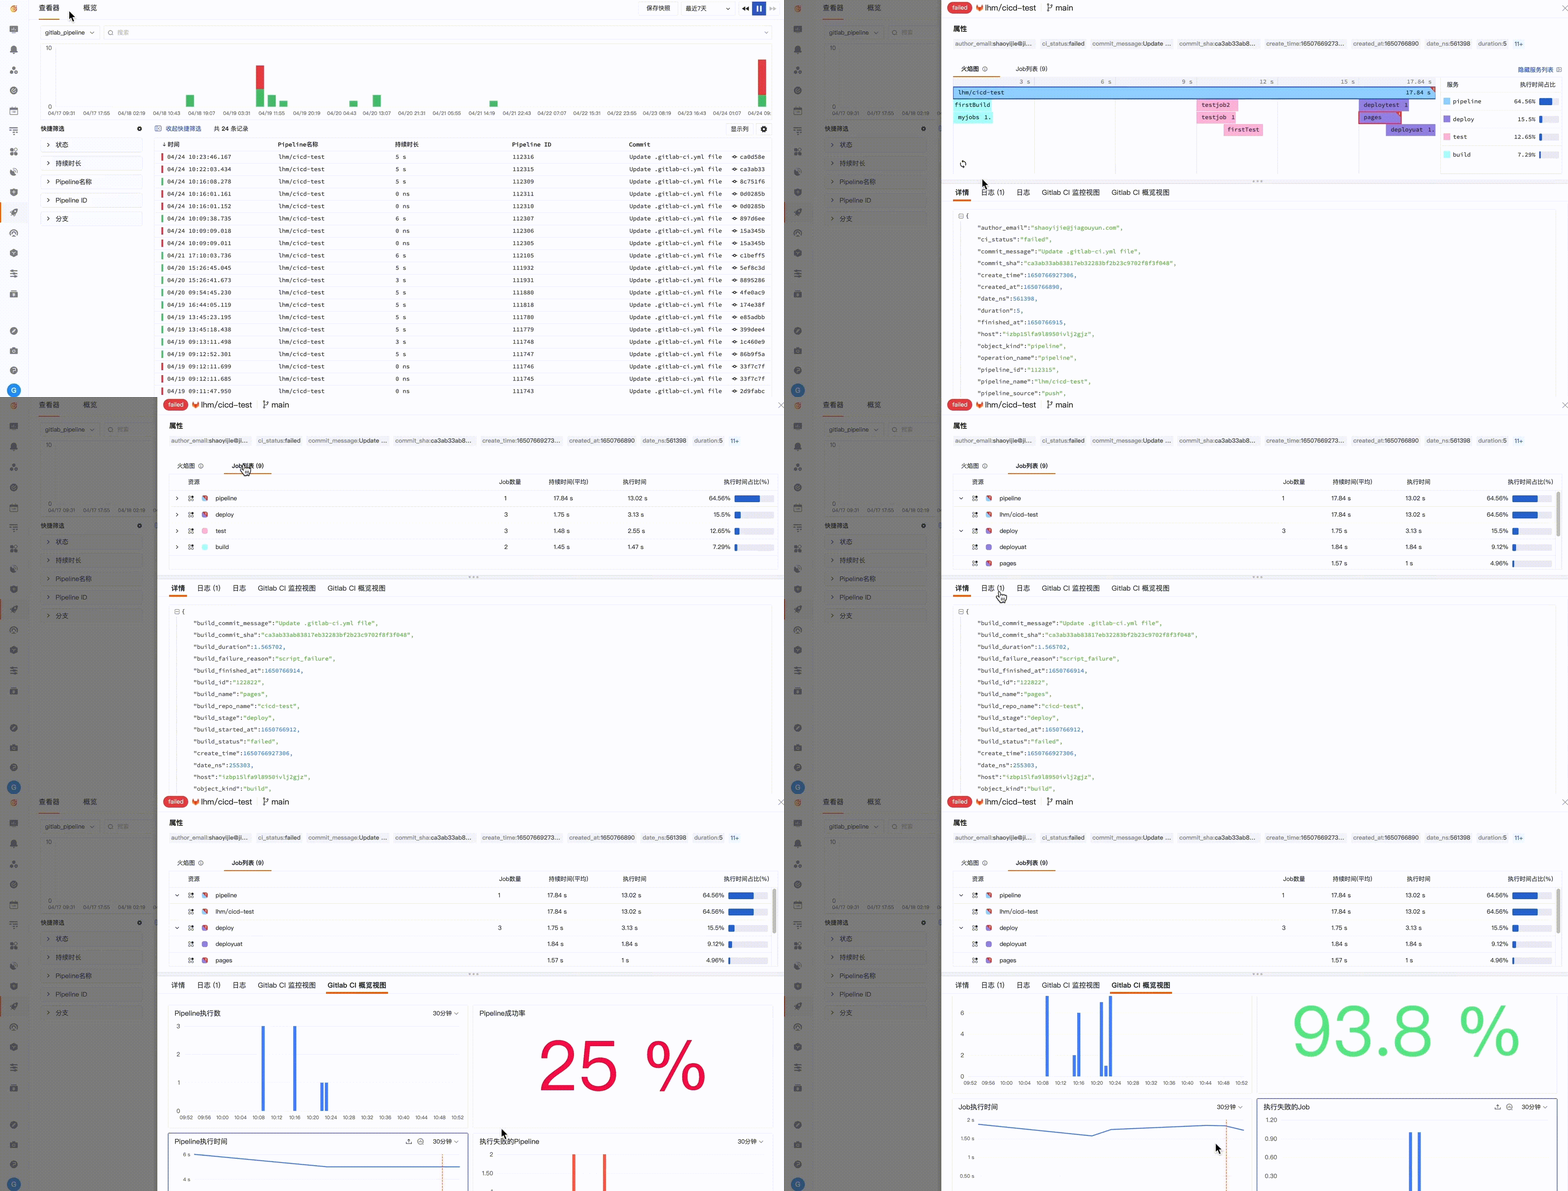
After a build fails, logs, configurations, and error contexts must be able to be connected immediately
When a CI task fails, Guance can associate task logs, error messages, call spans, and YAML configuration context to help teams quickly pinpoint the failure location. For tasks that repeatedly fail or are time-consuming, they can also be converted into alerts and events, reducing the time spent manually flipping logs.
After a build fails, logs, configurations, and error contexts must be able to be connected immediately

Frequently asked questions

What is CI Visualization?

CI visualization is used to continuously observe the execution status, time consumption, failure rates, and log context of pipelines, stages, and jobs, helping teams analyze quality and efficiency issues during continuous integration and continuous delivery.

What issues can CI visualization help pinpoint?

It helps identify issues such as pipeline failures, slow builds, unstable testing, deployment task anomalies, configuration errors, and repeated failures, and assists teams in determining which stage or task is causing the impact.

How does CI visualization improve release efficiency?

Teams can identify inefficiencies through success rates, failure rates, task time, and anomaly trends, quickly fixing issues with logs and configuration context, reducing troubleshooting time after construction failures.

Related reading

Want to see how CI visualization is implemented in your business system?

Book a demo