
Comparison
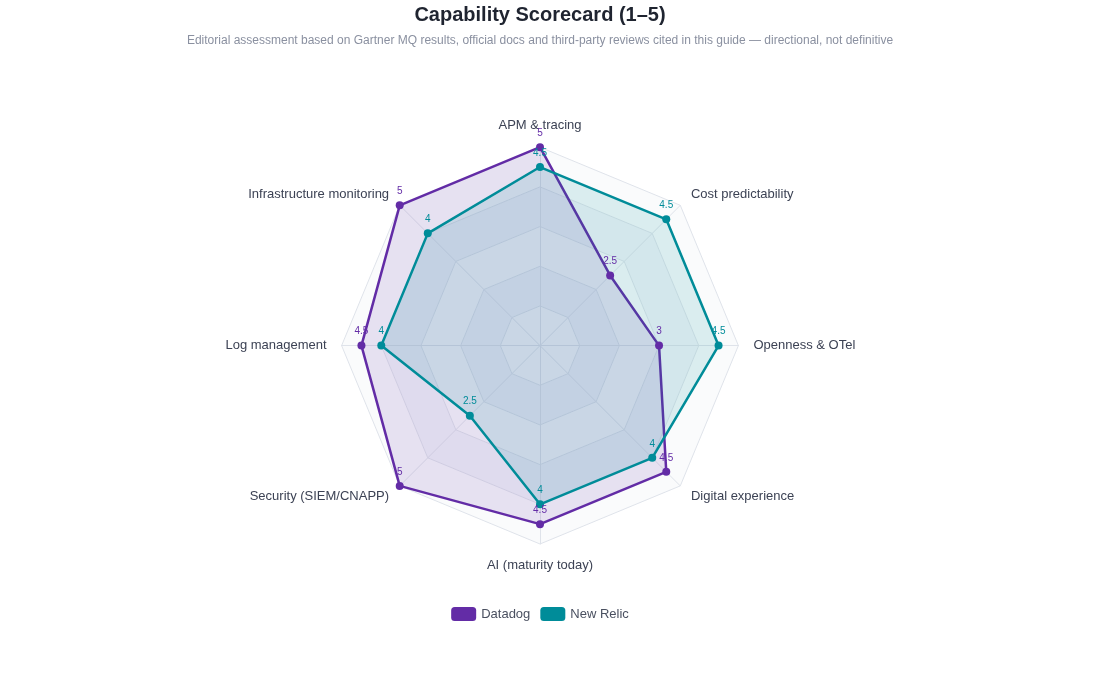
Datadog vs. New Relic (2026): An Honest Buyer's Guide
Datadog vs New Relic compared on pricing, APM, infrastructure, logs, RUM, OpenTelemetry, AI, security, and TCO—with worked cost scenarios for buyers.
DatadogComparison
Datadog vs New Relic compared on pricing, APM, infrastructure, logs, RUM, OpenTelemetry, AI, security, and TCO—with worked cost scenarios for buyers.
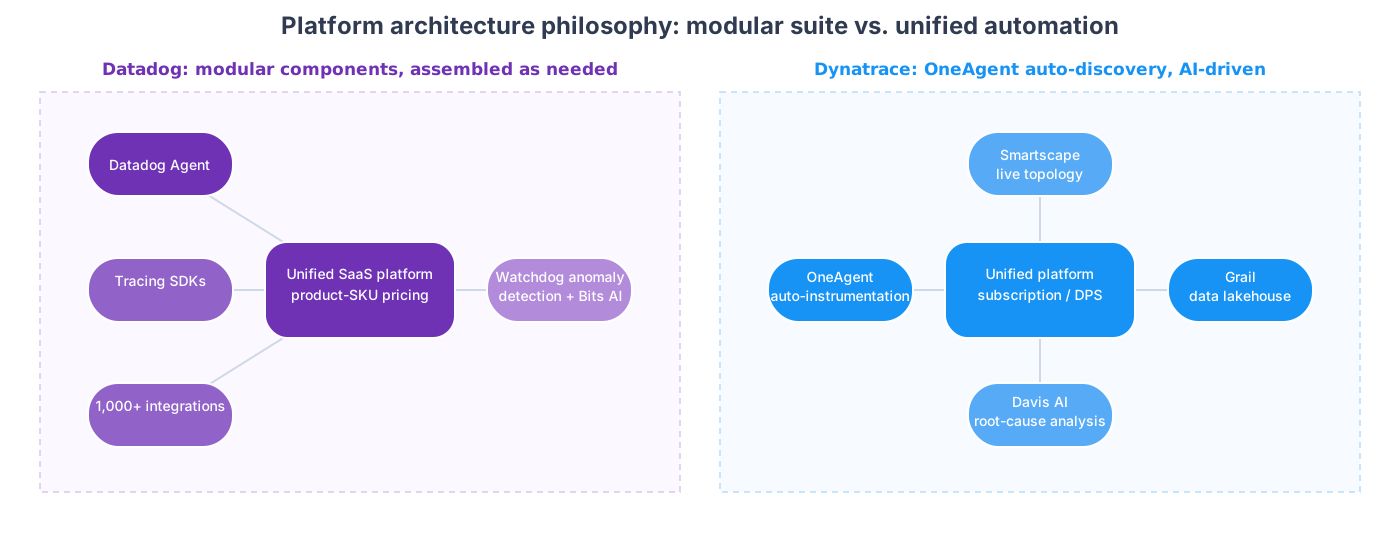
Compare Datadog vs Dynatrace on setup, APM, logs, AI, security, pricing, TCO, and deployment. See where each wins and which platform fits your team.
A practical comparison of Datadog and Guance for Singapore teams, covering platform scope, deployment, OpenTelemetry, regional availability, operations, and migration considerations.
Datadog vs Elastic Observability on 2026 pricing — per-host SKUs vs per-GB serverless ingest, the normalized-size billing catch, self-managed option, one workload bill.
Understand Kubernetes through desired state, the control plane, nodes, Pods, workloads, and Services—what it automates, what remains yours, and how to inspect failure.
Understand Datadog AP1 pricing for Singapore with public rates, a transparent 30-day log model, worked cost examples, and the assumptions that change the estimate.
APM monitoring explained — distributed tracing mechanics, RED/USE metrics, sampling strategies, OpenTelemetry vs vendor agents, and how to choose an APM tool.
Monitor AWS RDS properly — CloudWatch vs Enhanced Monitoring vs Performance Insights, the metrics and alarms that matter, slow query setup, and cost traps.
Kafka consumer lag explained and monitored — kafka-consumer-groups.sh, Lag Exporter vs Burrow, lag-rate alert rules, and time-lag metrics that actually page correctly.
Find and fix MySQL slow queries — enable the slow query log, analyze with pt-query-digest, catch them live with performance_schema, and alert before users notice.
CrashLoopBackOff explained — what it actually means, the kubectl diagnosis sequence, and the 8 root causes with fixes: config, probes, OOM, init containers, and more.
OOMKilled in Kubernetes — what exit code 137 means, limits vs node memory vs JVM heap, how to diagnose with kubectl, and the fixes that actually hold.
Keep your existing DDTrace instrumentation, send one service to DataKit, check trace delivery and sampling, and retain a clear rollback path.
Collect Docker metrics and container events with Guance DataKit in minutes. One-click setup, 30+ key metrics, full documentation.
Collect Go metrics and runtime metrics with Guance DataKit in minutes. One-click setup, 30+ key metrics, full documentation.
Collect Java metrics and distributed traces with Guance DataKit in minutes. One-click setup, 40+ key metrics, full documentation.
Contact us
Join the community

Try Guance
Start online and pay only for what you use.
Get startedChoose a Guance plan