


Choosing an AI Agent observability platform in 2026
Compare Guance, AI-focused platforms, APM extensions, and self-hosted stacks by session debugging, evaluations, token attribution, data location, and operating cost.
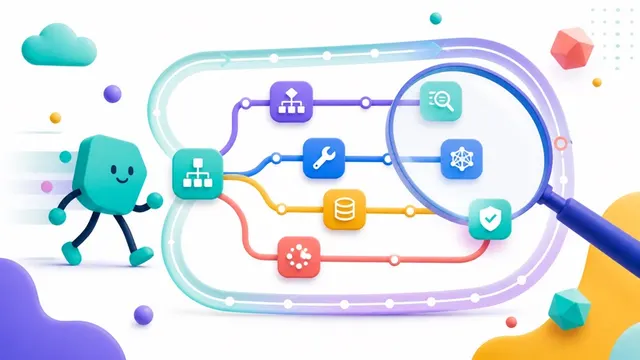
An Agent can return HTTP 200 and still fail its task. It might choose the wrong tool, retrieve irrelevant evidence, repeat an expensive step, or produce an answer that the application cannot use. Request latency and error rate help locate runtime failures, but they do not explain those decisions on their own.
That is the practical reason to evaluate Agent observability. A useful platform should reconstruct a task across model calls, tools, retrieval, retries, and subsequent turns. It should also show what that task cost and connect an application failure to the services involved.
There are four common approaches: use Agent capabilities in a broader observability platform such as Guance; adopt an AI-focused platform such as LangSmith or Langfuse; extend an existing application performance monitoring (APM) deployment; or assemble a self-hosted stack. The right choice depends on which workflow is hardest for your team today and who will operate the result.
Published by Guance. This comparison is based on product documentation; it does not report a shared performance benchmark.
Distinguish a model call, a trace, and a session
A model-call view records latency, errors, model identity, and token usage. A trace can connect a model call to retrieval and tool execution within a request. A session groups related activity across turns or separate requests.
These are complementary views. A well-instrumented trace can absolutely show that an Agent selected a bad tool in its third step. The problem is missing instrumentation or context, not an inherent limit of tracing. A session becomes useful when the explanation spans several traces: a prior turn changed state, a user resumed a task, or one Agent handed work to another.
Nor does observability expose a model's private internal reasoning. It can record the inputs, outputs, tool selections, and runtime events that the application or provider makes available. Decide which of those observations you need, then verify that your instrumentation actually captures them.
OpenTelemetry's GenAI conventions provide a common vocabulary for supported model and Agent telemetry. They reduce custom mapping work, but “supports OpenTelemetry” does not guarantee identical session views, evaluation metadata, or token accounting in every backend. Instrumentation and semantic-convention versions still matter: evolving conventions can change the attributes exported by an integration. OpenTelemetry GenAI conventions
Option 1: operate Agent and service telemetry together in Guance
Guance's Agent Monitoring is intended to connect Agent and LLM requests with the application request path. Its documented views include sessions and traces, tool activity, token usage, and related application context. For a team already investigating services, logs, and infrastructure in Guance, the relevant question is whether the same investigation can now include the Agent task.
A useful starting point is a slow tool call in the middle of a conversation. The session view connects the surrounding turns; the trace shows where the time went. When the tool invokes an instrumented service, shared trace context and collected logs can carry the investigation into that service. Without those identifiers, putting both data sets in one platform does not create the missing link.
The same distinction matters when the problem is an incorrect answer. Guance documents Prompt Eval, Schema Eval, manual annotation, and dataset-based batch evaluation. Schema Eval can expose a malformed response, but a structurally valid response can still be wrong. An emitted risk event adds context only when it links to the relevant session, trace, or span; an empty risk panel is not evidence that the run was safe.
Usage attribution has a similar blind spot: a provider that omits token counts must not look like a free call. Model and application breakdowns are useful only if missing usage remains distinguishable from zero. Session identity also needs to survive retries and resumed work, while each attempt remains separately visible.
The Agent Monitoring documentation describes these views. Their contents depend on the connector or framework integration and its settings. With input/output capture disabled, traces can arrive successfully while prompt and completion fields remain empty. That is an intentional data boundary, with a direct consequence for how much of a bad answer an engineer can reconstruct.
Guance's OWL CLI and MCP access are a separate selection dimension: they let authorized tools work with observability data. Do not confuse observing an Agent with granting that Agent access to operational data. Evaluate credentials, scope, and allowed actions for that access path.
Private deployment can be relevant when telemetry must remain within a controlled environment. It does not, by itself, keep model inputs inside that environment if the application or evaluator calls an external model API. Review the complete data path, including inference, evaluation, storage, support access, and backups.
This option fits teams whose Agent failures often involve application services and whose preference is to configure a shared operational platform rather than maintain another telemetry backend. Confirm that the specific session and evaluation workflows meet the development team's needs before consolidating.
Option 2: choose an AI-focused development platform
LangSmith, Langfuse, Braintrust, and Arize Phoenix place AI traces, experiments, and evaluation close to the development workflow. Their product boundaries differ enough that they should be tested individually rather than scored as one interchangeable category.
LangSmith deserves an early trial for a team using LangChain or LangGraph heavily. Run a real graph, inspect node-level input and output, reproduce a failed run, and carry a selected example into an evaluation dataset. It is also usable outside that framework stack; framework integration is a practical advantage to test, not a rule that excludes other applications.
Langfuse is an option for teams that want framework flexibility and a self-hosted deployment. Self-hosting still means operating its application, databases, caches or queues, and object storage according to the supported architecture. Some enterprise capabilities require a license key. “The core is available to self-host” is a different claim from “every feature is free.” Langfuse self-hosting
Braintrust is worth evaluating where experiments, datasets, scoring, and review drive the release process. Phoenix offers a self-hostable tracing and evaluation platform; its Elastic License 2.0 restricts providing a substantial set of its features to third parties as a hosted or managed service. That is different from a permissive MIT license. Check the actual deployment use case against the Phoenix license.
LangSmith self-hosting is an Enterprise add-on, so confirm the commercial boundary before planning a private deployment. LangSmith self-hosted deployment
Cost comparisons need a shared workload definition. One million events, spans, traces, and sessions are not equivalent units. A task may create many spans; repeated evaluation adds model calls; long retention can use a different rate from short retention. LangSmith's distinction between base and extended traces concerns retention, not a rule that an Agent trace automatically costs a multiple because it is more complex. Public plans also change, so a historical dollar figure without its meter and date is a weak basis for procurement.
Use the current Langfuse, LangSmith, and Braintrust pricing pages to build a quote for the same workload: daily tasks, spans per task, retained payload size, retention, seats, evaluation rate, and support requirements. Include evaluator inference charges and self-hosting resources where applicable.
If collection uses a model gateway or proxy, include it in the trial. Measure time to first token, complete-response latency, concurrent requests, retries, and failure behavior under your expected load. A generic per-call overhead figure does not establish how a multi-step Agent will behave.
Infrastructure correlation still depends on shared trace context and service identifiers. An AI-focused product can connect to APM, but a webhook notification by itself does not establish that causal link.
Option 3: extend the APM platform you already use
Datadog, New Relic, and Grafana provide AI-related observability capabilities alongside their wider platforms. For an organization already invested in one of them, adding AI instrumentation can reuse collectors, service ownership, access controls, dashboards, and incident workflows.
Do not dismiss this category as request-only monitoring. Datadog's documented SDK supports session identifiers, and its Agent Observability MCP tools support access from external AI clients. Evaluate current capabilities rather than relying on an older division between “AI-native” and “traditional APM.” Datadog SDK reference and Agent Observability MCP
The harder questions are specific: can developers compare runs on a versioned dataset, inspect a multi-turn failure, annotate disagreements, and apply release criteria in CI? Can operations staff follow the same failure into a database or service? Feature breadth alone does not settle which workflow is faster or cheaper for your team.
Price the incremental AI capability alongside your existing contract. Include retention, evaluation, user access, and any required APM or infrastructure coverage. Do not add unrelated list prices and present the result as a vendor's mandatory bundle. Also verify the service region and payload policy actually available to your account.
This route fits an existing APM customer when AI diagnostics can reuse established operational practices and the product's evaluation workflow is sufficient. A specialized evaluation service can still sit alongside it when that workflow needs more depth.
Option 4: assemble a self-hosted stack
A platform team can combine OpenTelemetry instrumentation, a self-hosted trace backend such as Langfuse, and evaluation tooling such as DeepEval or RAGAS. Phoenix itself is a platform as well as an evaluation ecosystem, so decide which component owns trace storage and which owns datasets and scores.
The engineering work includes schema mapping, session identity, ingestion and retention, access controls, dataset versioning, evaluator scheduling, result storage, alert routing, upgrades, and recovery. Infrastructure telemetry may remain elsewhere and need explicit correlation.
License fees can be low for an eligible configuration, but storage, compute, model inference, and engineering ownership remain. Verify every component's license and edition boundary; “self-hosted” does not imply one uniform open-source license.
This approach fits a team with a dedicated platform owner, requirements that justify backend control, and time to maintain the integration. It is less attractive when the immediate requirement is to make one production Agent diagnosable this week and no one is assigned to run the stack afterward.
Where the operating work ends up
The four approaches move responsibility between the application team, the platform team, and the vendor. That division matters more than a feature count.
| Responsibility | Guance | AI-focused platform | Existing APM extension | Self-hosted combination |
|---|---|---|---|---|
| Session reconstruction | Supported connector/framework supplies the session fields | Framework integration and cross-turn grouping shape the view | Current session support and application instrumentation determine coverage | The team owns the identity model and its presentation |
| Usage and cost attribution | Model/application breakdown depends on reported usage | Billable units and retention differ between products | AI usage adds applicable contract items | Infrastructure, evaluations, and engineering all contribute |
| Service troubleshooting | Shared trace context connects collected operational signals | A link to the existing APM backend needs matching context | Same-platform context can reuse existing instrumentation | Cross-system links must be built and maintained |
| External Agent access | OWL/MCP access has its own permission boundary | API/MCP support varies by product | Available MCP/API tools retain their individual scopes | The team operates the access service and authorization |
| Data location | SaaS site or private deployment, plus external inference paths | Hosted, self-hosted, and enterprise-only options differ | Contracted region and export behavior apply | Storage, networks, backups, and inference paths remain the team's responsibility |
| Evaluation | Prompt Eval, Schema Eval, annotations, and datasets | Experiments, annotation, and judge workflows differ | Development and production workflows depend on the product | Scheduling, calibration, and result integration are owned internally |
A failed task exposes the differences
Consider a task that retrieves evidence, calls a tool, and then invokes a downstream service. A wrong tool selection, an invalid argument, a timeout, and a well-formed but incorrect answer leave different evidence. The tool choice needs the preceding context; the timeout needs timing and service data; the wrong answer needs the returned evidence and an evaluation of its meaning. A single success-rate chart cannot explain all four.
Retries make both diagnosis and cost attribution harder. Keeping the same task identifier connects repeated work, while separate attempt identifiers preserve the sequence. Usage can then be grouped by model, application, and business workload. Cached-input and reasoning usage must follow the provider's accounting rules: reasoning tokens may already be included in billed output. Adding them again inflates the estimate.
Content retention is part of this tradeoff. Capturing less payload reduces exposure and storage, but also removes evidence from later investigations. Access and deletion rules determine who can inspect that evidence and for how long. A platform choice is therefore also a decision about which failures the team will be able to explain after the fact.
Frequently asked questions
How does Agent observability differ from LLM monitoring?
LLM monitoring focuses on individual model calls and aggregate usage. Agent observability adds the task context: tools, retrieval, retries, state changes exposed by the runtime, and activity across turns. Both are needed to explain an Agent failure.
Is self-hosting a reasonable option?
Yes, when a team can own the ingestion, storage, evaluation, and operational lifecycle. Compare the complete service you must deliver, not just software license charges. A managed platform can reduce backend work, while a self-hosted stack can provide control that justifies it.
How do we control token spending?
Attribute usage to tasks and owners, distinguish provider billing categories, and alert on abnormal usage. Enforce loop limits, request budgets, or gateway controls in the execution path when a hard spending boundary is required. Observing a spike does not itself stop it.
What about models and frameworks developed in China?
Verify the precise SDK, model endpoint, and framework version. OpenTelemetry conventions are vendor-neutral, but automatic instrumentation coverage is not universal. For teams operating in China, assess payload location and the actual cross-border data path with the appropriate internal stakeholders. A private telemetry backend does not change where an external model receives prompts.
Can observability prevent hallucinations?
It can make suspected errors easier to evaluate and trace to a task. A judge score is still an imperfect signal and needs labeled examples and human review. Detection also depends on the evaluation schedule; not every failure will generate a real-time alert.
Choose the platform that makes the task diagnosable at an operating cost and ownership level your team can sustain. Validate those conditions with your own workload before committing to a migration.
Contact us
Join the community

to join the community
Try Guance
Start online and pay only for what you use.
Get startedChoose a Guance plan