






Phone:400-882-3320




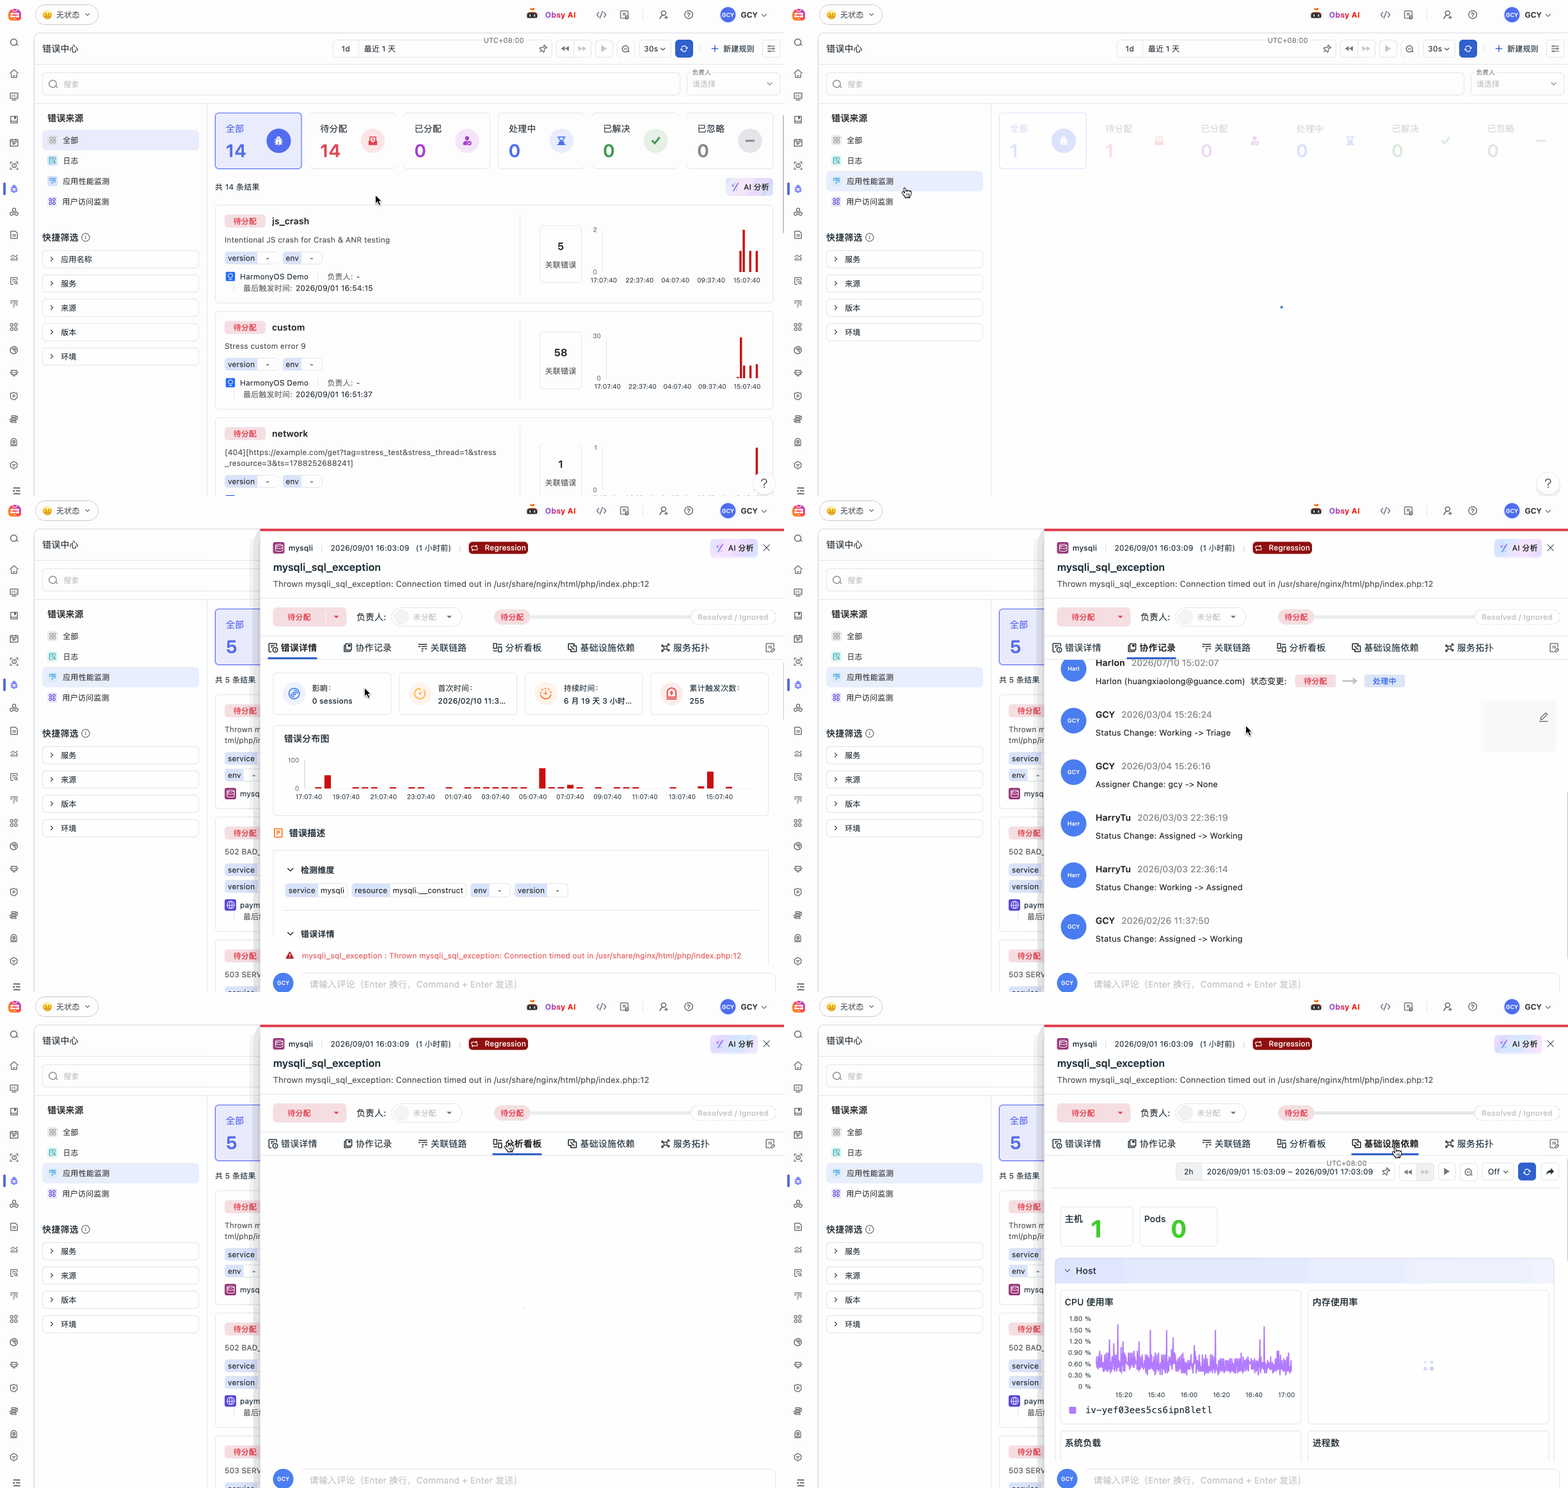
场景
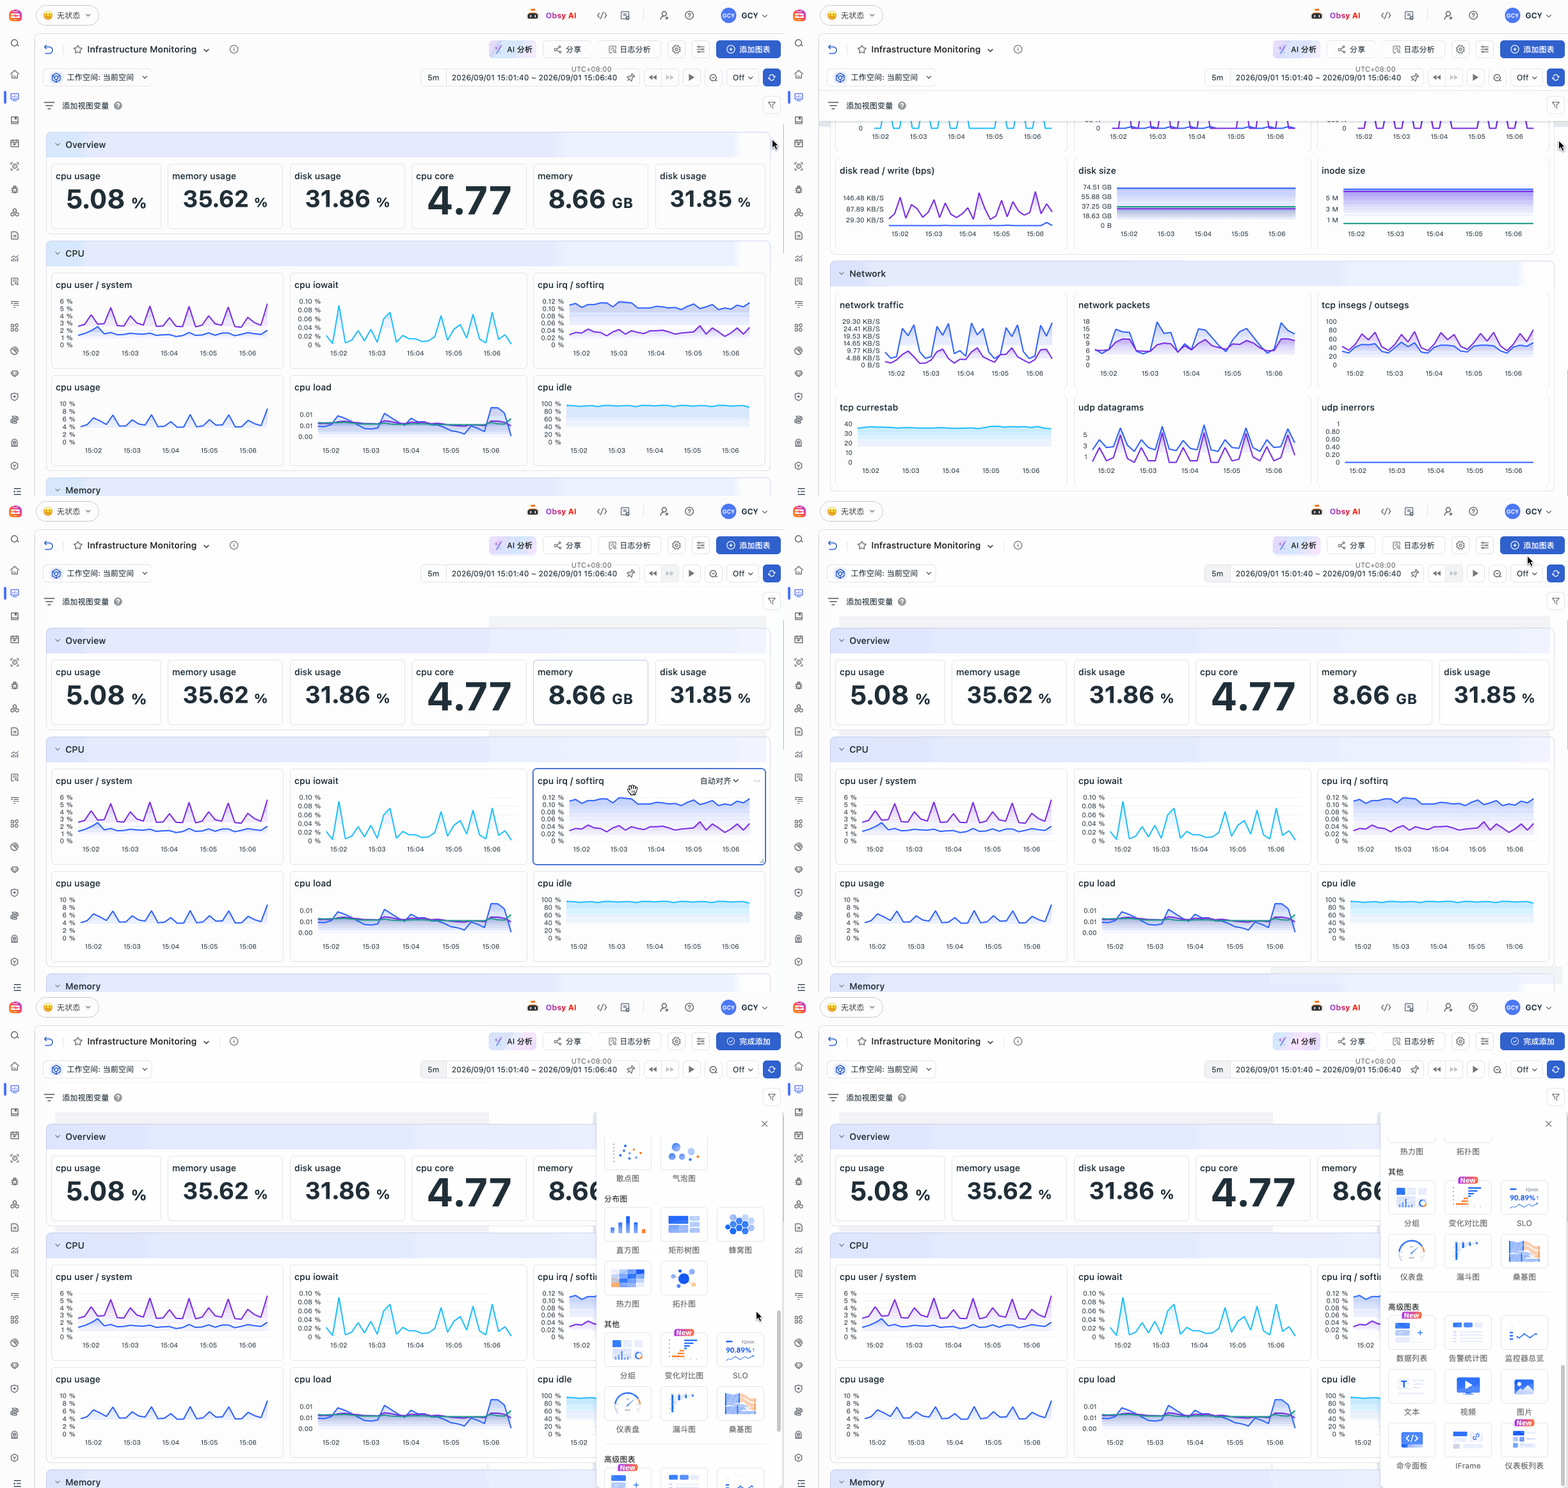
让关键系统状态,在一张实时视图里对齐
把请求量、在线服务、错误率、响应延迟和业务指标放进同一时间窗口,让研发、运维、SRE 与业务团队基于同一份数据判断系统状态。

Intelligent operations

Platform capabilities

Security analytics

AI
Dedicated compute
Dedicated compute keeps concurrent queries stable and complex analysis fast.
Learn moreDedicated compute
Dedicated compute keeps concurrent queries stable and complex analysis fast.
Learn more
Trusted by teams across industries


Collect, store, query, and visualize metrics, logs, traces, RUM, profiles, events, cloud resources, and business data in one workspace.

Switch between real Guance product views to see how teams move from a system symptom to the evidence needed for a decision.Unified observability platform
场景
把请求量、在线服务、错误率、响应延迟和业务指标放进同一时间窗口,让研发、运维、SRE 与业务团队基于同一份数据判断系统状态。
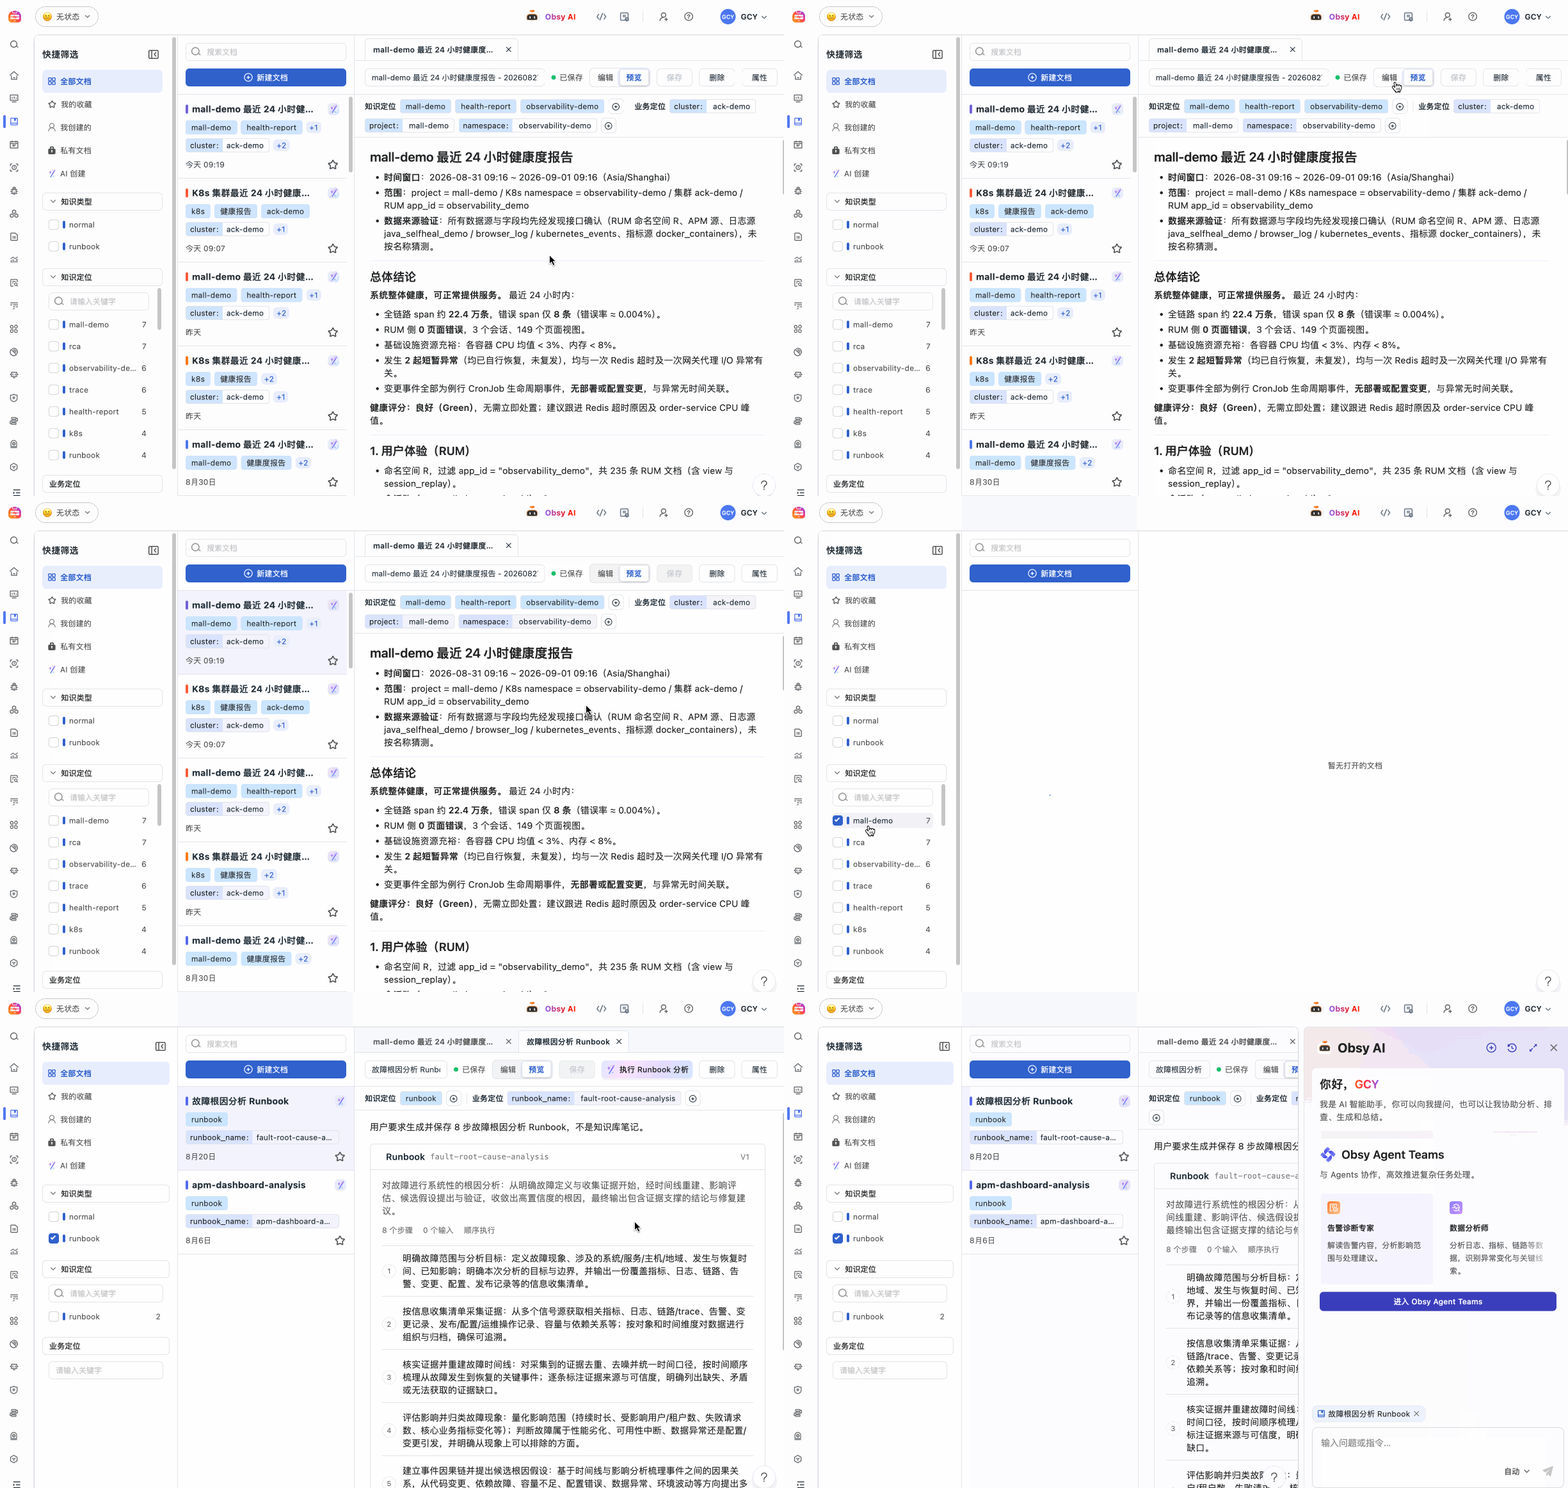
知识库
将健康报告、排障记录与 Runbook 放进统一知识上下文,让团队和 AI 能够沿着真实观测数据复盘、协作并持续积累经验。
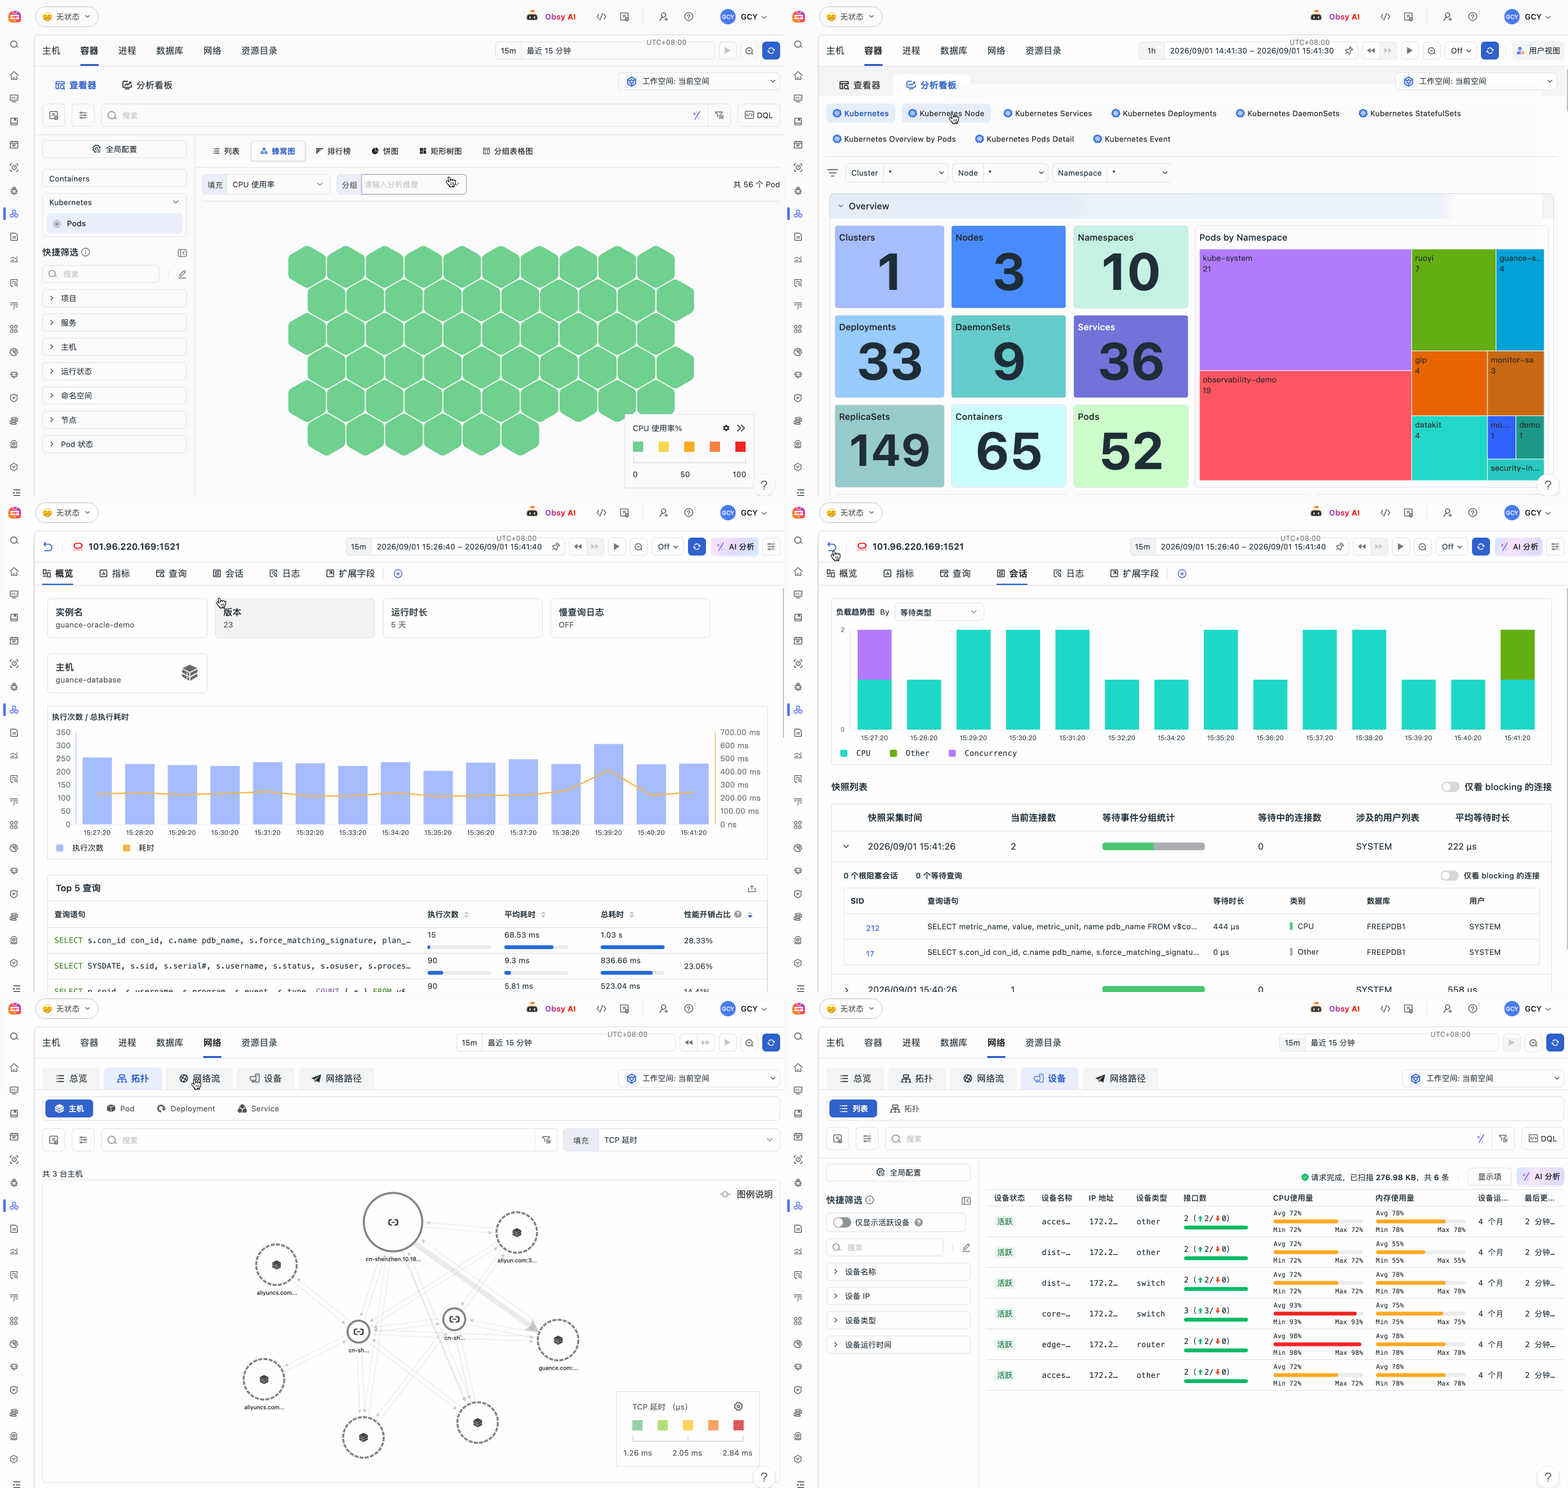
基础设施
统一查看主机、容器、Kubernetes 与云资源状态,从整体健康度进入具体对象,结合容量、负载、事件和日志判断异常影响。
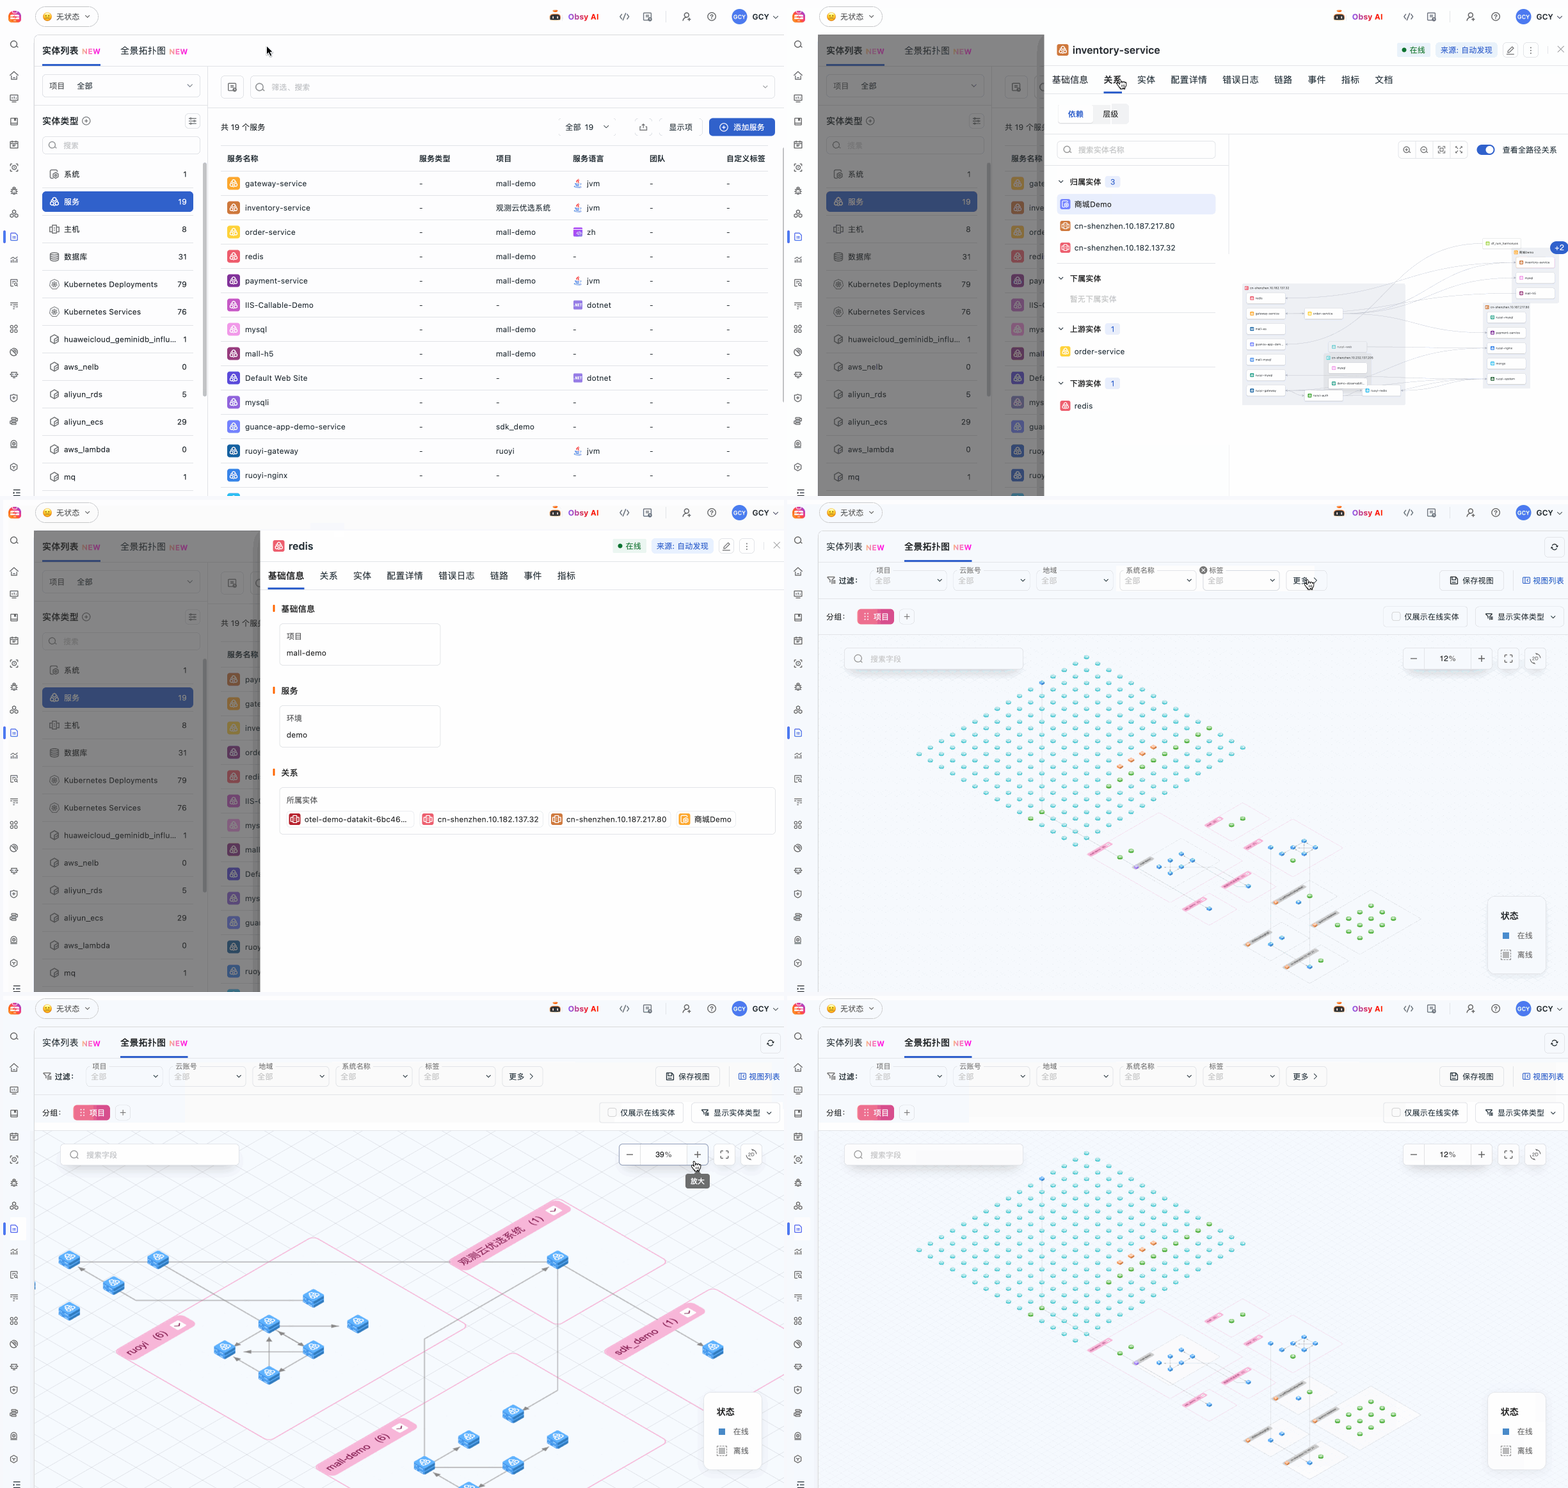
统一目录
把对象、归属、依赖、层级与业务标签放入统一模型,让团队更快理解系统里有什么、归谁负责,以及彼此如何关联。
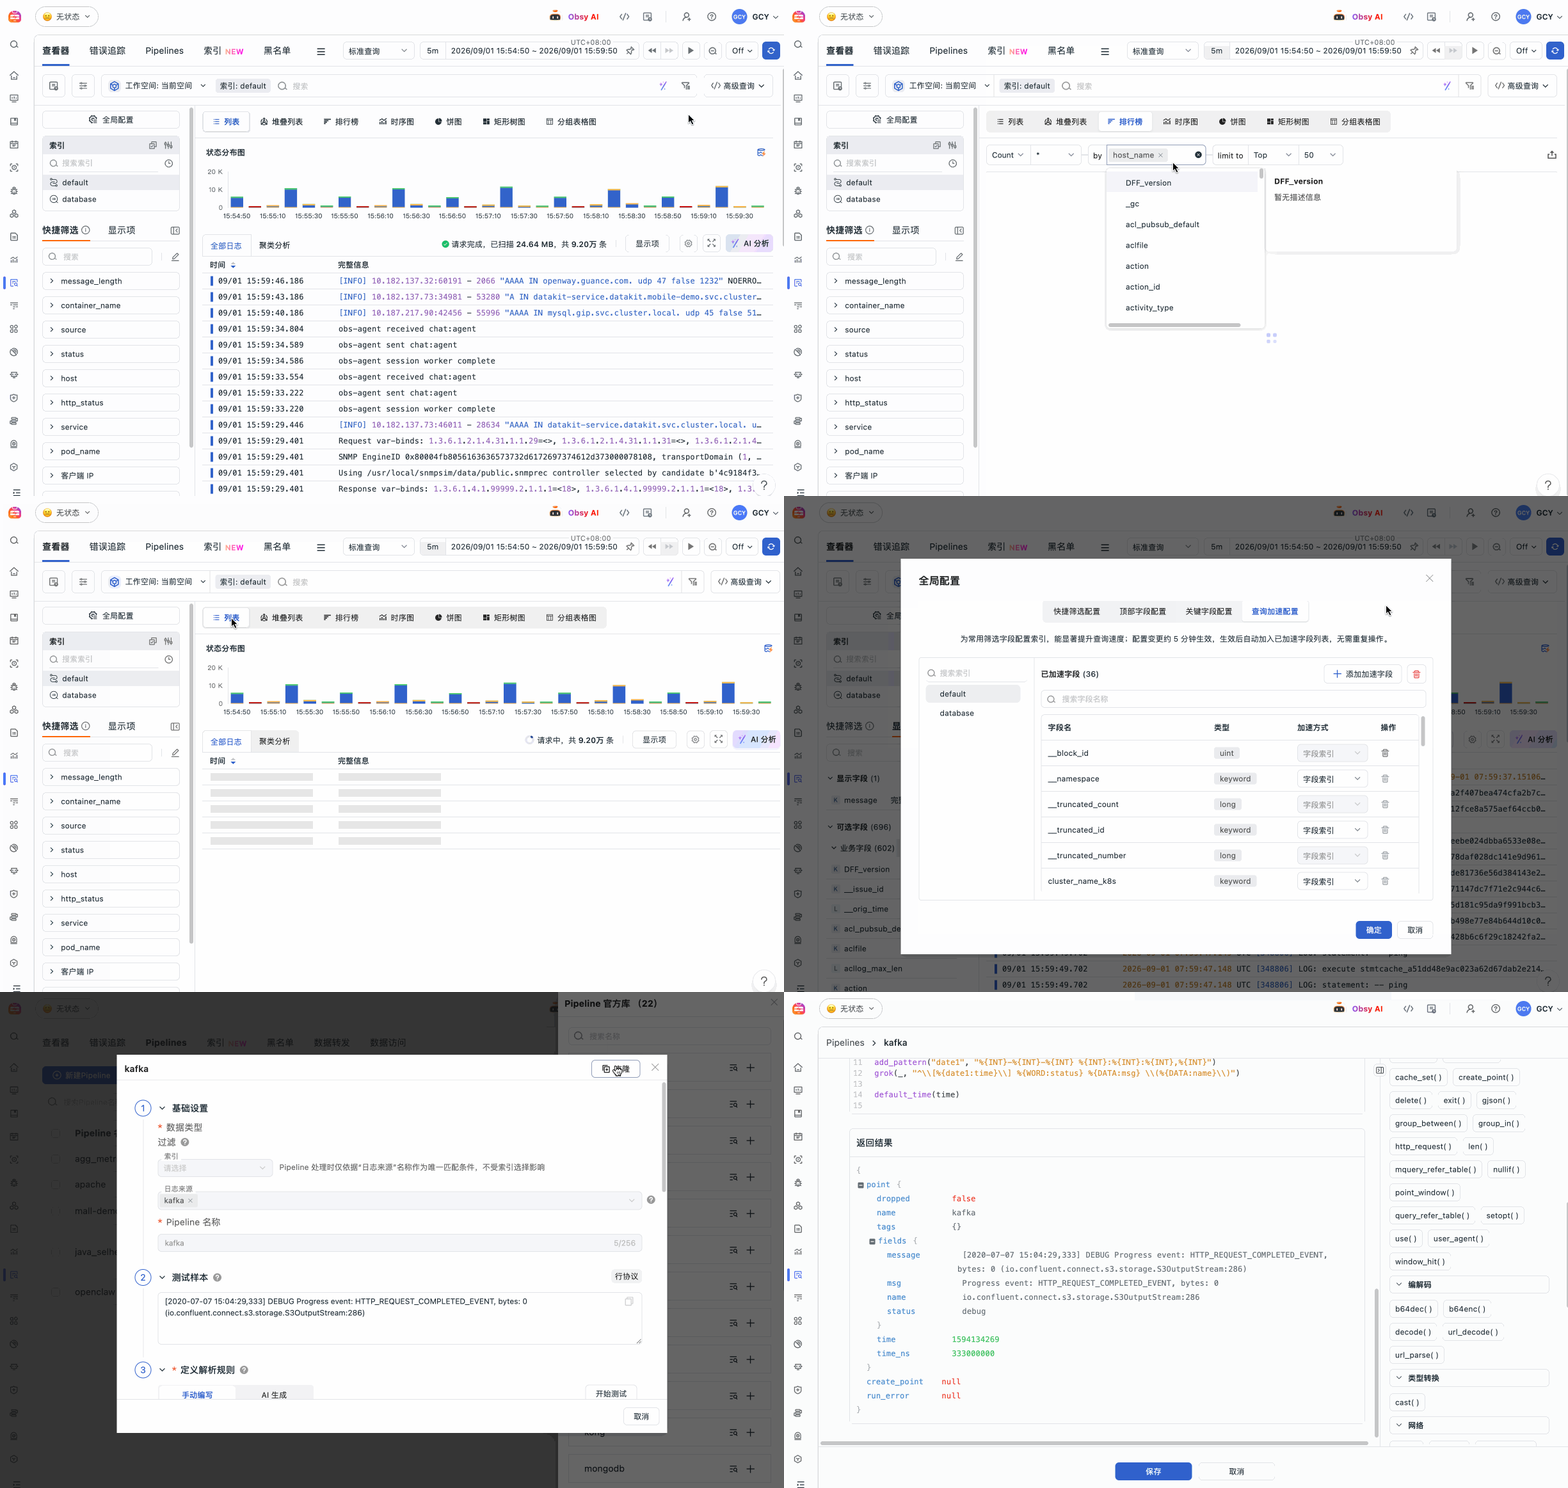
日志
集中采集、解析与检索应用、主机、容器和云平台日志,并将字段、趋势、Trace 与资源信息放回同一次排障过程。
应用性能监测
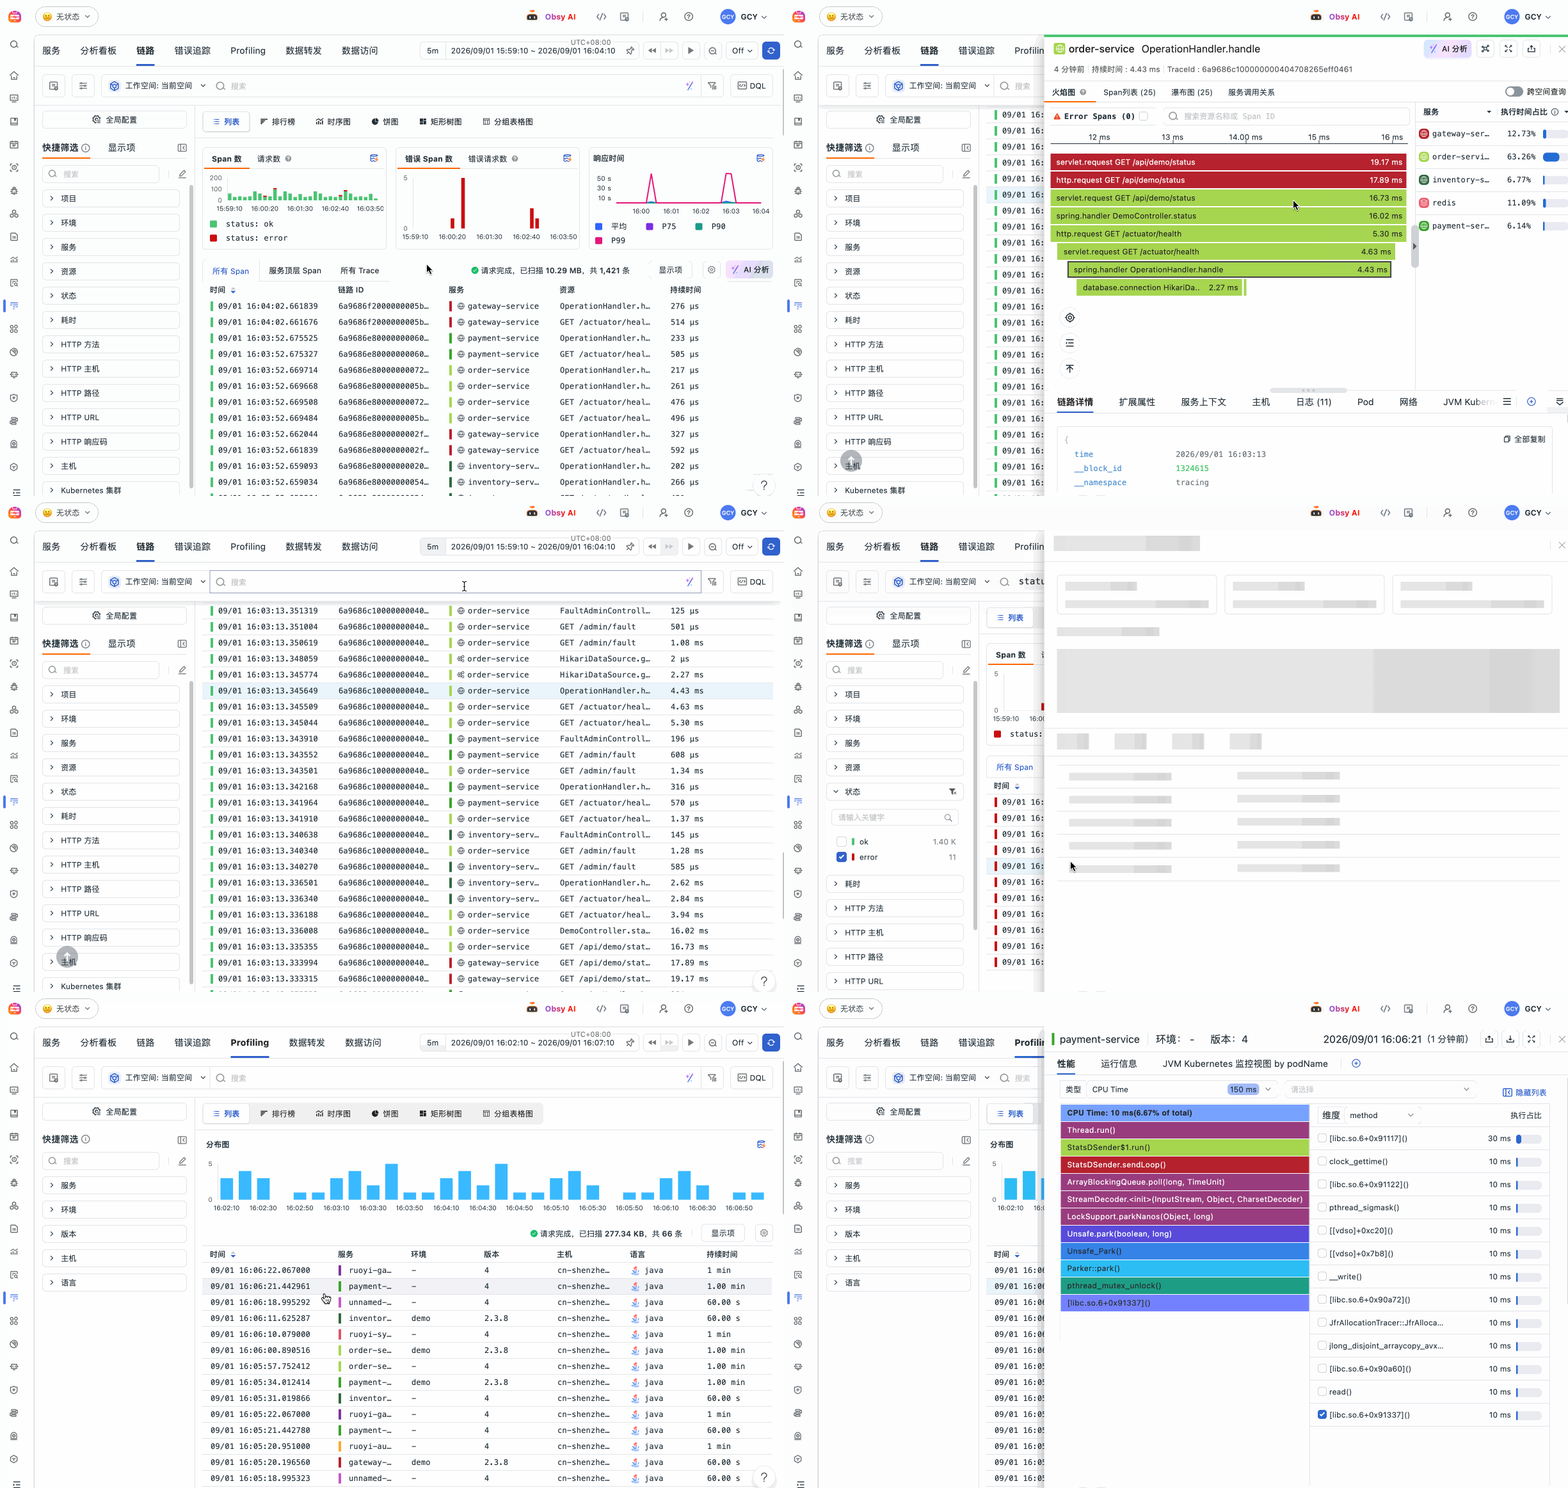
在统一时间窗口中观察请求量、响应时间、错误与慢调用,确认异常后继续进入 Trace、服务依赖、日志与 Profile 定位根因。
用户访问监测
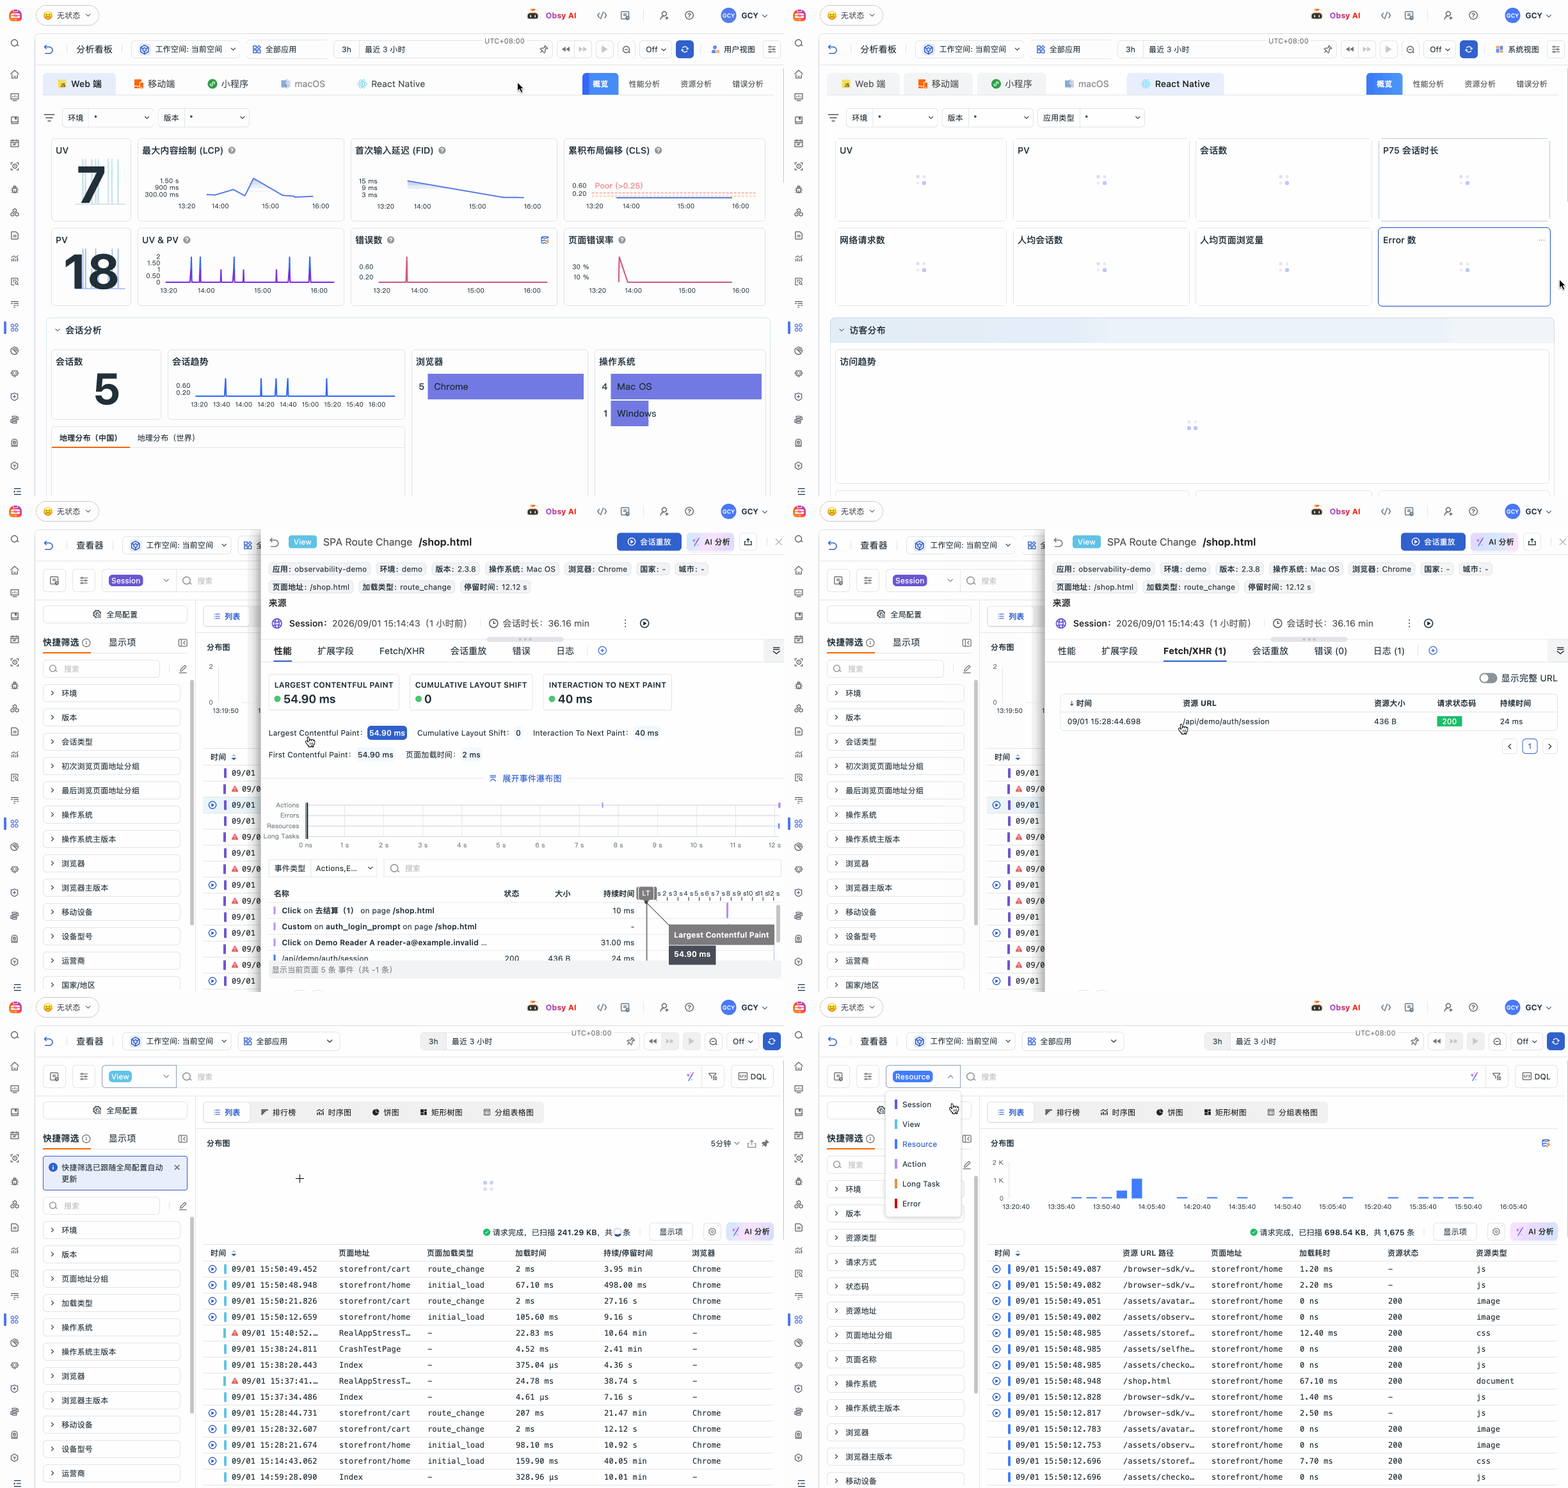
持续观察 Web、移动端和小程序的页面性能、错误、资源请求与会话体验,再关联后端 Trace 判断问题来自前端、网络还是服务端。
可用性监测
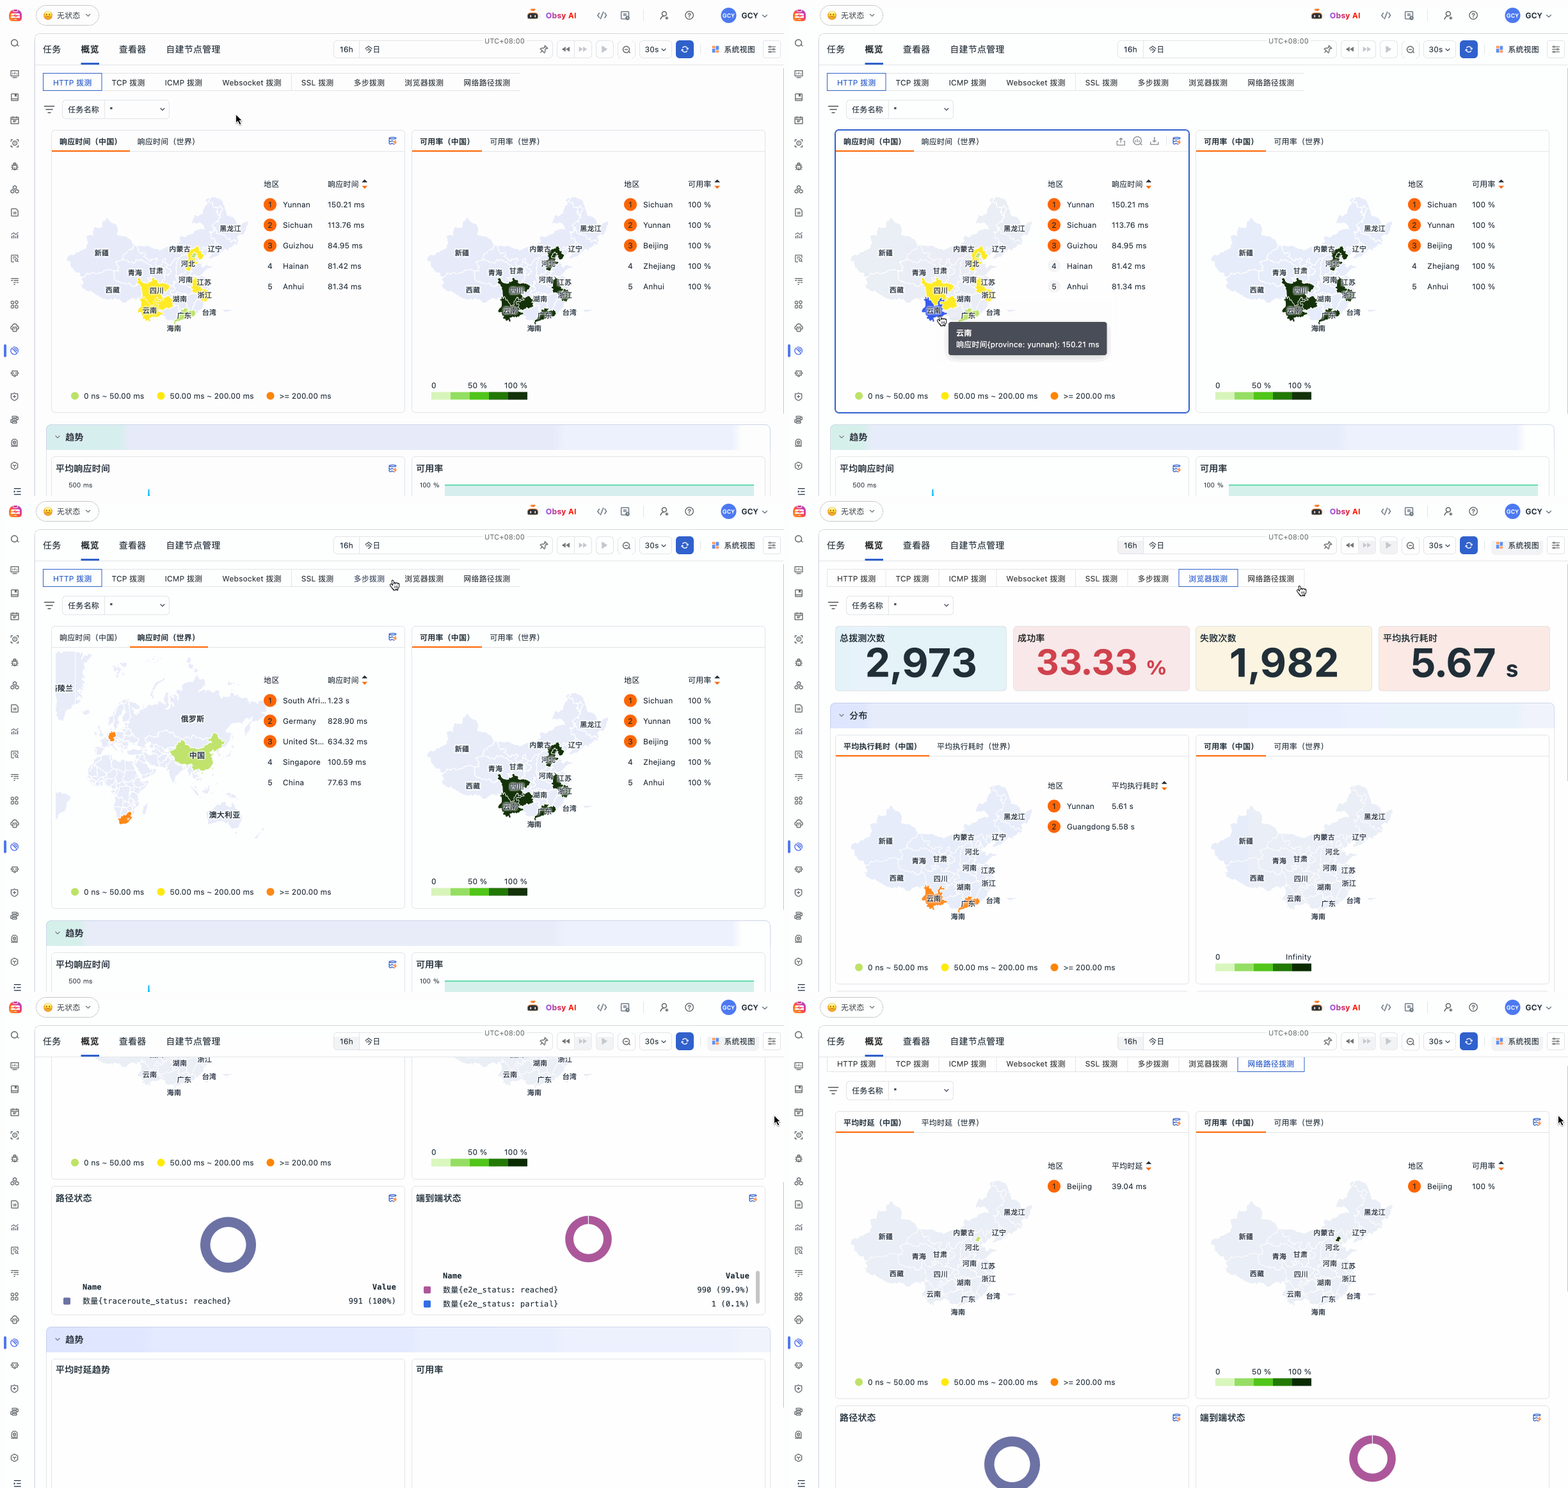
通过 HTTP、TCP、DNS、SSL、ICMP 与 WebSocket 等拨测,从外部访问视角持续验证接口、网站与关键服务是否可达。
Agent 监测
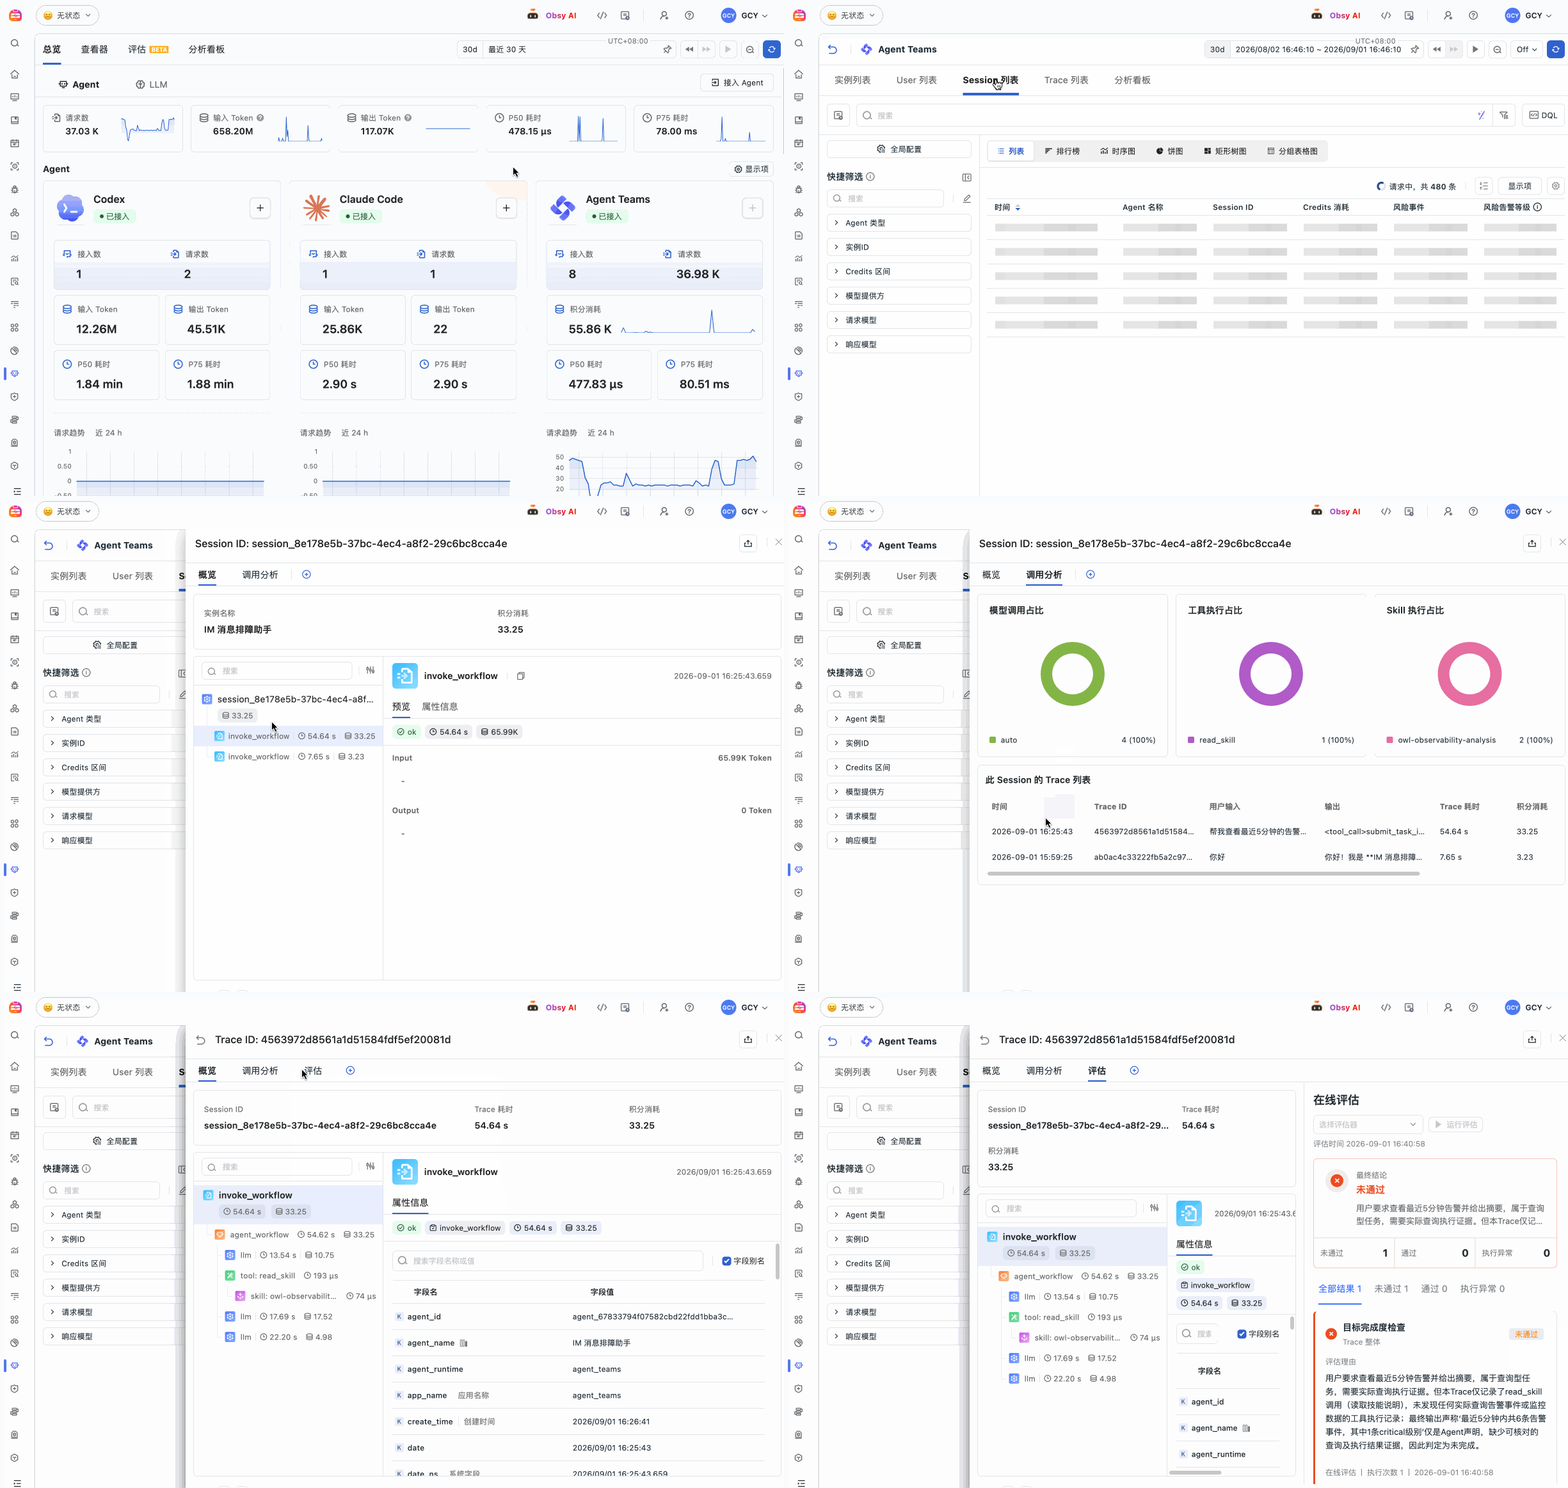
统一追踪 AI Agent 与 LLM 应用的请求、会话、模型、工具调用、Token 消耗和响应质量,让新型智能应用也拥有可排查的运行上下文。
安全监测
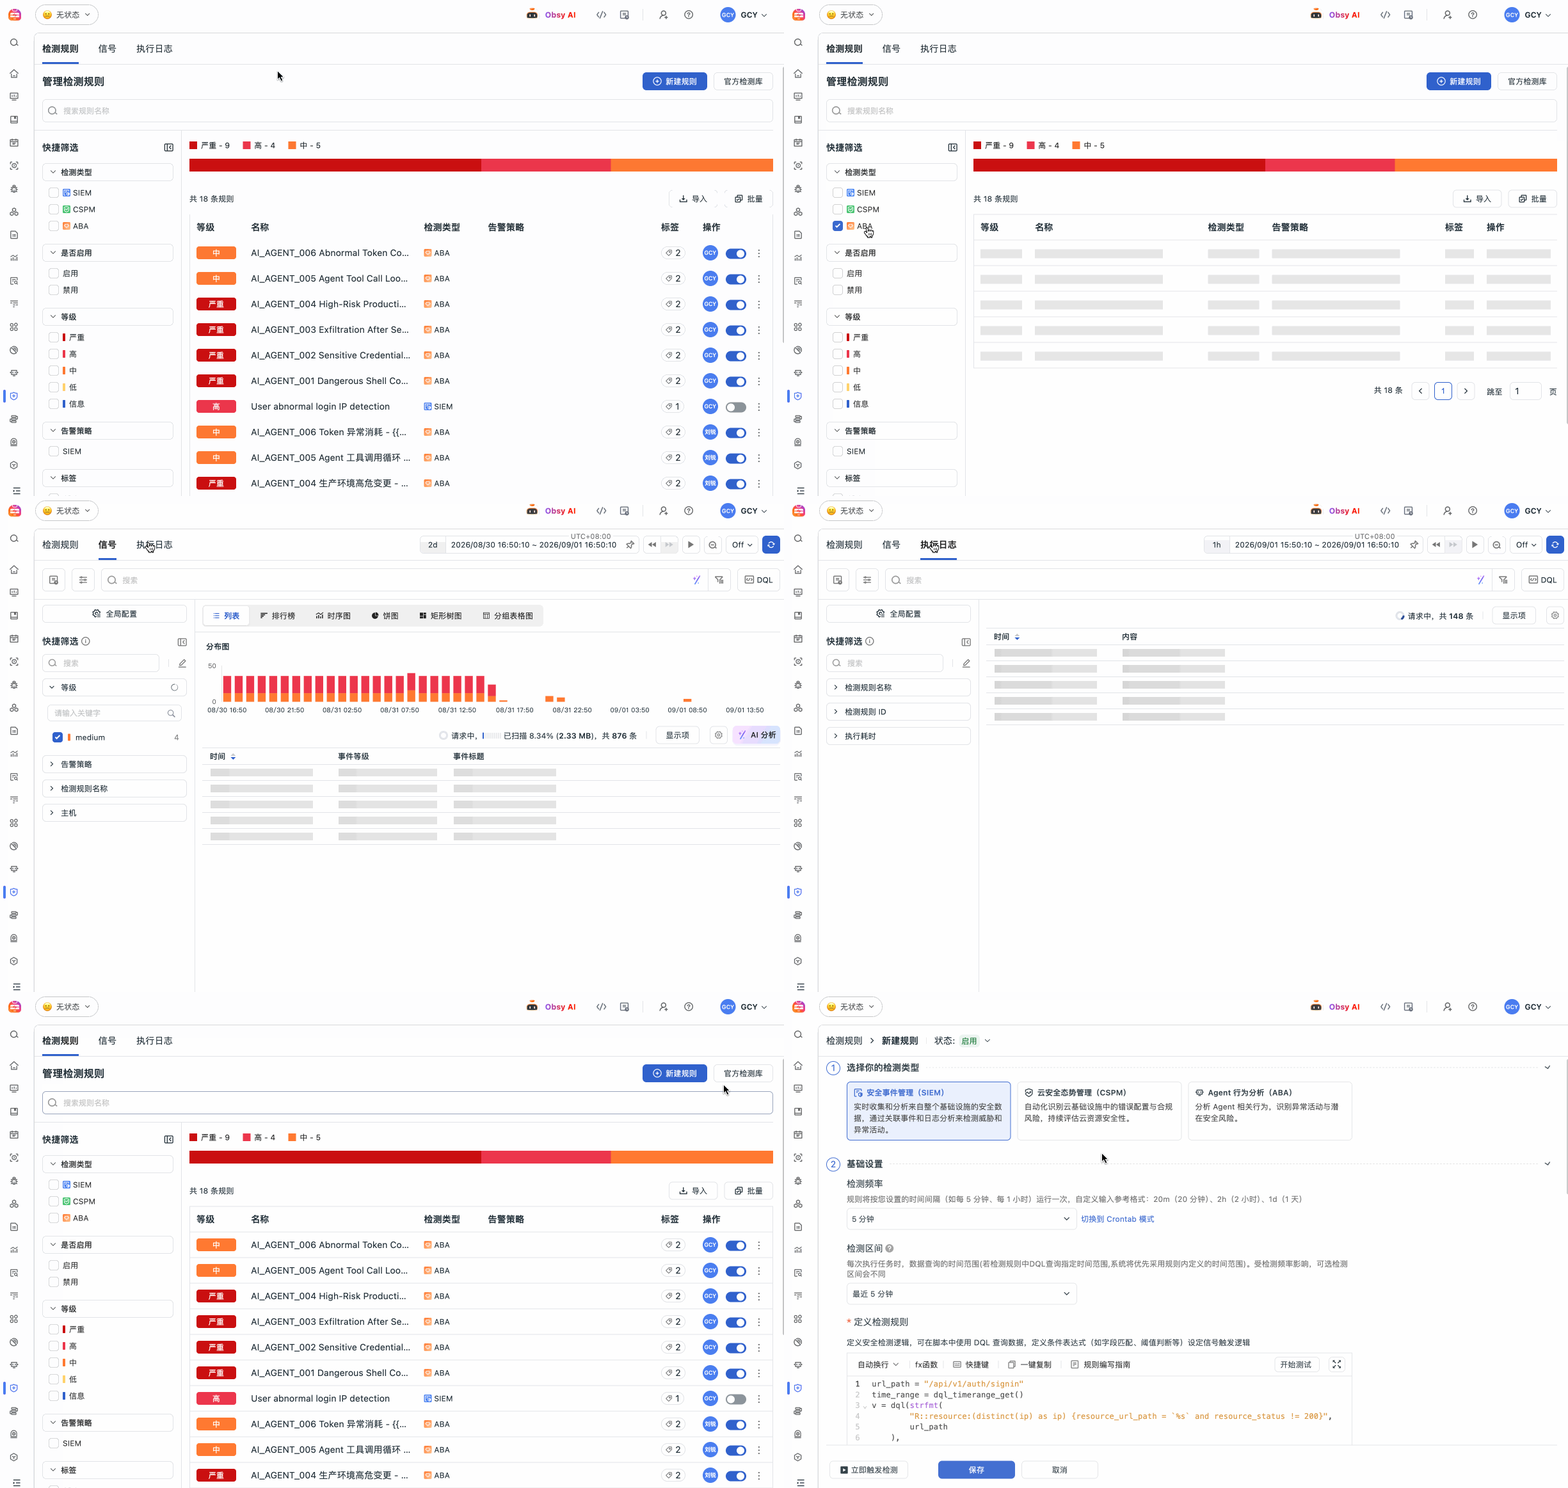
将安全日志、审计事件与检测规则集中管理,持续识别异常登录、敏感操作、危险变更和潜在攻击,并接入统一响应流程。
CI 可视化
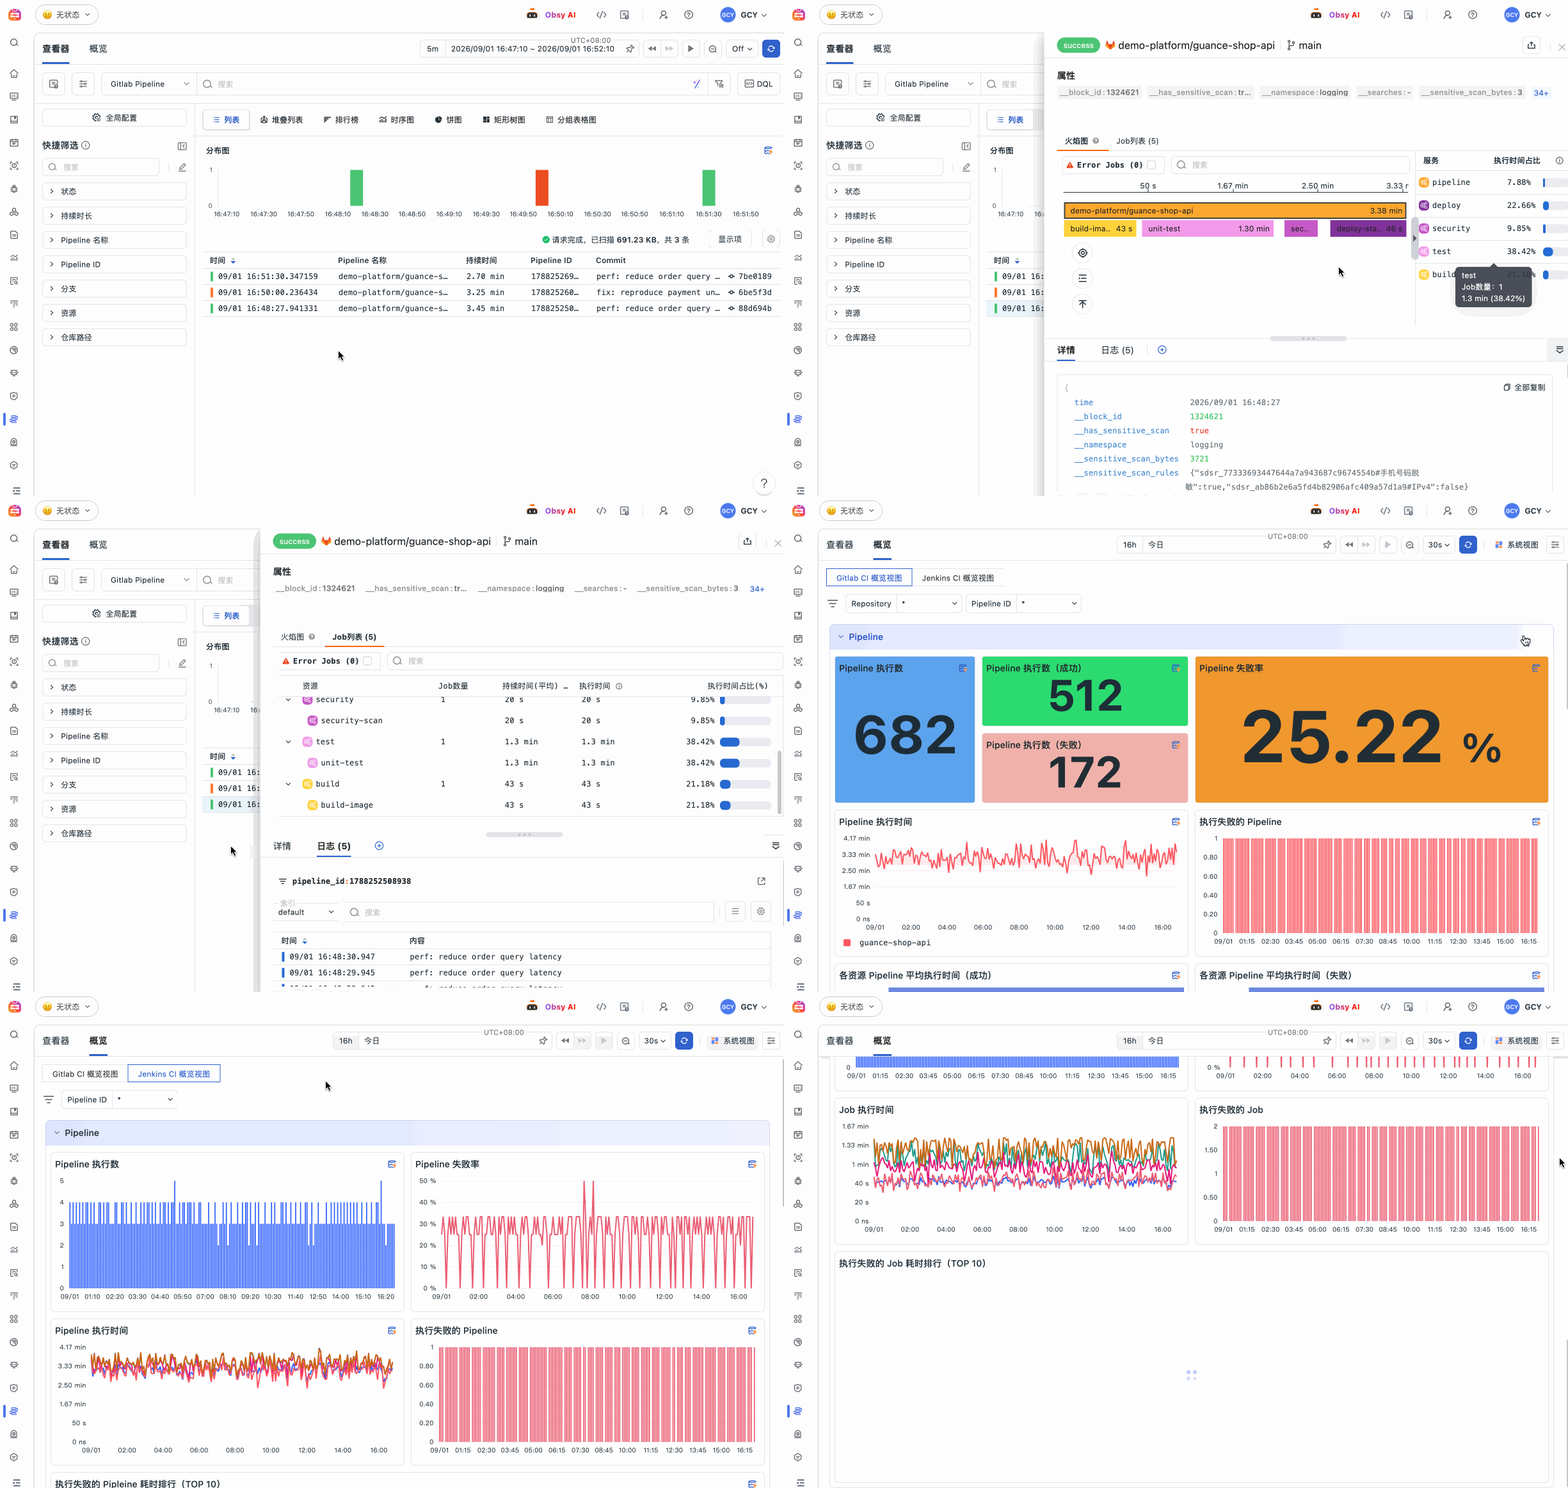
持续观察构建、测试与部署流水线的执行状态、持续时间、分支和提交信息,快速发现影响交付效率的失败步骤与性能回退。
监控告警
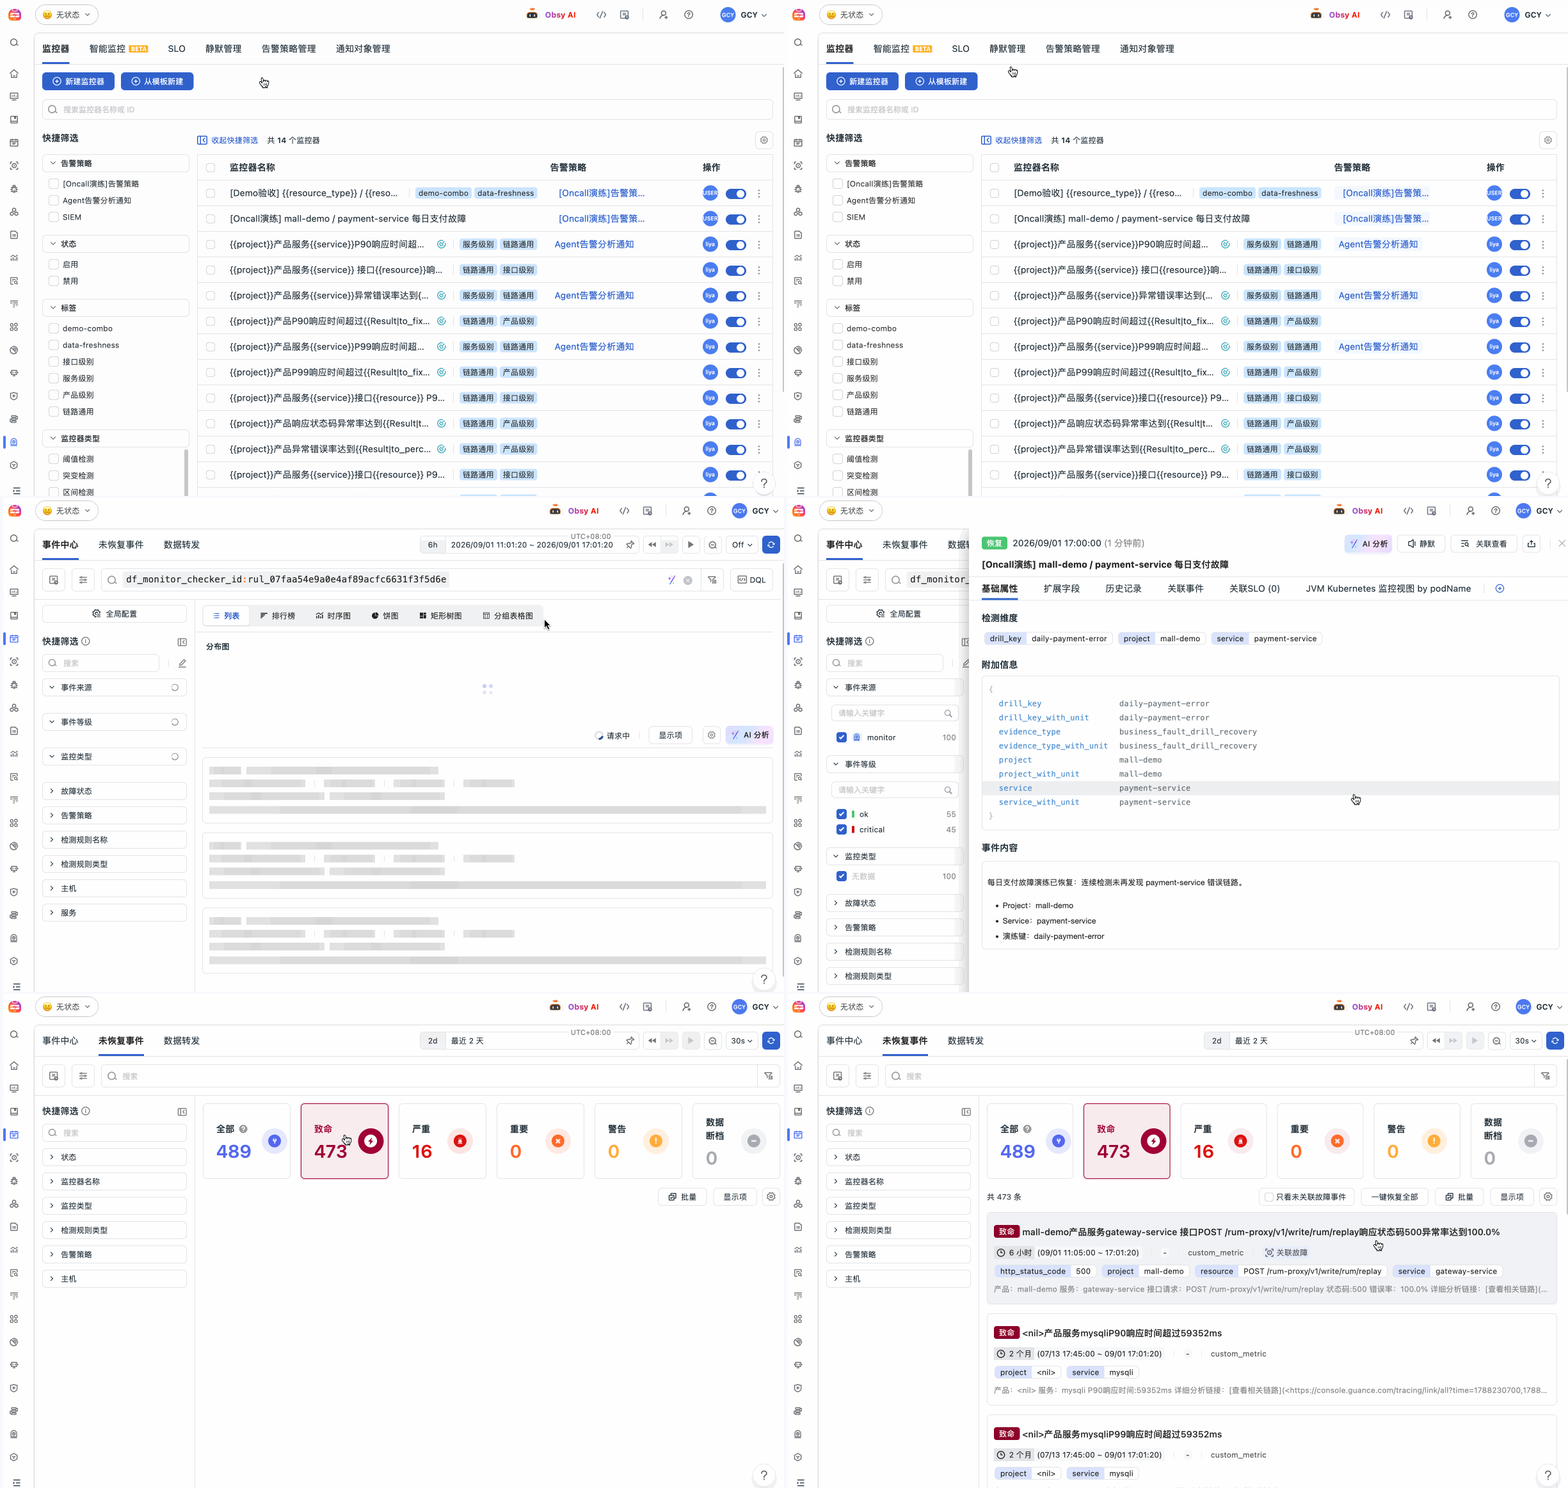
围绕指标、日志、链路、RUM、SLO 与业务数据配置检测规则、分级告警和通知策略,让重要问题及时触达正确的人。
故障中心
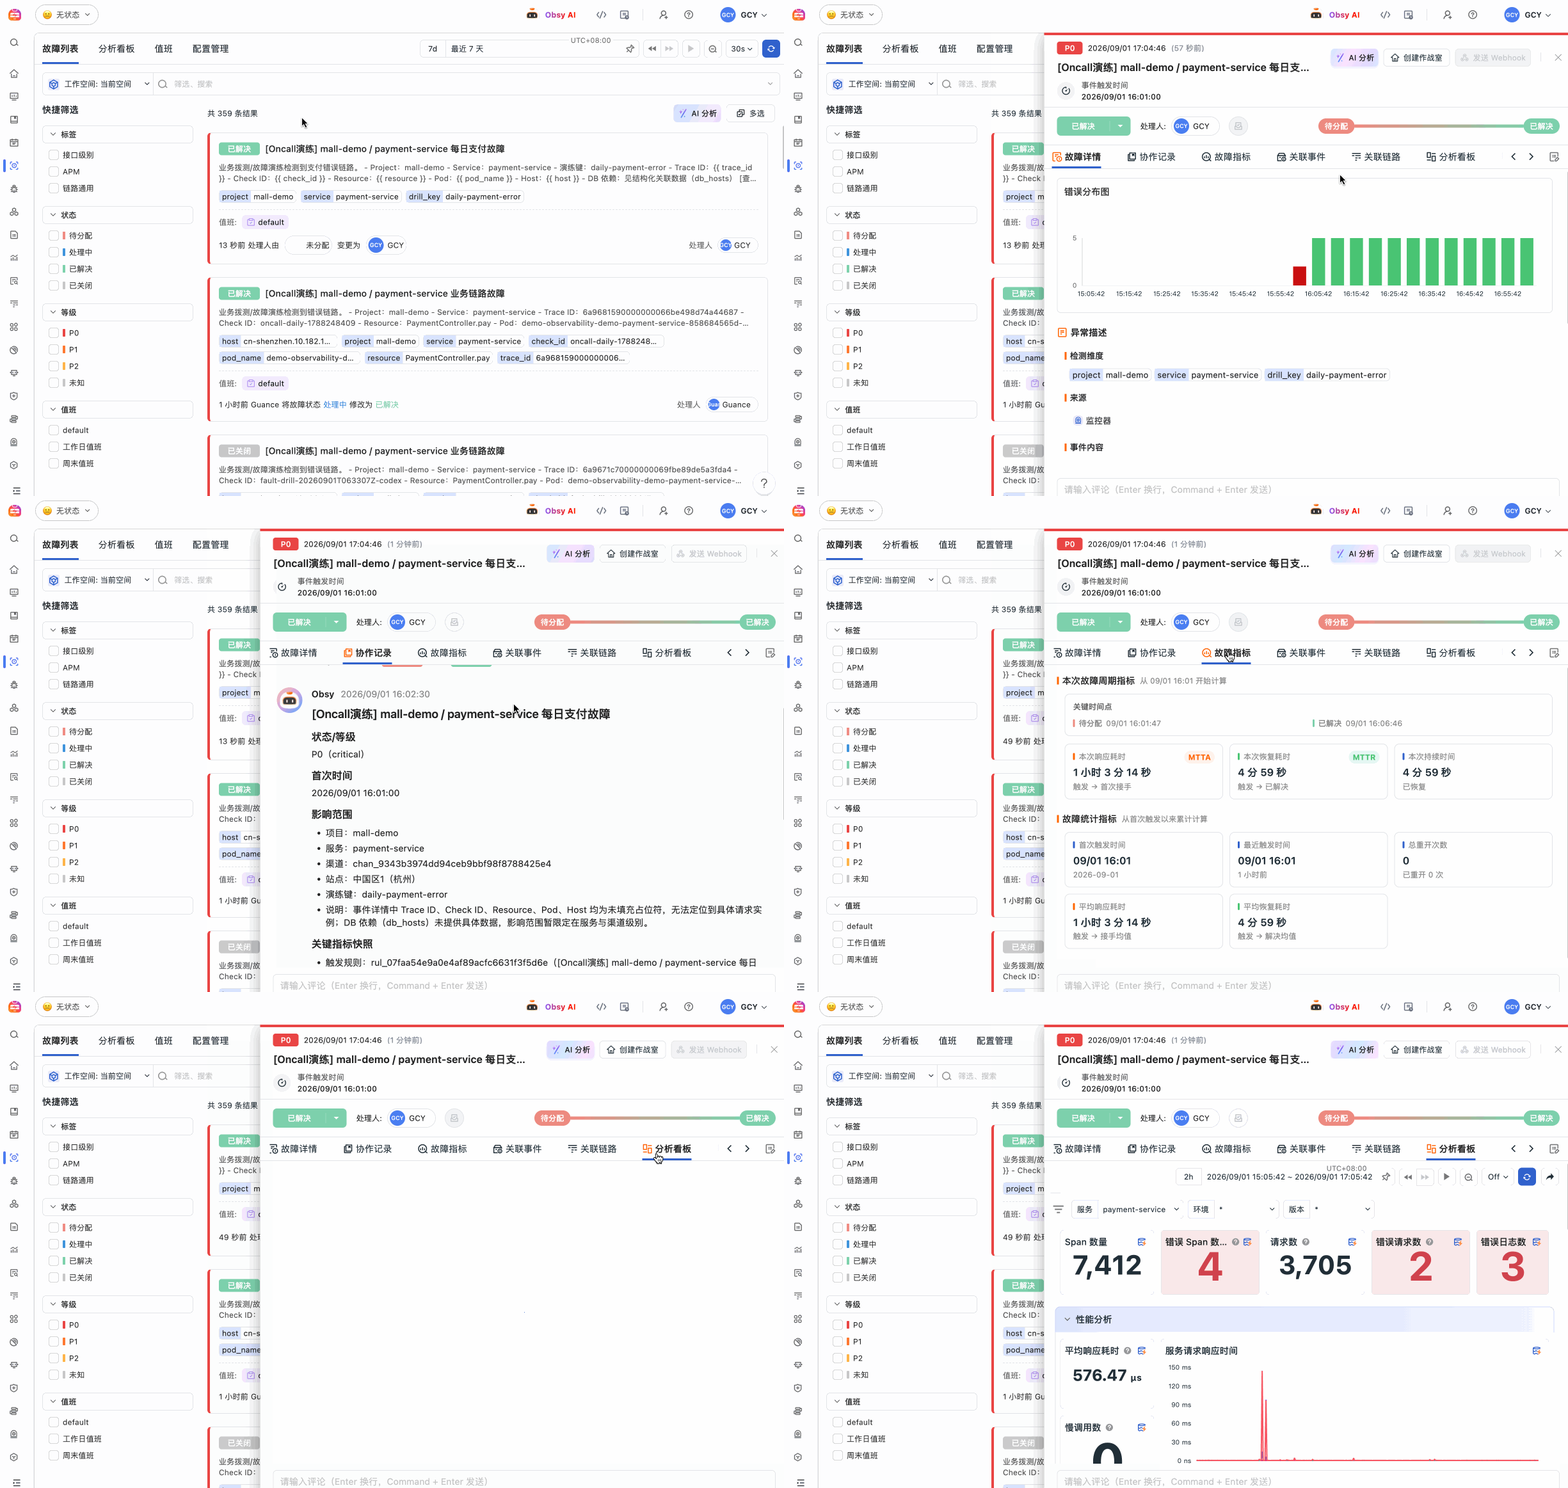
把告警、负责人、处理记录、关联证据和恢复状态聚合到同一故障上下文,帮助团队形成从发现到复盘的响应闭环。
错误中心
将日志、应用性能与真实用户访问中的错误集中归并,按来源、版本、环境和服务快速筛选,并持续跟踪分配与解决状态。
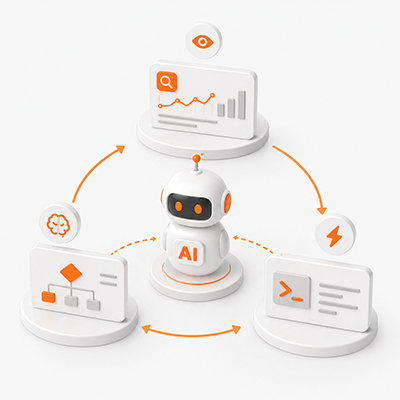
From observation to action, driven by AI
Your Agent team works around the clock to turn signals into decisions and controlled actions.
Improve reliability across your systems

Global reach
Observe systems, applications, and digital experience across regions through Guance service nodes.

Open integrations
Connect applications, databases, infrastructure, and public clouds without isolating data by environment.

One platform
Unify metrics, traces, logs, profiles, RUM, infrastructure, application, and availability data in shared dashboards and workflows.

Usage-based pricing
Pay according to actual usage with daily settlement; current allowances and rates are listed on the pricing page.
Guance supports global service access and multi-region observability workflows for teams running digital services across Southeast Asia and beyond.
10 +
global service nodes
60 +
countries and regions served with low-latency access
 Download the white paper