


Choosing application performance monitoring tools
Compare APM tools through instrumentation, sampling, retained spans, log and RUM correlation, and the backend work and billing each route leaves to the team.
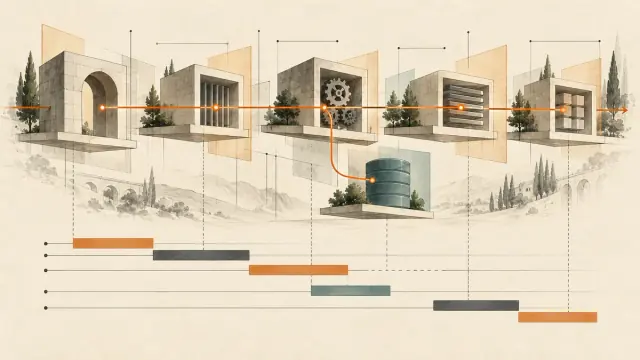
A slow request may spend its time in application code, a downstream dependency, or an overloaded host. An application performance monitoring (APM) platform should help an engineer distinguish those cases. A service map and a list of slow requests are useful starting points, but the decision turns on what the engineer can investigate next.
When choosing application performance monitoring tools, I would follow that investigation through instrumentation, sampling, retention and related signals. Keep an existing SkyWalking, Jaeger or cloud service where it already answers the question. A replacement earns its place by supplying missing context or taking over backend work the team no longer wants to run.
Guance Editorial Team · 28 October 2026. This article compares documented mechanisms and operational responsibilities. Guance is one of the options discussed; no common-workload benchmark or customer cost test was performed.
Find where the missing span disappeared
Distributed tracing records instrumented operations as spans and connects them into request paths. A trace is complete only to the extent that instrumentation, context propagation, sampling, and delivery preserve those operations. It does not automatically include every service a request touched.
APM adds service-level analysis such as request rate, errors, latency, and dependency views. Broader observability connects that application view to logs, infrastructure metrics, and real user monitoring (RUM). These are related capabilities, not interchangeable definitions. A team can operate tracing independently, but it should account for the effort of connecting it to other diagnostic tools.
The APM definition covers the broader concept. Here, the issue is which records an investigation needs. The caller must inject context, the gateway must preserve it and the receiving service must extract it. Queues and thread changes need applicable instrumentation or explicit propagation too. W3C Trace Context's traceparent carries the trace ID and parent span information. Giving two services the same service.name cannot substitute for that causal link. OpenTelemetry context propagation
Automatic instrumentation can cover supported libraries and runtimes without hand-writing each operation. Business-specific steps may still need custom spans or attributes. eBPF coverage depends on the actual kernel, protocol and implementation; seeing a network connection does not explain why a payment operation retried three times. Profiling supplies another kind of evidence about code execution, with its own runtime support and collection requirements. Sending an incomplete trace elsewhere does not restore an operation that was never recorded.
Sampling changes the evidence and where costs fall
Head sampling makes an early decision with relatively little state, before it knows how the whole request will finish. Tail sampling can consider received spans, including errors, duration or attributes. It also has to receive data and retain enough state to make that decision. The OpenTelemetry Collector's tail sampling processor requires spans belonging to a trace to reach the same sampling instance; distributing them arbitrarily across replicas changes the evidence available to each decision. Sampling concepts, Collector tail sampling
Suppose traffic stays at 100 requests per second, each request creates exactly 20 spans, and a consistent probability decision retains 10% of whole traces. Ignoring retries, delivery loss and late arrival:
Before sampling: 100 × 20 × 86,400 = 172,800,000 spans/day
Expected after sampling: 172,800,000 × 10% = 17,280,000 spans/day
This is steady-state arithmetic, not a production measurement or billing test. Span size depends on attributes and events, so a count does not give an ingestion-GB figure. Peak capacity remains a separate requirement. If an application first discards 90%, a downstream tail sampler can only choose among what arrives; it cannot guarantee that every error survives. Sending everything to a remote sampler preserves the earlier transmission and receiving costs.
Keep the metric denominator in view as well. Request metrics calculated by an SDK or Agent before sampling can describe a different population from metrics derived from sampled spans. A lower reported error count after migration may reflect the collection path. Datadog's OTel compatibility documentation distinguishes the sources of trace metrics across setups; a full-traffic guarantee for one Agent path cannot be generalized to every OTLP route. Datadog OTel compatibility
Keep instrumentation where it works, then follow the backend path
Guance offers application tracing alongside other telemetry. DataKit's OpenTelemetry integration provides a documented ingestion route, allowing teams to evaluate a backend without first replacing all application instrumentation. Compatibility still needs to be checked for the actual SDK, protocol, attributes, and required features. Guance OpenTelemetry integration
DataKit also documents separate SkyWalking, Jaeger, and Zipkin collection paths. These can help preserve existing instrumentation, but verify the supported wire protocol and version. Receiving spans does not migrate saved queries, sampling policies, or every feature of the original backend.
A transport detail makes that compatibility work concrete. DataKit's default gRPC listener is 127.0.0.1:4317, while its default HTTP/Protobuf trace path is :9529/otel/v1/traces. Match the application's protocol and endpoint to the actual listener configuration. Java Agent 2.x defaults to HTTP/Protobuf, so an address configured only for gRPC is not interchangeable.
Evaluate these as individual products. Their feature packages, instrumentation options, and billing structures are not identical. A feature demonstrated with a vendor Agent may not behave identically with an OpenTelemetry-only path. Compare the exact requirements for profiling, service discovery, application security, and trace retention.
Datadog documents vendor SDK, OTel SDK, Collector and direct OTLP setups. New Relic provides a native OTLP endpoint, while Dynatrace distinguishes Full-Stack monitoring from standalone telemetry capabilities. These services do not require all data to originate in their own tracers. The portable part is the collection path; backend features and operating responsibilities still differ.
| Route | Foundation that can remain | Work still to arrange |
|---|---|---|
| Commercial managed APM | Supported OTel or vendor collection | Feature tier, attributes, retention and connected signals |
| Guance SaaS | DataKit's supported instrumentation paths | Protocol/version compatibility, sampling, queries and business context |
| Self-hosted tracing/APM | The selected product's collection and analysis capabilities | Production storage, capacity, upgrades, recovery and on-call operation |
| Cloud-provider services | Existing resource identity and supported collection | Propagation, access and investigation of external dependencies |
Related records must describe the same operation
Trace details provide related investigation views. Shared trace identifiers, service attributes, collected infrastructure data, and compatible retention make those views useful. A missing or expired trace cannot be reconstructed from a log's trace_id. Similarly, RUM-to-trace navigation requires the relevant browser and backend instrumentation. Guance trace details
Guance's log-index mapping also uses fields such as service, env and version; resource views need the relevant host, container or Pod identifiers. With those business configurations in place, a managed platform can supply the query and analysis paths without another backend-building project.
If logs are kept for 30 days and traces for seven, a log on day eight can contain a trace ID whose trace is gone. These are illustrative policies, not product defaults. Signals regularly investigated together should cover the required window. Permissions and index selection can also turn a valid link into an empty result.
The browser adds another propagation boundary. Guance's Web SDK uses allowedTracingUrls to choose requests receiving trace headers and traceType to select the format. The backend must continue that context, and cross-origin APIs must allow the relevant headers. RUM session sampling and backend trace sampling separately affect which records exist. allowTraceHeaderWithoutSession can continue header injection without a sampled regular session, but it does not create missing RUM session records. Web SDK tracing configuration
Service naming, context propagation and business fields remain application work. The managed service takes on backend operation and its documented analysis features. AI can help read the evidence that exists; an absent or expired span is still absent, and an explanation should remain traceable to records.
Decide which backend work should remain with the team
Self-hosting provides control over backend configuration and deployment, with an obligation to run it. The products also differ in scope. SkyWalking describes an APM system with multiple observability capabilities; it should not be treated as a trace database with every other feature missing. Tempo is a tracing backend commonly used with Grafana and other signals. SkyWalking architecture and Tempo introduction
Choose storage according to the tracing backend. Thanos and Cortex are metrics systems, not general-purpose long-term storage for Jaeger or Tempo traces. Separately plan the metrics, logs, alert evaluation, and visualization components your workload needs. Some capabilities are already supplied by the chosen platform; others require configuration or integration.
An open-source license can remove a software subscription without removing compute, retained data, backup, support, upgrade, or on-call work. Estimate those costs from the proposed deployment and the team's capacity. A mature platform team can have a very different incremental cost from an application team starting a new backend project.
This route fits teams that need control and can own recovery as well as installation. A successful small deployment is not evidence that its query capacity or operational staffing will support the production workload.
Cloud-provider services can remain useful too. Alibaba Cloud application monitoring, AWS X-Ray and CloudWatch, and Azure Application Insights each have their own supported runtimes and collection paths. Azure documents an OpenTelemetry distribution. Cross-cloud continuity depends on propagation, identity, network access and the applicable integration, rather than the provider's name.
AWS recommends moving X-Ray SDK and daemon instrumentation toward OpenTelemetry. That changes the collection components' maintenance; it does not mean the X-Ray service has stopped. AWS support timeline
Data location follows the selected deployment. SaaS sites, private deployment, remote access and external processing create actual data flows. Vendor nationality does not establish what those flows or contracts permit.
Price the retained data and the service the team must run
The price comparison needs the same care. Datadog publishes distinct APM offerings and related products. Dynatrace publishes usage units across its platform capabilities. New Relic offers pricing options whose data and user or compute components depend on the selected arrangement. Use the current Datadog, Dynatrace, and New Relic rate information to build a quote for one workload, including commitments and overages.
For a host-based Datadog APM plan, host usage, ingested GB and indexed spans are different billing inputs. Dynatrace Full-Stack currently uses memory-GiB-hours. New Relic distinguishes data-plus-user arrangements from eligible Full Consumption options, with additional compute features affecting the total. These meters should describe the same retained signals and investigation coverage before they are compared.
For autoscaling Kubernetes workloads, identify exactly what is counted and when: a host, container, unit of memory, amount ingested, retained span, or user entitlement can produce different growth curves. Include logs and RUM only where those features are required, and include them consistently across candidates.
Grafana Cloud's raw trace service and Application Observability also need to be distinguished. Application Observability adds host-hours and its associated telemetry terms; Tempo ingestion volume alone is not a complete estimate. For Elastic, separate Serverless, Hosted and self-managed deployments. The intake and processing path also determines whether the expected APM views have the data they need. Grafana application billing, Elastic OTel architecture
Guance Enterprise meters compressed write bytes and the original traffic involved in processing, alongside storage, tasks and selected compute. Span count helps describe collection scale; it is not the only unit on that bill. Commercial, Enterprise and private deployments need their own scope-specific estimate. Enterprise billing
Separate service fees, customer-operated collection resources and ongoing engineering work. List migration and parallel operation separately; historical construction costs are not future spending. Changing one exporter destination normally switches a path. Sending to both needs an actually supported duplication mechanism, with its extra load and charges.
Keep a tracing system that already supports everyday investigation, and repair its propagation and correlation gaps first. When cross-signal investigation or backend maintenance is recurring work the team wants to reduce, compare what Guance or another managed platform can actually take over. A mature platform team needing control of underlying resources can continue self-hosting. The useful purchase boundary is the investigation capability retained, the old components that can be retired and the recurring work that remains.
Contact us
Join the community

to join the community
Try Guance
Start online and pay only for what you use.
Get startedChoose a Guance plan