
Send DDTrace to Guance: Setup, Checks, and Rollback
Keep your existing DDTrace instrumentation, send one service to DataKit, check trace delivery and sampling, and retain a clear rollback path.
Quick facts
- Scope and versions
- Official DataKit and DDTrace documentation checked on 2026-08-01; the exact DataKit, runtime, tracer, platform and deployment combination is not yet fixed or tested.
- Estimated time
- 45–90 minutes for one low-risk staging service
- Prerequisites
- A non-production service with existing DDTrace instrumentation and an approved safe test request
- A privately reachable DataKit DDTrace receiver and permission to restart only the canary workload
- A record of the original destination, propagation, sampling, service, env and version settings
- Expected result
- A non-empty Trace ID with the configured service, env and version; the entry span opens, the controlled error is searchable, and the tested downstream relationship is complete or has a documented gap.
- Risk
- Only one canary service's trace destination changes. The procedure does not migrate Datadog dashboards, monitors, SLOs, logs, RUM, profiling, security, contracts, or history.
- Rollback
- The rollback procedure is documented, but restoration and a new trace in the original backend have not yet been executed and evidenced by Guance.
This is a receiver-switch Quickstart, not a claim of automatic Datadog migration. It does not move dashboards, monitors, SLOs, RUM, Synthetic Monitoring, profiling, logs, security data, contracts, or history. The steps below were checked against official documentation on 1 August 2026, but Guance has not yet published a versioned hands-on test record for this exact procedure. Keep the page out of production runbooks until your own staging test and rollback drill pass.
What this DDTrace canary changes—and what it leaves alone
The single change is the trace destination for one test service. The application keeps its current DDTrace library and instrumentation. DataKit receives the DDTrace protocol, processes the spans, and sends them to the selected Guance workspace.
TrueWatch's DDTrace collector documentation distinguishes three paths that are easy to confuse:
| Port or path | Purpose in this test | What a mismatch looks like |
|---|---|---|
DataKit HTTP 9529 |
Receives DDTrace payloads on the configured trace endpoints | The canary cannot connect or no trace reaches DataKit |
Datadog Agent 8126 |
Common default for the Datadog Trace Agent | The service continues sending to the old Agent, or connects to no receiver |
DogStatsD 8125 |
Receives metrics, including some runtime or JMX paths | Metrics may arrive, but DDTrace spans do not |
The DataKit ddtrace collector receives traces. Profiling uses a separate collector; runtime metrics and JMX may require StatsD or another integration. Seeing one trace is therefore evidence for the trace path only, not feature parity between two platforms.
The reversible Singapore evaluation path
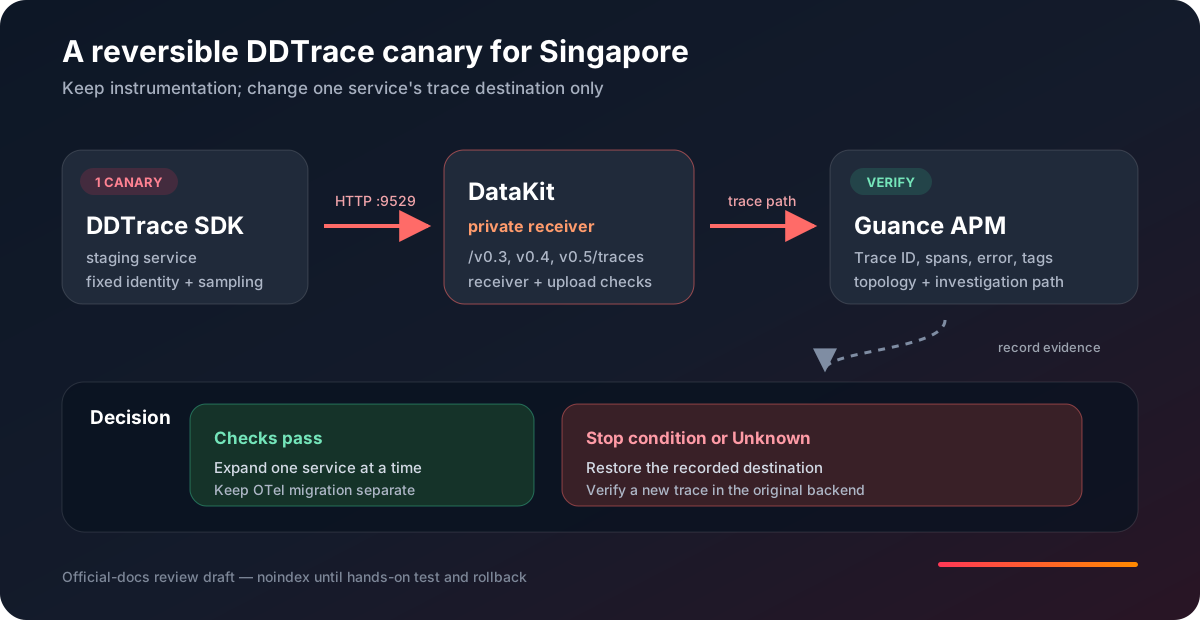
The evaluation has five boundaries:
Related guideAPM Monitoring: The Complete 2026 Guide→
- Keep the existing DDTrace SDK or Agent in the canary service.
- Change only that service's trace destination to an internally reachable DataKit receiver.
- Hold
service,env,version, propagation and sampling settings stable during comparison. - Restore the previous destination if any stop condition is reached.
Do not call this dual write. A normal DDTrace tracer is not assumed to deliver every payload independently to two backends. If you later need simultaneous export, design that as a separate OpenTelemetry Collector evaluation with isolated queues and explicit cost and failure analysis.
Scope the first service and define stop conditions
Choose a non-production service that is representative enough to exercise a downstream dependency but safe enough to restart independently. A staging checkout, login or catalogue API can work when it has a known successful request and a deliberately safe test-error path. Do not use real customer data or inject a production fault.
Before changing anything, agree on stop conditions. At minimum, stop and roll back when:
- the canary cannot reach DataKit without broadening an Internet-facing rule;
- application startup or request latency changes outside the team's pre-agreed tolerance;
- expected entry spans or a known downstream call are missing and the gap cannot be explained;
- sampling or filtering makes the two paths incomparable;
- trace attributes expose credentials, request bodies or personal data;
- the original destination cannot be restored within the team's change window.
A clock-only rule such as “wait five minutes” is not a success criterion. Batching, network distance, buffers and load vary. Measure the normal arrival delay for your own environment, record it, and compare like with like.
Record the current state before touching the destination
Rollback depends on an exact baseline, not memory. Put the following fields in the change record. Write “unset” when a value is absent; do not fill gaps by guessing.
| Field | Record before the test |
|---|---|
| Application | Language, runtime, exact DDTrace library or Agent version |
| Current destination | Effective host, port or URL and where each value is configured |
| Service identity | DD_SERVICE, DD_ENV, DD_VERSION |
| Propagation | Formats actually injected and extracted on each hop |
| Sampling | SDK rules, receiver rules, error/rare-resource handling |
| DataKit | Exact version, deployment mode, listener, collector configuration source |
| Network | DNS name, namespace/VPC, firewall or NetworkPolicy, outbound proxy path |
| Adjacent assets | Profiling, runtime metrics, logs, dashboards, monitors, SLOs and owners |
Do not print the complete environment into a ticket or CI log. Read only the non-secret settings needed for the test. A broad dump can expose unrelated credentials even when every DDTrace variable in this guide is safe.
Datadog's Python tracer configuration reference documents that DD_TRACE_AGENT_URL, when set, takes priority over separate host and port settings. The current Python, Java and Node.js references use DD_TRACE_AGENT_PORT for the trace-agent port; do not copy the legacy DD_AGENT_PORT spelling from an old example. Review the exact Datadog language library documentation used by the canary and remove conflicting destinations rather than assuming that the newest-looking variable wins.
Enable the DataKit DDTrace receiver
For a host installation, the documented pattern is to copy ddtrace.conf.sample from DataKit's conf.d/samples directory and manage it as ddtrace.conf. The minimum receiver section keeps the documented protocol endpoints:
[[inputs.ddtrace]]
  endpoints = ["/v0.3/traces", "/v0.4/traces", "/v0.5/traces"]

  # Promote only fields that are stable, useful and low-cardinality.
  # customer_tags = ["team", "deployment.region"]
Do not remove endpoint versions to make the file look simpler. They exist for client compatibility. Also do not leave an incomplete [inputs.ddtrace.sampler] table in the configuration. The official collector documentation warns that a sampler table without an explicit rate can drop every trace; remove the table when receiver-side sampling is not intended.
After applying the configuration through your normal DataKit process, restart only the affected DataKit instance and check that ddtrace appears as an enabled, non-crashed input. DataKit Monitor provides the supported status view:
datakit monitor --input ddtrace
Expected evidence is not a particular screenshot. Record the DataKit version, that the ddtrace input is enabled, whether its error count changes, and the time window used for the canary.
Expose port 9529 only to the workload that needs it
DataKit's HTTP listener is localhost:9529 by default. That works when the tracer and DataKit share a host. A separate Pod or host needs a reachable listener, for example:
[http_api]
  listen = "0.0.0.0:9529"
0.0.0.0 is not a security policy. If you use it, restrict the source with a Kubernetes Service and NetworkPolicy, security group, host firewall or an equivalent internal control. Do not expose the trace receiver directly to the public Internet. The same HTTP service can host other DataKit APIs, so a broad ingress rule expands more than this test.
For Kubernetes, prefer a private ClusterIP service with an explicit selector. This fragment is illustrative; match the selector and namespace to the DataKit deployment you actually operate:
apiVersion: v1
kind: Service
metadata:
  name: datakit-trace
  namespace: observability
spec:
  type: ClusterIP
  selector:
    app: datakit
  ports:
    - name: datakit-http
      port: 9529
      targetPort: 9529
Before routing traces, test DNS and TCP/HTTP reachability from the canary's network context. A successful DataKit health request proves only that the HTTP service is reachable; it does not prove that the DDTrace collector accepted a span.
curl --fail --silent --show-error \
  --output /dev/null --write-out '%{http_code}\n' \
  http://datakit-trace.observability.svc.cluster.local:9529/v1/ping
Record the status returned in your environment. Do not weaken network controls just to obtain a response.
Point one canary service at DataKit
Apply the destination only to the staging canary. Choose one of the following destination forms supported by the tracer version in use. Do not set both.
export DD_AGENT_HOST="datakit-trace.observability.svc.cluster.local"
export DD_TRACE_AGENT_PORT="9529"

  # Keep the existing identity and SDK sampling configuration unchanged.
export DD_SERVICE="<existing-service>"
export DD_ENV="<existing-env>"
export DD_VERSION="<existing-version>"

  # Start the application through its normal approved command or deployment.
Or, where the language-specific tracer supports the URL form:
export DD_TRACE_AGENT_URL="http://datakit-trace.observability.svc.cluster.local:9529"
export DD_SERVICE="<existing-service>"
export DD_ENV="<existing-env>"
export DD_VERSION="<existing-version>"

  # Start the application through its normal approved command or deployment.
Keep service, env, version and the existing SDK sampling rules unchanged throughout the comparison. Changing identity or sampling at the same time as the backend makes a missing trace indistinguishable from a search, grouping or sampling difference. If the team needs a later 100% sampling test, approve and record it as a separate low-volume experiment rather than hiding it inside the destination change.
Confirm that the tracer is actually loaded
A reachable receiver does not prove that the application loaded its tracer. Check the final runtime command, not only the deployment template:
- Java: confirm that the effective JVM command contains the approved
-javaagentbefore-jar. - Node.js: confirm that
dd-traceinitialises before instrumented modules; for an injected deployment, inspect the effectiveNODE_OPTIONSrather than assuming that the init step changed the running container. - Python: keep the existing
ddtrace-runor framework integration.ddtrace-run --infocan check configuration, but it does not replace an end-to-end trace.
For Guance Operator injection, configuration or annotation changes affect newly created Pods. Roll out or recreate only the canary Pod and confirm the effective runtime settings; an existing running Pod does not change in place.
Generate a safe success trace and a known error trace
Use a staging endpoint created for testing, a synthetic transaction, or a fixture that contains no customer identifiers. Send enough requests to make sampling behaviour visible, but do not create a load test by accident.
for attempt in 1 2 3 4 5; do
  curl --fail --silent --show-error \
    "https://staging.example.test/health/trace-canary?attempt=${attempt}" \
    --output /dev/null
done
Then invoke one approved test-error path whose expected status and downstream calls are known. Keep the error synthetic and reversible. The change record should contain the request time, expected HTTP status, expected entry resource and expected downstream service—not payloads or personal data.
This two-request pattern answers different questions:
- the success request checks ordinary entry spans and topology;
- the controlled error checks error classification and whether error retention differs from normal sampling;
- a downstream call checks propagation, parent-child relationships and service-map continuity.
“A trace appeared” collapses three failure domains. Keep them distinct.
1. DataKit receiver
Use datakit monitor --input ddtrace and the DataKit operating log to confirm that the input remains enabled and does not accumulate a new error during the request window. If needed, Guance's no-data troubleshooting guide explains how to separate startup, collector, listener, time, network and DataWay failures.
2. DataKit to the selected Guance site
DataKit's architecture documentation separates the local collector, DataWay and Guance centre. A healthy local receiver does not prove successful upload. Check the configured DataWay path, egress, time synchronisation and queue or error signals without copying any workspace credential into the evidence record.
3. Guance Trace Explorer
Open the Guance Trace Explorer for the intended workspace and time range. Filter using the exact canary identity recorded earlier.
The minimum expected result is:
- at least one non-empty Trace ID in the test window;
service=checkout-api,env=stagingandversion=guance-canary-2026-08-01match the emitted identity;- the entry span opens with a resource, duration, status and error state;
- the known downstream relationship is present, or the missing hop is documented;
- the controlled error can be located as an error trace;
- the sampling rules shown in the change record were unchanged during the requests.
Capture a sanitised evidence reference, not a raw screenshot containing URLs, customer identifiers or request attributes. A count alone is not enough unless both sides use the same request set and sampling conditions.
Troubleshoot by layer, not by random configuration changes
| Symptom | Check first | Expected evidence | Next action |
|---|---|---|---|
| No trace reaches DataKit | SDK/Agent loaded; effective host, URL and port; 9529 reachability |
One unambiguous destination and a reachable private listener | Remove a higher-precedence old URL, correct DNS/port, or restore the destination |
| DataKit input is absent or crashed | Collector file, TOML syntax and DataKit restart | ddtrace enabled with no new startup error |
Fix the collector configuration before changing the application |
| Receiver works but Guance is empty | DataWay egress, proxy, time range and selected workspace/site | Successful upload path and matching clock/window | Repair egress or search scope; do not broaden receiver ingress |
| Only some services appear | Per-service deployment values and tracer versions | Every canary instance uses the same intended destination | Reduce the cohort to one version, then reapply consistently |
| Service map is broken | Inject/extract formats and 64/128-bit Trace IDs | Parent and child share a reconstructable Trace ID | Align propagation; test one call path before expanding |
| Far fewer traces than test requests | SDK and receiver sampling, filters and error handling | Both sampling layers recorded and stable | Remove an unintended receiver sampler or reset the test model |
| A field exists only in span metadata | customer_tags and field cardinality |
Stable field is present without per-user uniqueness | Promote only the required low-cardinality field |
| Profiling or runtime metrics are absent | Signal-specific receiver and integration | Trace scope is working as documented | Plan Profiling and StatsD/JMX as separate workstreams |
Change one variable at a time. If three settings change and traces reappear, you have not learned which condition mattered and cannot rely on the rollback.
Preserve trace context across DDTrace and OpenTelemetry services
A mixed estate can ingest successfully while producing disconnected topology. Datadog's trace context propagation documentation covers Datadog, W3C tracecontext and B3 configuration, but supported defaults and environment variables still depend on language and version.
DataKit exposes compatibility controls for mixed DDTrace and OpenTelemetry paths:
[[inputs.ddtrace]]
  endpoints = ["/v0.3/traces", "/v0.4/traces", "/v0.5/traces"]
  compatible_otel = true
  trace_128_bit_id = true
Enable these only when they match the propagation actually emitted. compatible_otel=true affects the representation used for span and parent IDs, while trace_128_bit_id reconstructs the full ID when the upper bits are carried in DDTrace metadata. After a change, issue one request that crosses the DDTrace/OpenTelemetry boundary and inspect the parent-child chain. A protocol mismatch can present as a broken service map rather than total ingestion failure.
Do not change propagators across every service in one release. Move one call path at a time and preserve the previous inject/extract settings for rollback.
Keep sampling and tag cardinality comparable
SDK sampling and DataKit receiver sampling are independent. If the SDK keeps half the traffic and the receiver keeps half of what remains, the result is not “the same 50% sample” as either rule alone. Record both layers, including error and rare-resource behaviour.
For a short canary, compare:
| Control | Hold constant | Why it matters |
|---|---|---|
| Request cohort | Same synthetic or staging requests | Prevents workload mix from explaining count changes |
| SDK sampling | Exact rule and version | Determines what leaves the application |
| Receiver sampling | Exact DataKit sampler/filter state | Determines what DataKit uploads |
| Identity | service, env, version |
Keeps search and grouping stable |
| Propagation | Formats and 64/128-bit settings | Preserves topology across services |
| Tag allowlist | Only required low-cardinality fields | Limits indexing and operational cost |
The DataKit DDTrace documentation notes that DataKit 1.21.0 stopped promoting every span metadata field to a top-level tag, and DataKit 1.22.0 added customer_tags for selected fields. Do not promote user IDs, request IDs or session IDs. A field being searchable is not automatically worth its cardinality and privacy cost.
Add Singapore and Southeast Asia network checks
The application-to-DataKit hop should normally stay inside the same host, cluster or controlled network segment. The DataKit-to-DataWay hop is a separate outbound path. For a Singapore or Southeast Asia deployment, record these facts before the test:
Related guideObservability Fundamentals: The 2026 Guide→
- where the canary workload and DataKit run, including cluster, cloud region and network boundary;
- the exact Guance site selected for the workspace and the DataWay address actually configured;
- DNS, proxy, firewall, TLS inspection and outbound allow-list behaviour from that environment;
- whether cross-border transfer, retention, support or data-location commitments are contractual requirements;
- whether a private deployment is required instead of SaaS.
The Guance OpenAPI endpoint list labels an Asia Pacific Region 1 endpoint as Singapore. That endpoint label alone does not prove the storage location, processing path, contractual data residency or feature availability of your workspace. Confirm those points with the applicable agreement and regional team. Do not infer them from this page's en-SG locale.
Decide whether OpenTelemetry is a later migration—not the first test
Changing the DDTrace receiver and rewriting instrumentation are separate decisions. The first canary isolates the backend evaluation: can the current application traces support the investigation workflow in Guance? Only after that answer is known should a team decide whether to retain DDTrace, move selected services to OpenTelemetry, or redesign the collection tier.
The OpenTelemetry Collector can receive, process and export telemetry, and its configuration model supports multiple pipelines and exporters. That can enable a controlled parallel evaluation after a service emits OTLP, but it adds queues, egress, ingestion, storage and failure modes. “Multiple exporters” does not mean zero-loss delivery or free duplication.
Roll back the canary with the same precision as the cutover
Rollback is complete only when new traces are visible again in the original backend. Use this order:
- Restore the recorded effective trace URL, host, port, propagation and sampling settings for the canary only.
- Redeploy or restart only that workload through its normal approved release path.
- Send a fresh success request and a safe known-error request.
- Confirm new traces in the original backend with the expected service identity and downstream span.
- Confirm that new Guance canary traces have stopped after allowing for normal buffers.
- Remove temporary receiver access or test-only configuration only after the original path is stable.
For a typical Datadog Agent destination, the recorded host plus DD_TRACE_AGENT_PORT=8126, or the original DD_TRACE_AGENT_URL, is the rollback value. Restore the value that was actually effective before the test rather than assuming the default. In a Guance Operator injection test, disabling the DDTrace injection annotation also requires recreating the canary Pod. Setting DD_TRACE_ENABLED=false only disables tracing; it does not route traces back to Datadog and is not the default rollback.
If the destination change was isolated in its own Kubernetes revision, a targeted rollout can be used. Do not blindly undo a deployment that also contains unrelated application changes.
kubectl rollout status deployment/checkout-api --namespace staging

  # Use only when the recorded revision contains the destination change alone.
kubectl rollout undo deployment/checkout-api --namespace staging
Do not remove the Datadog Agent, old monitor, original configuration or rollback evidence during the first canary. Cleanup is a later decision after the rollback drill, adjacent-signal inventory and stakeholder approval.
Use a 30-day decision record before expanding broadly
A one-off trace proves plumbing, not production readiness. A 30-day evaluation can cover ordinary traffic, releases and at least one real investigation without forcing a specific threshold on every team.
| Decision area | Evidence to record | Expansion gate |
|---|---|---|
| Trace coverage | Expected services/endpoints, fixed sampling and explained gaps | Critical request paths are present or each gap has an owner |
| Investigation | Success, error, timeout and slow traces used in an incident exercise | Team can reach a defensible root cause with the agreed workflow |
| Topology | DDTrace and OpenTelemetry boundaries tested | No unexplained parent-child breaks on the selected path |
| Operations | DataKit CPU, memory, queues, errors and egress | No sustained saturation against the team's baseline |
| Privacy | Span attributes and promoted tags reviewed | No credential, body or personal-data exposure |
| Adjacent assets | Logs, profiling, metrics, dashboards, monitors and SLOs inventoried | Every non-trace asset has a keep, rebuild or retire decision |
| Rollback | Actual restore test, owner and elapsed time | Original backend receives new traces after restoration |
| Cost | Same traffic, sampling, retention and parallel-run period | Model is reproducible; no blanket saving is assumed |
If evidence is missing, leave the item as not publicly documented and keep the cohort small. Simply running for another week does not resolve an not publicly documented unless a test is designed to answer it.
not publicly documented items and claims this guide does not make
The following remain environment-specific until a versioned hands-on test is completed:
- exact runtime, DDTrace tracer and DataKit compatibility for the reader's stack;
- the effective precedence of every language-specific destination setting;
- current Datadog contract, sampling, retention and custom pipeline behaviour;
- migration of dashboards, monitors, SLOs, logs, RUM, Synthetic Monitoring, Security, profiling or history;
- SaaS site, data-location, support, SLA and private-deployment equivalence;
- loss, latency and cost under the reader's production load.
Accordingly, this page does not claim “drop-in replacement”, “one-click migration”, “zero downtime”, “no data loss”, “full compatibility”, native dual write or a guaranteed saving. Any numeric Datadog cost comparison belongs in the separate pricing model, where workload, region, retention and reversal cases can be shown together.
Connect the technical test to the Datadog buying decision
Use the three Research owners for different questions:
- Datadog Alternative Singapore asks whether the operating model fits and where Datadog remains the better choice.
- Datadog pricing in Singapore explains AP1 public rates and the assumptions that change the estimate.
- This Quickstart tests whether one existing DDTrace service can support a reversible Guance APM investigation path.
If all three answers are acceptable, review the resulting topology, security, regional constraints and expansion sequence against the Guance APM product scope. A successful trace canary still does not authorise a full-platform cutover.
Official sources
The volatile facts in this guide were checked on 1 August 2026 against first-party documentation:
- TrueWatch Docs — DDTrace — receiver scope, ports, endpoints, listener, sampling, tags and propagation controls.
- Guance Docs — DDTrace — DataKit collector configuration and environment controls.
- Datadog Docs — Python tracer configuration, Java tracer configuration, and Node.js tracer configuration — destination variables, precedence and language-specific loading controls.
- Datadog Docs — Add the Datadog SDK — language-specific instrumentation entry points and destination configuration.
- Datadog Docs — Trace Context Propagation — Datadog, W3C and B3 propagation controls.
- Guance Docs — Operator DDTrace injection — injection configuration, Pod lifecycle and language startup details.
- Guance Docs — DataKit Monitor — input status, errors and runtime evidence.
- Guance Docs — No data collected — receiver, network, time, collector and DataWay troubleshooting.
- Guance Docs — DataKit architecture — collector, DataWay and Guance centre boundaries.
- Guance Docs — Trace Explorer — trace search and inspection workflow.
- Guance Docs — OpenAPI endpoints — the published Asia Pacific Region 1 endpoint label and the limit of what that label proves.
- OpenTelemetry — Collector and Collector configuration — receivers, processors, exporters and pipelines.
- TrueWatch Docs — OpenTelemetry — DataKit OTLP ports, paths and protocol constraints.