


Choosing cloud monitoring tools for a multi-cloud system
Compare cloud-native monitoring, shared backends and federated queries through resource identity, access, billing and the operational work each option leaves to your team.
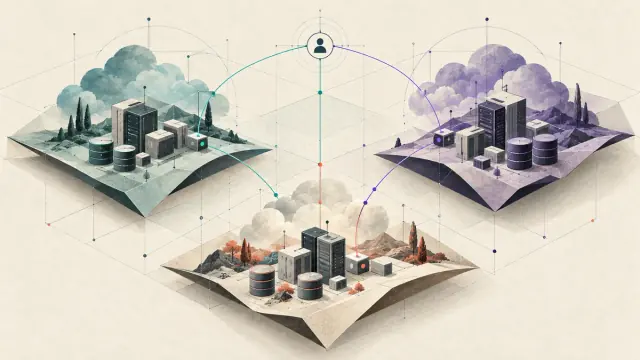
When choosing cloud monitoring tools, I would first count the boundaries an investigation has to cross. An AWS resource alarm, an application trace in Azure and logs in Google Cloud may all be available, yet an engineer still has to find the account, reset the time range and work out whether three names refer to the same service. Removing that repeated work is a useful reason to consolidate.
Keep cloud-native tools that already serve independent workloads well. A common backend or query layer becomes more valuable when cross-cloud calls are part of everyday troubleshooting, or several teams are maintaining the same collection, access and alerting work. Guance is worth considering when the team wants shared investigation workflows and less backend operation. Its workspace and site boundaries still belong in the architecture.
Guance Editorial Team · 28 October 2026. This article uses official documentation to discuss multi-cloud monitoring mechanisms and operational responsibility. Guance publishes it and is one of the options discussed; no common-workload benchmark or customer cost test was performed.
Give resources and services a stable identity
A host belongs to an account and region on its cloud bill, runs several services in Kubernetes, and may appear under an application name in a trace. Putting those sources on one screen does not establish their relationships.
Retain the provider's native resource identifier, then add agreed service, environment and ownership attributes. The following is an example normalization model, rather than a set of fields a product fills automatically.
| Object | Information to retain | Why it matters |
|---|---|---|
| Cloud resource | Provider, account or project, region, native resource ID | Separates similarly named resources in different accounts |
| Application service | Service name, environment, version and owner | Connects deployments, alerts and the responsible team |
| Request or event | Trace ID, event time and resource context | Supports investigation of the same activity across signals |
| Cost item | Billing account, resource dimensions, billing period and currency | Places a cost change within the right business and resource scope |
OpenTelemetry's cloud resource conventions describe provider, account, region and native resource identifiers. Collected attributes still need to map to the backend's fields. An application's service field, OTel's service.name and a cloud tag can identify the same service, but similar-looking strings are not enough to join them.
Time and sampling matter just as much. Different windows or a failed request whose spans were never retained leave gaps in the investigation. Once the identities and records agree, a shared interface can remove repeated filtering rather than merely relocate it.
Cloud-native monitoring has useful scope of its own
AWS, Azure and Google Cloud all support forms of cross-resource or cross-project monitoring. Dismissing them as isolated consoles would discard useful existing work.
CloudWatch cross-account observability links monitoring and source accounts within one Region, sharing the configured metrics, logs, traces and other supported telemetry. Cross-Region log centralization is a different mechanism: rules replicate newly arriving logs, without automatically backfilling records that predate the rule. A cross-account query and a cross-Region copy have different data-flow and cost consequences. CloudWatch log centralization
Azure Monitor can collect telemetry from workloads in AWS, GCP and other locations. Guest VM telemetry can use Azure Arc and Azure Monitor Agent; applications use the relevant Application Insights collection path. Audit-log scenarios involve their applicable connectors and products. Those paths still need deployment, permission and maintenance; multi-cloud support does not mean every source is already searchable. Azure multicloud monitoring
In Google Cloud Monitoring, a metrics scope determines which projects' time series a project can chart and monitor. Cloud Logging uses configurations such as log scopes for log searches. A metrics scope therefore does not establish log access or prove that logs have been copied to a central store. Metrics scopes, log scopes
Native services can be a good fit when most investigations stay within these scopes and teams know the tools. Frequent cross-cloud investigation changes the question: how much work is still needed to connect entry points, attributes and access?
Decide where the data and queries run
The control plane manages configuration, identity and entry points. The data plane receives and stores telemetry and executes queries. They need not share the same placement. Using one product in several regions does not require centralizing every record; displaying several regional panels does not establish a cross-region join.
| Architecture | Placement of data and queries | Main trade-off |
|---|---|---|
| Central storage | Send the required telemetry to a common backend | A more direct query path, with network, transfer and concentrated-access considerations |
| Independent regions | Keep regional backends and investigation entry points | Clear boundaries, with shared service identity and incident handoff still needed |
| Federated querying | Retain regional data and authorize reads or aggregate results | Query routing, permissions, timeouts and partial results become operational responsibilities |
Federation can suit particular requirements. It also needs a defined response to an unreachable region: an error, a timeout or an explicitly incomplete result. A blank panel must not quietly become evidence that no errors occurred.
Guance's cross-workspace authorization gives a receiving workspace access to permitted data. Cross-site access uses an authorization pack generated and imported by the workspaces; one joint query covers workspaces within one target site. Reporting across sites requires separate site-specific requests and client-side merging. The client location and the fields it combines are part of the data-flow design. DQL query API
Other services have their own boundaries. Datadog documents independent sites that cannot share data. Grafana Cloud can connect supported external data sources, with connectivity, credentials and query behavior determined by the actual backends. Several panels on one dashboard do not automatically become one set of records that can be joined across sites. Datadog Sites, Grafana external data sources
Storage, backups, exports, remote access and query results all belong in the organization's data-handling design. Regional services help choose a storage location; requirements still depend on the data, access and contracts, rather than the region's name alone.
Reduce the work around an investigation
Consider a service in AWS calling a dependency in Azure. A service name helps identify its owner; a trace ID distinguishes the particular request. Resource identity then connects the investigation to the relevant host, container and network conditions. Each relationship has its own basis. A generic multi-cloud label cannot replace them.
Guance's trace details can connect logs through trace_id and show related host, container and Pod information. The signals must already be collected, with matching service attributes, index mappings, time ranges and access. Keeping a log longer does not recover a trace that has expired. Trace details and related data
For a team trying to reduce platform maintenance, a managed workflow offers a concrete benefit: collection and business rules can lead into log, trace and resource investigation without a separate backend-building project. Service names, context propagation and alert ownership remain the team's work. The service provider takes on backend operation and delivery of the documented analysis features.
An established platform team can keep a self-managed route. Prometheus federation collects selected time series; Thanos Query reads supported StoreAPI sources. These are metrics paths, so logs and traces need their own backends. Duplicate HA series, regional timeouts and partial responses also need the appropriate query configuration. Prometheus federation, Thanos Query
Where that service already works, compare migration with the components and maintenance time it can actually remove. Changing the collection destination while keeping every old system increases duplicate ingestion and historical-access costs in the short term.
Explain the cloud bill and the monitoring bill separately
There are two layers of cost: running the workload, and observing it. Account, resource and billing-period attributes can relate the bills, but their update times and units differ.
For example, Guance's AWS Billing integration requires the relevant Cost Explorer permissions and the collector’s extra_tags settings for account_name and account_id. Resource-level data also needs the corresponding AWS setting. The integration collects T-1 (previous-day) billing data. It helps explain prior cost changes alongside resource use; it is not a real-time price feed for currently running resources.
Someone must maintain the tag mapping as well. A resource rebuild, account move or cost-center change need not rewrite attribution in an old bill. Retain the original period and identifiers when regrouping historical charges so that changes in allocation can be explained.
Monitoring services meter the actual signals and features used. Hosts, active metric series, ingested bytes, indexed events, retention, queries, RUM sessions and extra compute are different inputs. A workload described as “200 hosts and 200 GB of logs per day” supplies only part of a complete SaaS estimate.
Total investment
= sum of regional platform charges
+ customer-operated collection, storage and network costs
+ maintenance of shared queries and identity integration
+ duplicate ingestion and historical access during migration
Do not add services a plan already includes twice, or omit the parts the customer still runs. Price normal and peak months separately, with the same investigation coverage and retention outcome. Keep engineering time separate from cash spend to see whether the managed-service fee replaces enough operational work.
Consolidate the investigation that takes the most effort
I would keep effective cloud-native monitoring and first align the service identities, alert entry points and evidence links used in frequent cross-cloud investigations. That can remove repeated filtering without moving all historical data merely to standardize the vendor name.
If most work remains inside each cloud or region, native services plus a small set of deliberately maintained integrations can be enough. When cross-cloud investigation is routine and the team cannot sustain the query, storage and correlation backends, a managed platform such as Guance deserves closer consideration. Its value should appear as a shorter investigation path and fewer backends the team must deliver itself.
Teams that need control of the underlying resources and can maintain the whole service can continue developing a self-managed architecture. In every case, preserve shared resource identity and data meaning. As a service or signal moves, move the relevant access, queries and alerts with it. A multi-cloud system that people can understand and maintain is more useful than a dashboard that appears to cover every cloud.
Contact us
Join the community

to join the community
Try Guance
Start online and pay only for what you use.
Get startedChoose a Guance plan