


Prometheus and Grafana alternatives: extend the stack or move to managed services
Compare Prometheus and Grafana alternatives through metrics backends, series and samples, remote write, HA deduplication and alert assets to decide what is worth moving.
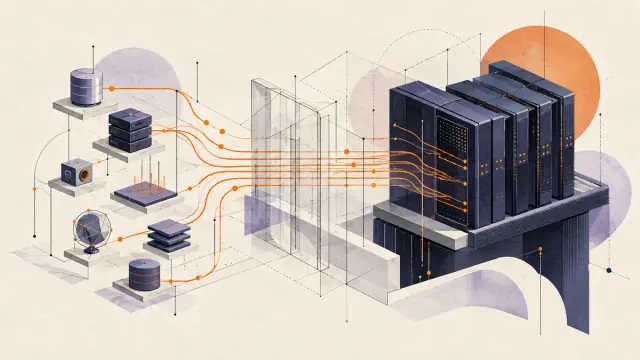
If Prometheus and Grafana already support your on-call work, I would not migrate just to replace the interface. Extend the backend when metrics capacity is the constraint. Consider a managed service when nobody can keep owning storage, upgrades and recovery. A broader platform becomes worthwhile when the data exists, but engineers still rebuild the context of each incident across several systems.
Prometheus and Grafana have complementary jobs. Prometheus collects, stores and queries metrics and evaluates recording and alerting rules. Grafana connects to data sources for exploration, dashboards and alerting. A useful comparison of Prometheus and Grafana alternatives starts with the layer that needs to change: collection, storage, or investigation. Replacing Grafana alone leaves the metrics backend to be addressed. Prometheus architecture, Grafana data sources
Guance Editorial Team · 28 October 2026. This source-based article discusses self-managed and managed operating models. Guance is one of the candidates. Calculations use stated assumptions, not production benchmarks or customer savings.
Find the layer that needs a different operating model
For long retention and cross-cluster queries, a metrics backend such as Thanos, Mimir or VictoriaMetrics is a sensible first option. Existing exporters, PromQL and Grafana workflows may remain useful. The platform team still owns the chosen components’ capacity, availability, upgrades and recovery. Each project has its own architecture and compatibility boundaries; taking in metrics does not also provide every log, trace and user-experience workflow.
If you want to keep Grafana while handing off backend operations, compare Grafana Cloud and an appropriate cloud-managed Prometheus service. Grafana Cloud differs from self-managed LGTM: Loki, Grafana, Tempo and Mimir can form a multi-signal stack, but a self-managed deployment still needs people to operate and recover those components. Broader services such as Elastic Observability and Guance move the decision toward cross-signal investigations and the scope actually delivered.
| Current constraint | A useful first option | Work the team retains |
|---|---|---|
| Local metrics retention or cross-cluster queries | Thanos, Mimir or VictoriaMetrics | Capacity, availability, upgrades and recovery for the chosen architecture |
| Keep Grafana while reducing backend operations | Grafana Cloud or managed Prometheus | Collection, usage, labels, access and connectivity |
| Control the multi-signal components directly | Self-managed LGTM | Each backend, its operations, alerting and correlations |
| Investigations remain fragmented across signals | Guance, Elastic Observability or another broader platform | Instrumentation, business fields, permissions and query migration |
| The current platform works and has maintainers | Keep Prometheus and Grafana | Capacity, rules, dashboards and recovery readiness |
These routes change recurring work. Prometheus uses Apache 2.0 and Grafana OSS uses AGPLv3; the selected distribution, plugins and additional products have their own terms. Being able to deploy the software yourself does not remove the cost of running and integrating it. Prometheus license, Grafana license
Count series and samples before comparing unit prices
High cardinality moves with the data. A request ID or user ID used as a metric label can create an ever-growing set of time series. A larger backend may handle more series, but somebody still has to decide which dimensions are useful. Prometheus data model
Consider a deliberately simple example: 20 services, each with 10 routes, five statuses and eight Pods producing every combination for one scalar metric. That gives 20 × 10 × 5 × 8 = 8,000 series. Scraping every 15 seconds yields about 32,000 samples per minute; every 60 seconds yields about 8,000. The series count is unchanged while sample volume falls to one quarter. This steady-state example excludes restarts, series churn, histograms and replicas.
Dropping a dimension removes a way to slice the data. Increasing the interval reduces time resolution. Whether either trade-off is acceptable depends on the actual queries and alert windows. A dimension that no investigation uses may be a candidate for filtering or aggregation; a Pod dimension needed to isolate a fault still has a job to do.
Grafana Cloud Metrics considers active series and data points per minute (DPM) in billing. Other services can meter differently, so bytes, series and data points are not interchangeable. Fix the collection scope, frequency, retention and query needs before comparing managed-service charges. Grafana Cloud metrics billing
A remote write connection does not move every asset
Prometheus server maintains a queue for each remote write destination, reading samples from its WAL and sending them through shards. A slow receiver creates a backlog. A successful local query does not prove that the remote service has caught up, and recovery needs enough sending capacity to overtake new samples. The WAL is not an unlimited offline archive. Remote write queues and recovery
This is a practical reason to retain collection: the destination can change before every exporter does. Stored history, recording rules, alert rules and Grafana dashboards are separate assets, each with a decision to retain, import or rebuild.
HA replicas deserve particular attention. Grafana Cloud Metrics enables HA deduplication using cluster and __replica__: replicas share a cluster value and have distinct replica values. That is a receiver convention, rather than a promise made by the remote write protocol for every backend. When receivers change, check replica identity, deduplication and the series actually received together. Grafana Cloud HA ingestion
Guance provides a DataKit Prometheus Remote Write receiver, allowing an existing collection path to continue. Plan the field mapping: with the collector’s default naming configuration, without measurement overrides, go_memstats_heap_objects becomes measurement go and field memstats_heap_objects; keep_exist_metric_name = true preserves the full original field name. After ingestion, align the metric names and filters in existing queries with the new model. Guance also offers MetricsQL queries, but compatible syntax still needs the expected results from the actual queries.
Correlation needs data conventions as well as a shared interface
Grafana already connects multiple data sources, and its Prometheus data source can configure exemplar links to traces. If the current stack has the necessary log and trace backends, stable identifiers and working links, improving it can be easier than replacing it. Grafana Prometheus data source configuration
The integration work lies in carrying service names, environments, time ranges and permissions across those systems. Can the service on an error-rate alert select the right logs? Does a log’s trace_id lead to a trace that is still retained? Those details determine whether an investigation path works.
A Guance workspace can receive metrics, logs, traces and RUM, with correlation entry points in trace details. When identifiers agree and the relevant data has been collected and remains queryable, engineers can follow those entry points rather than maintain every link and backend themselves. The team still sets fields and retention; a request that was never collected cannot be reconstructed by sharing a platform. Log and trace correlation
AI assistance belongs on the same path. Obsy Agent Teams can work with configured tools and authorized data to advance an investigation. The cited events, filters and time ranges should remain inspectable. Tool access and an actionable, supported diagnosis are different outcomes. Agent Teams tasks
Alert assets and recurring costs determine how far to move
Alertmanager already supports deduplication, grouping, routing, silences and inhibition. Inhibition can reduce downstream notifications during a cluster failure. Incorrect ownership, thresholds or routing still need correction after migration. Preserve actionable alerts and their runbooks instead of treating a lower notification count as the sole result. Alertmanager
Keep dashboards according to their purpose too. A disaster-recovery or compliance view should not disappear merely because nobody opened it in the last 90 days. For queries being moved, retain the meaning of units, aggregation, missing data and time windows. Alert migration also includes evaluation intervals, pending periods and notification routes.
A first-year model makes the cost comparison explicit:
First-year investment
= 12 × (platform bill + customer-side collection resources
        + network charges + remaining operating costs)
+ one-time migration costs
+ additional transition costs
List engineering time separately from cash expenditure. Count only the extra cost of parallel operation above the steady-state arrangement, avoiding double counting. Guance should likewise be quoted for the chosen plan’s actual ingestion, processing, storage and compute items, rather than represented by a single metrics price. Guance Enterprise billing
Extend the metrics backend when that is the constraint. Start with managed services when keeping Grafana matters and backend operations are the burden. A broader alternative such as Guance becomes worth comparing when fragmented investigations and systems maintenance keep consuming engineering time. The appropriate migration boundary follows the old components that can actually be retired, the investigation capability retained and the ongoing cost.
Contact us
Join the community

to join the community
Try Guance
Start online and pay only for what you use.
Get startedChoose a Guance plan