


Datadog vs Grafana Cloud 2026: Pricing, APM, and Migration Trade-offs
Compare Datadog and Grafana Cloud across application workflows, host-hour and telemetry billing, metric cardinality, incident response, and migration.
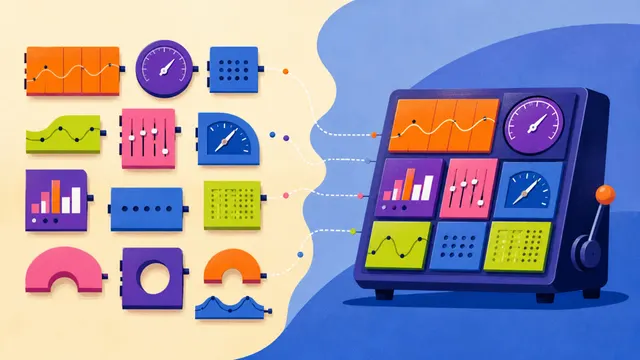
Short answer: Datadog and Grafana Cloud both offer managed observability. Datadog packages infrastructure, APM, logs, and other products around its platform; Grafana Cloud combines managed telemetry services with optional opinionated workflows such as Application Observability. If your team already relies on PromQL and Grafana dashboards, that continuity is a reason to evaluate Grafana Cloud. If your working monitors and investigations are in Datadog, include their replacement cost before switching. Neither architecture establishes a universal price or usability winner.
Disclosure: published by the team behind Guance. This is a documentation-based comparison, not a product benchmark. Product and billing boundaries reviewed October 21, 2026; quoted USD starting rates are not regional quotes and exclude taxes, discounts, and implementation.
Datadog vs Grafana Cloud at a glance
| Dimension | Datadog | Grafana Cloud |
|---|---|---|
| Delivery | Managed SaaS with separately metered products | Managed telemetry plus optional application, Kubernetes, AI, and incident workflows |
| APM billing | APM starts at $31/host/month with paid Infrastructure attached; standalone starts at $36, annually billed | Application Observability adds host-hour charges to telemetry; building your own telemetry dashboards does not incur that product's host-hour charge |
| Metrics | Included infrastructure metrics plus custom-metric allowances and overages | Billable active series and data-point frequency |
| Logs and traces | Ingest and search/retention choices have their own meters | Processed/written volumes, retention, and—for logs—query usage above fair use |
| Query languages | Product-specific Datadog queries | PromQL, LogQL, TraceQL and data-source-specific queries |
| Incident response | On-Call and Incident Management products | IRM, metered by active users with included usage |
| Portability | OpenTelemetry ingestion available; monitors and dashboards need migration | Open telemetry formats and dashboard JSON help; Cloud-only features still need replacements |
The billing distinction is documented in Datadog pricing and Grafana Application Observability billing. Comparing Datadog APM with only the cost of storing traces in Tempo omits part of the application workflow.
1. Follow a request through the application
Grafana Cloud operationalizes a stack of open-source projects: Mimir for metrics, Loki for logs, Tempo for traces, and Grafana for visualization. But buying the managed platform is different from running those projects yourself. Application Observability provides a service inventory, service health views, and service maps. These views depend on the required telemetry and resource labels; a missing service name or incorrectly generated span metric can leave gaps even when traces are arriving. Service inventory · Required metrics and labels
Related guideDatadog vs. Dynatrace: a side-by-side comparison for 2026→
Datadog likewise needs the appropriate collection and instrumentation for each signal. Installing an infrastructure Agent does not by itself produce browser sessions, application spans, or profiles for every runtime. Its APM product includes service discovery and trace investigation, while profiling and other capabilities depend on the chosen product tier and supported instrumentation. APM plans
The useful trial is one investigation: start with a latency alert, identify the affected service, open a representative trace, and find the associated log. Record missing instrumentation and manual joins. That reveals assembly work in either product without assuming one vendor has eliminated it.
2. Same workload, different billing inputs
Use the same inputs—100 continuously monitored hosts, 2,000 GB of logs per month, 1,500 GB of traces, and 25,000 metric series—but measure how each vendor turns them into billable usage. A series count does not define Datadog's custom-metric count; bytes sent do not necessarily equal bytes written; trace retention must match.
| Workload input | Datadog cost boundary | Grafana Cloud cost boundary |
|---|---|---|
| 100 infrastructure hosts with APM | At annual starting rates, 100 × ($15 Infrastructure Pro + $31 APM) = $4,600/month for these two products only | If using Application Observability, 100 hosts × 720 active hours = 72,000 host-hours before allowances and volume tiers; telemetry is separate |
| 25,000 metric series | Identify custom metrics, tag combinations, account allowance and contract | Measure active series and DPM; apply included usage and the applicable tier |
| 2,000 GB logs | Separate ingest, indexed events, retention and any Flex configuration | Separate processed and written data, retained volume and query use |
| 1,500 GB traces | Apply APM ingest/index allowances and any overage | Apply trace processing, writing and retention charges; these are not a substitute for the Application Observability fee |
| Browser sessions, synthetic tests, paging and AI | Specify products and entitlements | Specify products, users, sessions/tests and AI consumption |
This is a cost map, not two complete invoices. Grafana Cloud Pro starts with a $19 monthly platform fee and included usage, then charges applicable product meters. Its Application Observability starting rate is $0.025 per host-hour, plus telemetry for customers starting on or after February 13, 2026; earlier customers can have a different rate with telemetry credits. A workload estimate must use the account's model. Grafana pricing · Application Observability pricing
Logs also have a query boundary: Grafana's documented fair-use allowance is 100 times written log volume per month; queries above it can add charges. Paid logs and traces have a 30-day minimum retention, with extra retention increments charged separately. Do not multiply a headline per-GB rate by raw input and call it the full bill. Logs billing · Traces billing
3. Metrics and cardinality: where both models bite
One unbounded tag can mint thousands of billable series overnight. In Datadog, custom metrics are counted from metric names and tag-value combinations. Infrastructure Pro and Enterprise include different account-level allowances; Metrics without Limits changes the ingested/indexed billing distinction. It is inaccurate to treat every standard integration metric as an additional custom metric. Custom metrics billing
Grafana Cloud measures active series and data points per minute at the 95th percentile. Sending more points per series than the included resolution can raise billable usage even if the number of series stays constant. Adaptive Metrics recommends aggregations based on observed use in dashboards, alerts, rules, and queries; review the labels you would lose before applying a recommendation. Metrics pricing · Adaptive Metrics
In practice, export the most expensive series and their owners before negotiating a platform change. Moving a request ID from one metric backend to another does not fix its cardinality.
4. Dashboards and visualization
Grafana dashboards are JSON you can export and version in Git. That helps preserve investment in panels and PromQL, but portability depends on data-source UIDs, plugins, query features, and provisioning. A Cloud-specific investigation or application view is not necessarily a portable open-source dashboard.
Datadog dashboards and monitors can also be managed as configuration; the migration problem is their semantics, not an inability to export them. Query expressions, grouping, missing-data behavior, notification routes, and access controls must be rebuilt or validated in the destination. Compare two dashboards your responders actually use rather than judging visual quality from screenshots.
5. Alerting, on-call, and incident response
Datadog provides On-Call and Incident Management as products with their own commercial terms. Grafana IRM provides on-call schedules, escalations, incident coordination, and reviews; it is a paid Cloud add-on billed by active users, with plan allowances. Evaluate the built-in workflow and its entitlements before deciding whether to keep an external paging service. Datadog plans · Grafana IRM
Grafana also offers Assistant and investigations. These are useful candidates for investigation assistance, but their presence alone does not establish the same results as Datadog Watchdog or Bits AI. Check data access, permissions, evidence quality, and availability on the deployment being evaluated. Assistant user/token charges are separate from IRM and visualization. Grafana Assistant · Assistant billing
6. Lock-in and exit cost
A Grafana Cloud deployment can use Prometheus exposition, OTLP, Loki APIs, and dashboard JSON. These reduce some migration work; they do not make it zero. Datadog also accepts OpenTelemetry, so a team already using supported OTel instrumentation may retain it while rebuilding vendor-specific configuration. Compatibility differs by signal and feature. Datadog OpenTelemetry compatibility
Both migrations need a parallel period: compare sampling, service identity, alert behavior, and retention on one application before moving the rest. Query history and incident workflows do not move merely because a collector endpoint changes. Include that work, dual-running costs, support, network egress, and tax in the total cost.
Datadog or Grafana Cloud: which should you choose?
Pick Datadog if the integrations, monitors, and investigation paths you need fit its supported products and your team wants to standardize there. Price the relevant tiers and overages rather than extrapolating from the infrastructure host price.
Pick Grafana Cloud if preserving Grafana dashboards and Prometheus/OTel telemetry is important, and its managed services or Application Observability meet the workflows you need. Choose deliberately between building your own views and paying for the opinionated application product.
If the main friction is reconnecting logs and traces across screens, Guance is another platform to trial against the same incident. The APM documentation describes its service and trace analysis; use your own identifiers, retention needs, and workload to test fit and request a scoped estimate.
FAQ
Is Grafana Cloud cheaper than Datadog?
There is no reliable percentage without matching the products, telemetry, retention, users, and contract. Omitting Grafana Application Observability host-hours or Datadog overages can reverse the apparent conclusion.
Is Grafana Cloud the same as Grafana?
No. Grafana is the visualization project; Grafana Cloud is a managed platform with telemetry services and additional products. Self-hosting open-source components does not reproduce every Cloud feature or its support terms.
Can Grafana Cloud replace Datadog APM?
It can be a candidate: its Application Observability provides service inventory and service views on supported telemetry. Validate runtime coverage, profiles, databases, sampling, and trace/log correlation rather than equating trace storage with the entire APM workflow.
Does Grafana Cloud have a free tier?
Yes. It has per-product usage and retention limits. Check the current pricing page for the signals and workflows you intend to use; a free allowance is not a production-capacity recommendation.
Sources reviewed October 21, 2026: the first-party pricing and documentation linked in each section. No setup-time, performance, support-quality, or savings benchmark was conducted.
Contact us
Join the community

to join the community
Try Guance
Start online and pay only for what you use.
Get startedChoose a Guance plan