
Datadog vs. Dynatrace: Which Is Better in 2026?
Compare Datadog vs Dynatrace on setup, APM, logs, AI, security, pricing, TCO, and deployment. See where each wins and which platform fits your team.
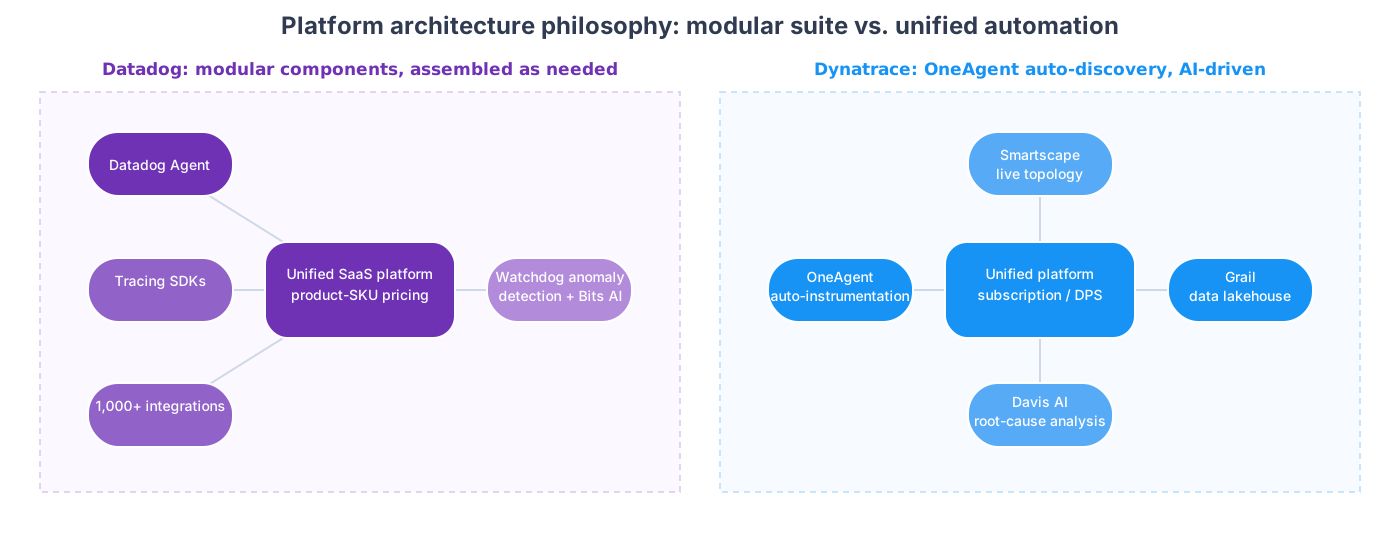
Short answer: choose Datadog when you want the broader integration ecosystem, modular rollout, and more control over how engineers collect and explore data. Choose Dynatrace when you want OneAgent-led discovery, topology, and automated problem context to do more of the setup and correlation for you. Neither is automatically cheaper: Datadog spreads cost across products and usage meters, while Dynatrace combines memory-based Full-Stack consumption with data, query, session, and test usage.
Datadog vs. Dynatrace at a glance
| Category | Datadog | Dynatrace | Edge |
|---|---|---|---|
| Best fit | Cloud-native and engineering-led teams that value breadth and control | Large or complex estates that value automation and topology | Depends on operating model |
| Setup | Flexible Agent, tracer, Single Step Instrumentation, and OpenTelemetry paths | OneAgent discovers supported services and dependencies automatically | Dynatrace for automation |
| Integrations | 1,000+ listed integrations | Hundreds of supported technologies and extensions | Datadog for breadth |
| APM | Granular instrumentation, tracing, profiling, and developer workflows | Strong auto-instrumentation, PurePath, topology, and probable-cause context | Depends on workflow |
| Logs | Explicit ingest, indexing, Flex, archive, and retention choices | Grail, OpenPipeline, DQL, and topology-aware analysis | Depends on data strategy |
| AI | Watchdog, Bits AI, and workflow-specific assistants | Dynatrace Intelligence and topology-led causal analysis | Dynatrace for causal context |
| Incident response | Native Incident Management, On-Call, Status Pages, workflows, and postmortems | Problems and Workflows, often paired with external paging and coordination tools | Datadog for native breadth |
| Deployment | Primarily SaaS; BYOC Logs covers the log data plane only | SaaS plus Dynatrace Managed on customer infrastructure | Dynatrace for customer-hosted deployment |
| Pricing | Modular products with multiple meters | Shared DPS commitment with memory and usage-based consumption | Model the same workload |
Both vendors announced Leader positions in the 2026 Gartner Magic Quadrant for Observability Platforms. That makes both credible shortlist candidates, not substitutes for a proof of concept on your own services and data.
How this comparison was built
This comparison uses current vendor documentation, public price lists, annual reports, product pages, and recurring themes in third-party hands-on reviews. We did not run a controlled head-to-head benchmark for this article, so no conclusion below should be read as a universal performance ranking. The useful question is narrower: which platform gets your team from a real production symptom to evidence and action with less operational and financial friction?
Related guideDatadog vs Grafana Cloud 2026: Buy the Platform or Assemble the Stack?→
For pricing, every example below uses public rates and clearly stated workload assumptions. It is not a vendor quote. Enterprise discounts, support, taxes, retention, excess telemetry, and migration overlap can materially change the result.
The core difference: modular control vs. automated context
The two companies approached observability from opposite directions and eventually converged on a similar feature set, but their origins still define how the products work.
Datadog is modular and composable. It began with infrastructure monitoring and added APM, logs, RUM, synthetics, security, CI visibility, database monitoring, and incident response as separate products. A company can adopt infrastructure monitoring this quarter and APM next quarter. That gives platform teams granular control over rollout, instrumentation, sampling, indexing, retention, and product ownership. The trade-off is more configuration surfaces and more billing units as the deployment expands.
Dynatrace is integrated and automated. OneAgent is designed to discover supported processes, services, and dependencies from a host deployment and continuously build a topology of the environment. Telemetry flows into Grail and is queried with DQL; Dynatrace Intelligence uses topology and event context to group problems, estimate impact, and suggest probable cause. The trade-off is a more opinionated platform and a greater dependence on OneAgent coverage, the entity model, and consumption governance.
The most useful mental model is simple: Datadog gives you a powerful toolbox that your team assembles; Dynatrace gives you a more assembled system that expects the team to work through its model.
Feature-by-feature overview
The two products overlap heavily across infrastructure, logs, APM, RUM, synthetics, application security, SSO, RBAC, and compliance. The meaningful differences are depth, default workflow, packaging, deployment, and metering.
| Capability | Datadog | Dynatrace |
|---|---|---|
| Infrastructure monitoring | ✅ Complete, with multiple entry points and tag-driven navigation | ✅ Complete, with topology and automatic discovery at the center |
| Log management | ✅ Collection, indexing, Flex, archives, and retention are controlled separately | ✅ OneAgent, OpenPipeline, and Grail provide a more integrated path |
| OpenTelemetry | ✅ Agent, DDOT, standard Collector, direct, and hybrid paths | ✅ OTLP, Collector, OneAgent, and hybrid paths |
| APM | ✅ More investigation entry points and granular instrumentation control | ✅ OneAgent automation and topology-led investigation stand out |
| RUM and Session Replay | ✅ Complete, with separate session and replay meters | ✅ Complete, with separate session and replay meters |
| Incident management | ✅ Incident Management, On-Call, workflows, timelines, and postmortems | ◐ Problems and Workflows at the center, often connected to external incident tools |
| Status pages | ✅ Public and internal Status Pages | ◐ Confirm the external status-communication workflow and integrations |
| Cloud security operations | ✅ Cloud SIEM and a broader security-operations workflow | ◐ More focused on runtime and application-security context |
| Application security | ✅ Broad code, cloud, and workload portfolio | ✅ Runtime vulnerability analysis and protection stand out |
| SAML SSO, RBAC, compliance | ✅ | ✅ |
| Customer-hosted complete platform | Not publicly offered; BYOC Logs covers only the log data plane | ✅ Dynatrace Managed runs on customer infrastructure |
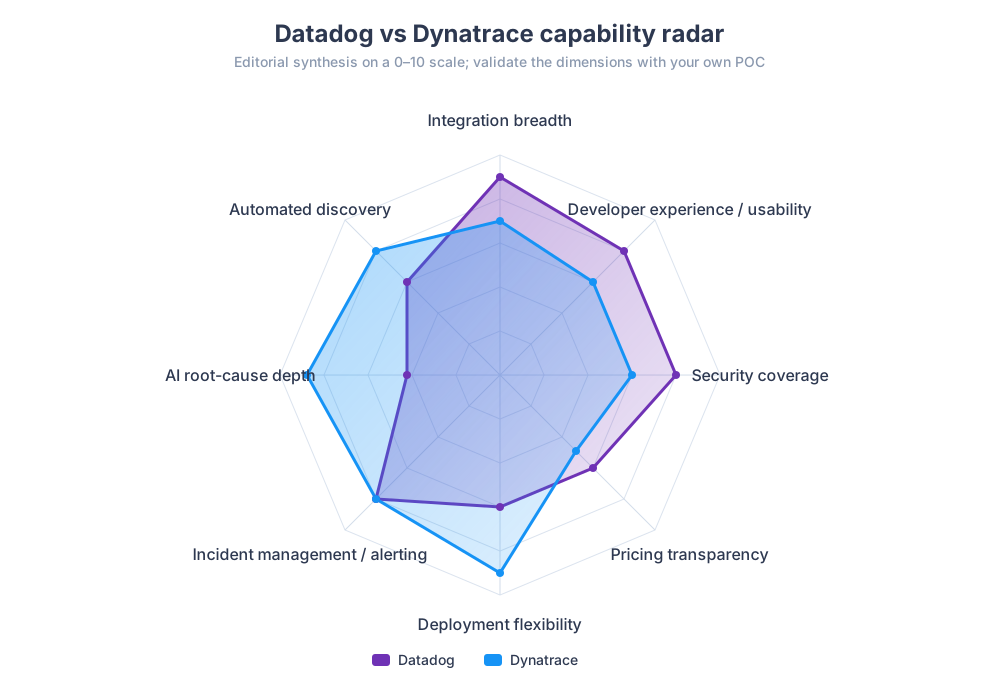
The core signals are no longer the deciding factor. The real question is whether Datadog gives the team enough control without creating too much operational and billing complexity, or whether Dynatrace can turn automatic discovery and topology into answers without creating too much platform dependence and consumption risk.
Setup and deployment: Dynatrace automates more; Datadog exposes more control
Deployment is where the difference becomes immediately visible. Dynatrace OneAgent discovers supported processes, services, and technologies and connects hosts, process groups, services, and dependencies into a topology. Infrastructure, logs, and APM can then be configured inside the same environment model. This discover-first experience is attractive during a trial, but technology coverage, automatic collection scope, and the resulting consumption need to be governed from day one.
Datadog's Agent installation is similarly mature, but its collection paths are more distributed and more controllable. The infrastructure Agent, log collection, language tracers, Single Step Instrumentation, and OpenTelemetry can be combined service by service and environment by environment. That provides more room to tailor data collection, but it also requires consistent service, environment, version, sampling, log-injection, and tagging standards.
Datadog's official directory lists more than 1,000 integrations. Dynatrace describes support for hundreds of technologies and extensions, but a simple count does not show collection depth, supported versions, dashboards, or operational quality. Buyers should validate the exact technologies that matter.
The complete Datadog platform is still primarily SaaS. BYOC Logs can place the log data plane in customer infrastructure, but it is not a self-hosted version of the full platform. Dynatrace offers SaaS and Managed; Managed runs in customer-provided infrastructure and is remotely managed through Dynatrace Mission Control. For finance, healthcare, government, and strict data-residency requirements, that difference can determine the shortlist before feature scoring begins.
APM and tracing: Dynatrace leads on automatic context; Datadog on control
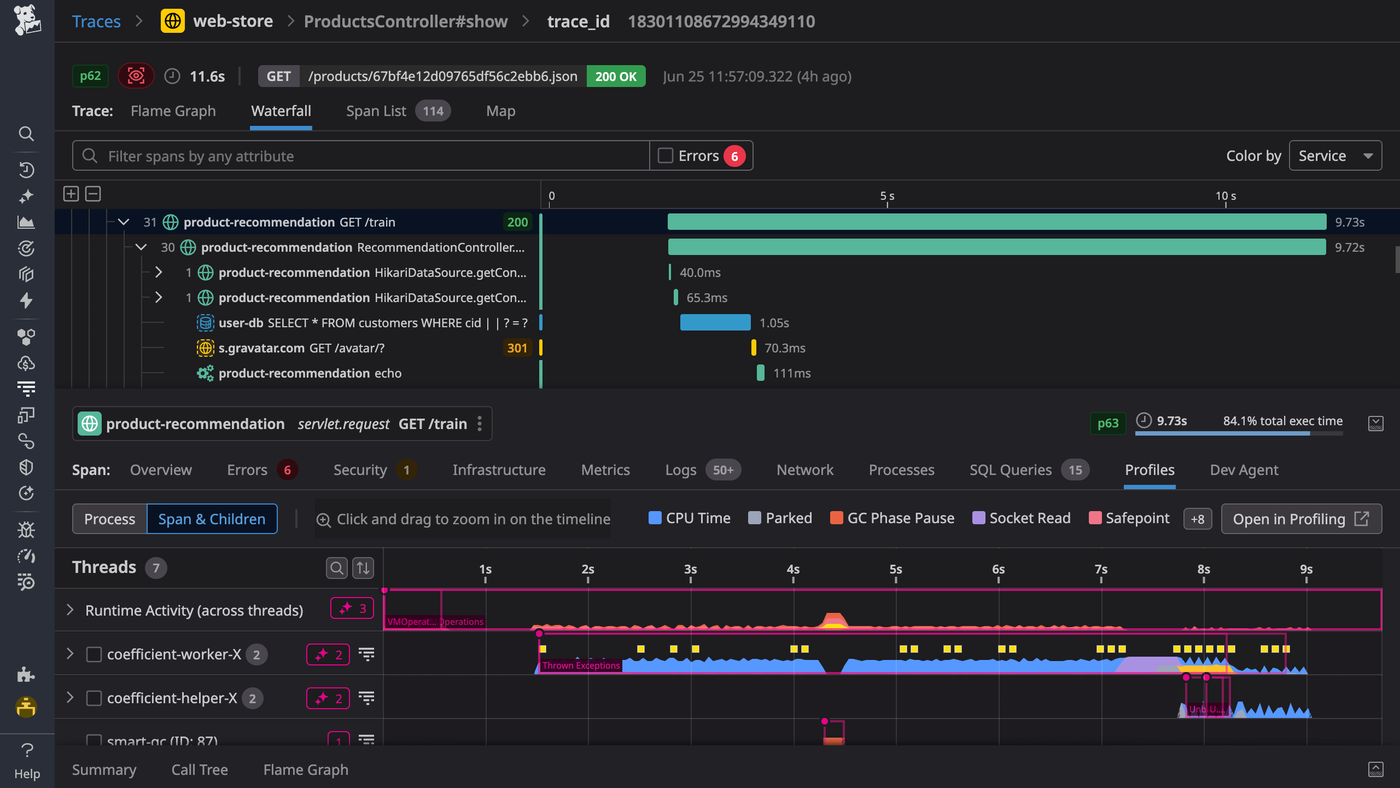
APM is Dynatrace's traditional stronghold. PurePath tracing through OneAgent can automatically instrument supported Java, .NET, Node.js, Go, PHP, and other runtimes without requiring each application team to add a library manually. Dynatrace can attach topology, affected entities, and likely cause to an application problem. Better Stack's Ubuntu comparison also rated Dynatrace more strongly for APM in that particular environment. That result is not universal, but it creates a useful POC hypothesis for large environments that value automated discovery and topology-led diagnosis.
Datadog APM wins on control and the surrounding developer toolchain. Engineers can tune sampling, span tags, and trace scope; Continuous Profiler adds production CPU, memory, and I/O analysis; Service Catalog and Data Streams Monitoring extend the service and streaming-data workflow. Universal Service Monitoring uses eBPF to discover services without code-level instrumentation. Datadog is more flexible for mixed-language environments and teams that want custom instrumentation; Dynatrace is more attractive when the goal is to obtain broad supported coverage with less per-service configuration.
Logs: Dynatrace unifies the data model; Datadog exposes storage choices
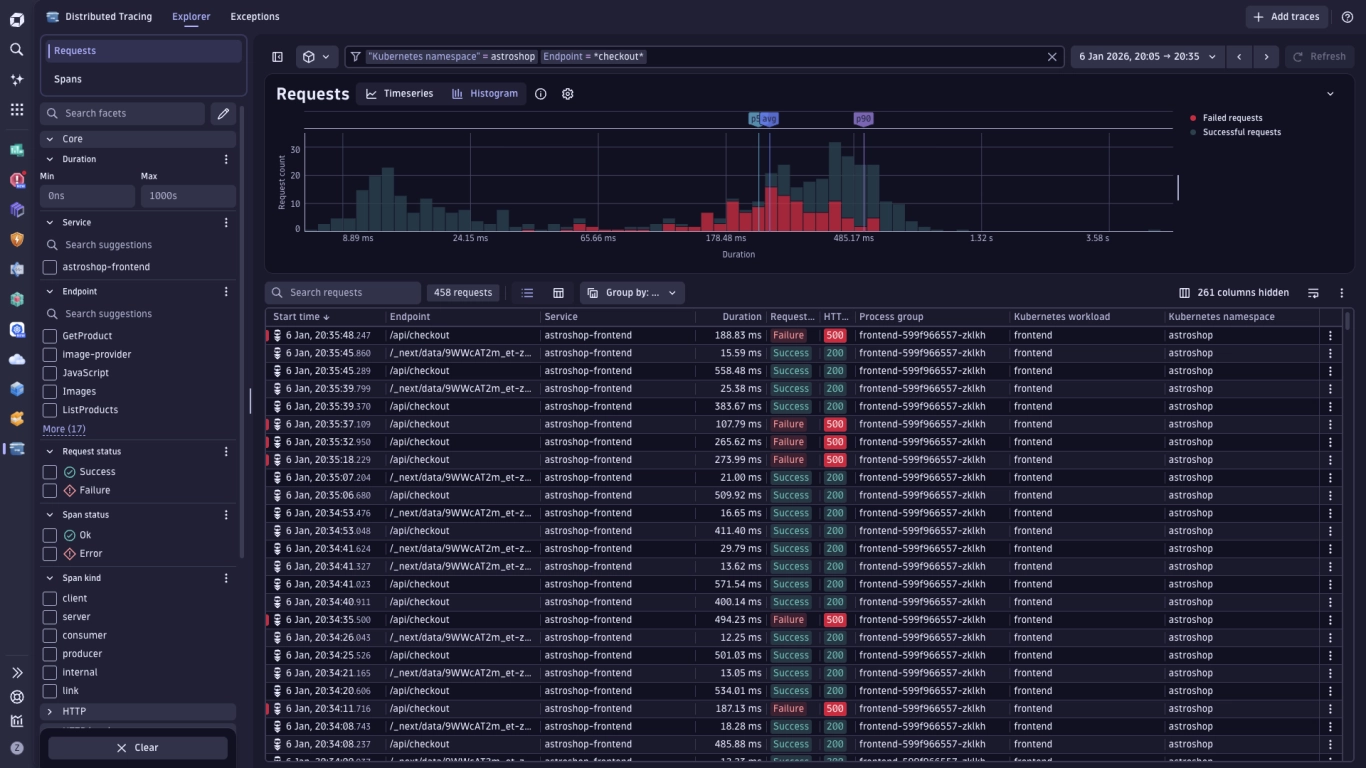
Dynatrace log management is built on Grail. Logs, metrics, traces, and events can be stored with topology context and queried with DQL. OneAgent can discover supported log sources, OpenPipeline processes and routes data, and Grail buckets control retention. Public pricing separates log ingest and processing, retention, and query usage, so Full-Stack Monitoring should not be interpreted as unlimited Log Analytics.
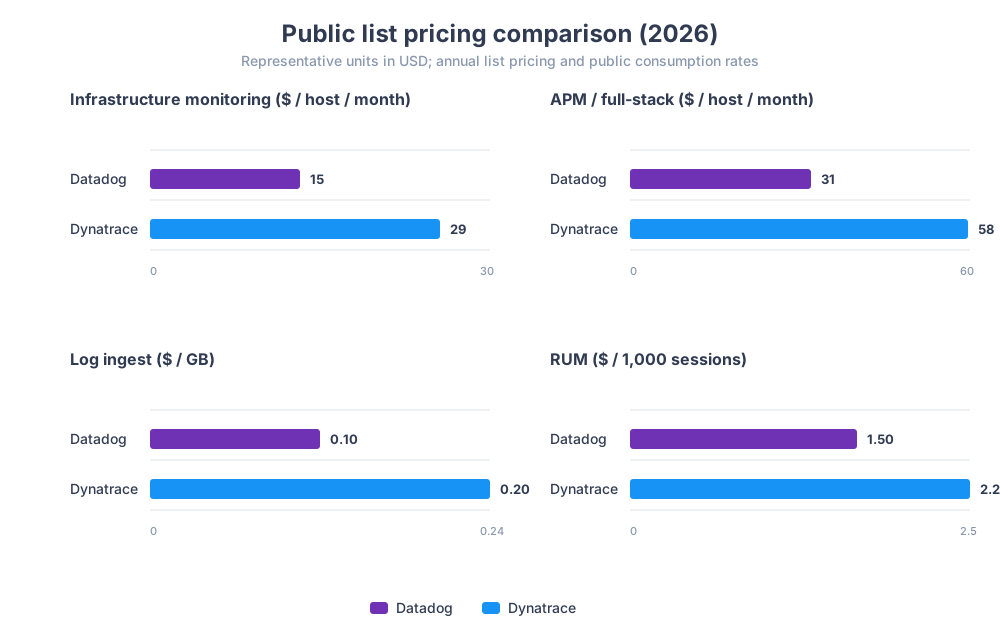
Datadog separates ingest from indexing and storage choices. Public list pricing shows log ingest at $0.10 per GB, with standard indexing, Flex Logs, archives, and rehydration available for different query and retention needs. This gives teams a strong cost-control lever, but it also makes routing and billing harder to understand. Logs excluded from standard indexing are not automatically lost: searchability depends on whether they are routed to Flex Logs, archives, rehydration, or BYOC Logs.
Datadog's Live Tail, pattern clustering, and trace-log-metric pivots are strong investigation tools. BYOC Logs can place the log data plane in customer infrastructure, while Datadog SaaS continues to provide the control plane. Dynatrace offers a more unified Grail model; Datadog exposes more explicit storage and indexing choices.
User experience: Datadog is easier to explore; Dynatrace is more opinionated
Third-party hands-on reviews describe a trade-off rather than a clean winner. Dynatrace can start collecting and mapping more of the environment automatically, but the resulting interface presents more data, entities, and specialized terminology at once. The learning curve is real, especially for engineers who do not already think in Dynatrace's entity and problem model.
Datadog's interface is generally easier to explore from several directions. Engineers can start from Event Explorer, a service, a host, a monitor, a dashboard, a trace, a database, or a user session. Its Learning Center also offers browser-based labs. The trade-off is that a clean interface does not remove the need to configure instrumentation, tags, correlations, and product boundaries.
This difference reflects the vendors' histories: Datadog grew from a developer-oriented cloud monitoring product into an enterprise platform; Dynatrace grew from enterprise APM and operations-center workflows toward a broader developer experience.
AI: Dynatrace emphasizes causal context; Datadog spreads AI across workflows
Dynatrace: causal analysis at the center
Dynatrace organizes its AI story around Davis and Dynatrace Intelligence. Causal AI uses topology and entity relationships to explain dependencies between events; predictive models support forecasting and capacity use cases; generative capabilities help users query and interpret data. In a cascading distributed-system failure, the goal is not merely to list alerts that happened at the same time, but to explain which component most likely failed first and which services and users were affected.
The value depends on data and topology completeness. Dynatrace documentation acknowledges that root-cause analysis can be incomplete when information is missing and that events may form separate Problems when timing or topology does not connect them. Davis should therefore be understood as a way to narrow the search space, not as proof that every proposed cause is correct. Traces, logs, deployments, and other evidence still need to confirm the conclusion.
Datadog: Watchdog, Bits AI, and a broader Agent portfolio
Datadog's AI system looks more like a set of assistants distributed across workflows. Watchdog detects supported anomalies and changes. Bits Investigation forms hypotheses around an alert, gathers telemetry, and suggests next steps. Event Management correlates related events. Bits AI SRE, Security Analyst, and development-oriented Agents push investigation, remediation, and security triage further into the workflow.
Datadog is also investing heavily in LLM Observability and Agent Observability, including model and tool calls, latency, cost, errors, and Agent decision paths. The strategic difference is clear: Datadog emphasizes broad coverage, conversational assistance, and developer workflows; Dynatrace emphasizes topology, causal analysis, and operational automation. Public information does not provide a reproducible benchmark proving that either platform's AI is universally more accurate.
Security: Datadog is broader; Dynatrace goes deeper into runtime context
Both vendors are expanding into security, but from different directions.
Datadog follows a breadth-first security strategy. Its portfolio includes Cloud SIEM, application security, cloud security posture management, Kubernetes security posture, workload protection, and sensitive-data scanning. The core idea is to reuse observability telemetry and workflows for detection, investigation, cases, risk context, and response. That gives Datadog a broader security-operations story for teams that want cloud, application, and observability evidence in one console.
Dynatrace follows a runtime-depth strategy. Runtime Vulnerability Analytics, Runtime Application Protection, and security-posture capabilities use OneAgent context to identify code and third-party vulnerabilities, prioritize risks based on the running environment, and protect against supported attack patterns. The strength is context from actual applications, dependencies, and exposure rather than a general-purpose SOC workflow.
In short, Datadog looks more like an observability-native security-operations platform; Dynatrace looks more like runtime armor built from APM context. Whether either platform can replace an existing SIEM or CNAPP must be validated against asset discovery, identity, network, compliance, data-source, retention, and response requirements. A category label is not enough.
Incident response: Datadog offers the broader native loop
Incident response is one of the clearest differences, and the product landscape has changed. Datadog now provides native On-Call schedules and escalation policies as well as Status Pages. Combined with Incident Management, Monitors, workflows, timelines, ownership, stakeholder updates, and postmortems, Datadog can keep more of the detect-page-coordinate-communicate-review loop inside one platform. These capabilities are separately packaged, so the complete response stack needs to be included in pricing.
Dynatrace centers its response workflow on Davis events, Problems, and Workflows. The platform groups related anomalies, suggests probable cause and impact, and then uses Workflows to notify external systems or run configured automation. Scheduling, escalation, and broader incident coordination are commonly handled through integrations with PagerDuty, Opsgenie, ServiceNow, Slack, and other systems.
For an organization that already has a mature incident stack, that separation may be acceptable or desirable. For a team trying to reduce the number of operational tools, Datadog currently provides the broader native response loop.
Pricing: there is no honest winner without the same workload
Datadog: modular products and multiple meters
Datadog does not have one platform price. Each product has its own unit, and the final bill is the sum of enabled modules and usage. Current public annual list pricing includes $15 per host per month for Infrastructure Pro. APM is $31 per host per month when paired with Infrastructure Monitoring, $36 as a standalone annual plan, and $40 for Enterprise. Each APM host includes defined ingested-span and indexed-span allowances before additional usage charges.
Logs add ingest and then an indexing, Flex, archive, and retention choice. RUM Measure starts at $0.15 per 1,000 sessions; Investigate, Session Replay, synthetics, database monitoring, custom metrics, and Incident Response use separate meters. The advantage is that a team can start with a narrow product set. The risk is that billing dimensions and governance rules multiply as more of the platform is adopted.
Cost governance is therefore more important than memorizing one price list. Buyers need to confirm the host-billing model in the contract, control high-cardinality tags, route logs to the appropriate search and retention tier, review APM sampling and indexing, and track every newly enabled product that creates a separate meter.
Dynatrace: DPS and shared consumption
Dynatrace uses the Dynatrace Platform Subscription (DPS) consumption model. Customers make an annual commitment and platform capabilities consume from a shared rate card. Usage can continue after the commitment is reached; Dynatrace says there is no additional overage premium, although the extra usage itself continues to be billed. Public documentation does not publish one universal minimum contract value or discount range, so enterprise buyers need a written quote.
Public rates list Full-Stack Monitoring at $0.01 per memory-GiB-hour, which is about $58 per month for a continuously monitored 8 GiB host. Infrastructure Monitoring is approximately $0.04 per host-hour. Full-Stack includes infrastructure, APM, code-level analysis, topology, and defined trace and custom-metric allowances. Logs, RUM, replay, synthetics, retention, and query usage still have separate meters.
The advantage is deeper capability inside one Full-Stack unit. The risk is memory-weighted billing and broad automatic collection. A 32 GiB host costs roughly four times the base amount of an 8 GiB host, so JVM workloads, in-memory databases, and high-density hosts need separate modeling. Log ingest, retention, query budgets, and high-memory systems should be governed from the first day.
A like-for-like TCO scenario
Put the public rates against the same workload: 100 continuously monitored 8 GiB hosts plus 50 TB of logs per month.
For Datadog, Infrastructure Pro plus paired APM starts at 100 × ($15 + $31) = $4,600 per month. Fifty thousand GB of log ingest adds $5,000, producing a visible starting subtotal of $9,600 before indexing or Flex, retention, excess traces, RUM, synthetics, Incident Response, support, taxes, and discounts.
For Dynatrace, Full-Stack Monitoring starts at 100 × 8 × 730 × $0.01 = $5,840 per month. Fifty decimal TB is about 46,566 GiB, so log ingest and processing adds roughly $9,313, producing a starting subtotal of $15,153 before retention, queries, RUM, synthetics, support, taxes, and discounts.
This is not a vendor quote. It demonstrates why a host-only comparison can reverse after the same log workload is added. Datadog can start lower with a narrow set of modules; Dynatrace includes more in the Full-Stack unit. The cheaper option depends on host memory, telemetry volume, retention, sessions, tests, incident-response seats, and contract terms. A valid TCO comparison uses the same 30-day dataset, sampling, retention, region, support, and migration-overlap costs.
APAC deployment, data residency, and total cost
Datadog publicly lists the AP1 Japan and AP2 Australia SaaS Sites. It does not publicly list a dedicated Singapore, South Korea, Hong Kong, or Macau Site. Dynatrace publicly lists AWS Sydney, while AWS Singapore and AWS Tokyo are available on request; Dynatrace Managed provides a customer-infrastructure path.
The workload location is not the telemetry-storage location. Before signing, APAC buyers should obtain written answers for primary storage, backups, support access, cross-border data movement, network egress, and operating responsibility. The Datadog pricing guide for Singapore and the Dynatrace DPS pricing guide for Singapore show how those regional assumptions flow into a cost model.
This is also where Guance can change the shortlist for an APAC evaluation. Guance offers public-cloud pricing organized around the telemetry data volume sent, an AWS Singapore Commercial Site, and private-deployment options. Validate the target region, residency, support, and contract terms against the same workload before treating those deployment choices as equivalent.
Use the same service, 30-day telemetry set, sampling, retention, region, and support scope when comparing the three options. The Datadog vs. New Relic comparison is the adjacent buyer guide for teams evaluating a second alternative.
What users consistently say
Across G2, Gartner Peer Insights, TrustRadius, Reddit, and third-party comparisons, the Datadog themes are highly consistent. Users praise the ability to bring logs, metrics, and traces into one interface, the 1,000-plus integration ecosystem, dashboards, and flexible investigation entry points. The most common complaints are cost growth at scale, too many billing dimensions, and the governance burden created by adopting more modules.
Dynatrace is praised most often for OneAgent automation, topology, and automated root-cause analysis in complex environments. The most common complaints are interface density, terminology, learning curve, and budget volatility when consumption is not governed. Community feedback is useful for identifying POC questions, but it cannot replace a test on the same workload.
Company and market context
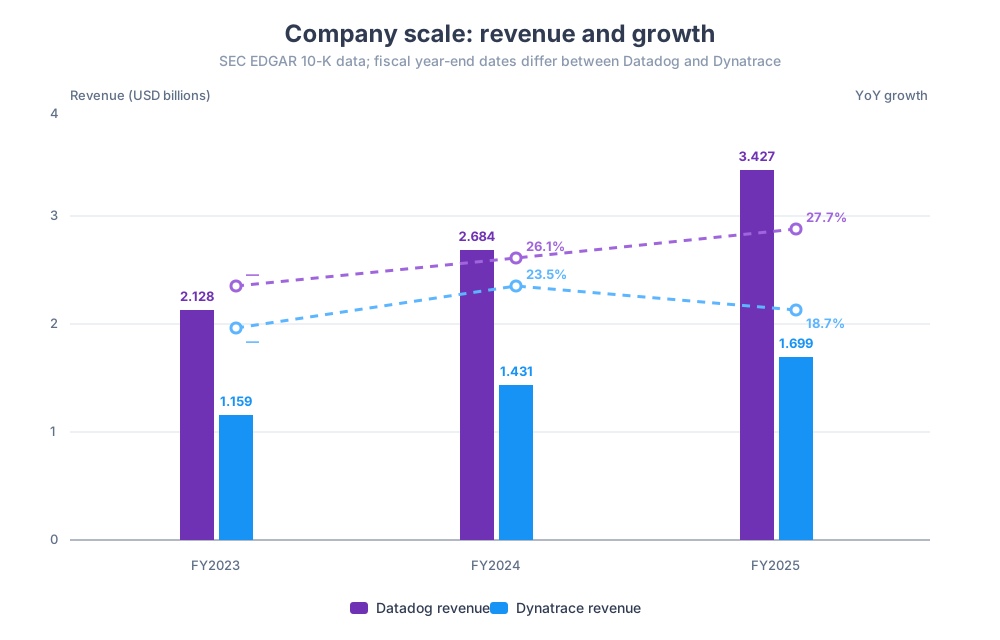
Datadog (NASDAQ: DDOG) was founded in 2010 and positions itself as a monitoring and security platform for cloud applications. It is delivered primarily as SaaS and became a public company in 2019. According to its 2025 annual report, Datadog generated $3.427 billion in revenue, up 28% from $2.684 billion in 2024. Its high research and development spend matches the company's expansion into AI Agents, LLM observability, software delivery, and security.
Dynatrace (NYSE: DT) has a longer enterprise APM history and now positions itself as an AI-powered software intelligence platform. It offers SaaS as well as Dynatrace Managed. According to its fiscal 2026 annual report, Dynatrace generated $2.018 billion in revenue, up 19% year over year, and reported $245 million in GAAP income from operations.
The financials show that both vendors can continue investing heavily. They should not decide a technical purchase. Datadog is expanding across more product categories at a faster rate; Dynatrace maintains a more concentrated enterprise-platform strategy and stronger operating profitability.
Which should you choose?
The decision can be compressed into one sentence: choose Datadog when the bottleneck is coverage, integrations, and developer control; choose Dynatrace when the bottleneck is too many dashboards and too few answers.
| Decisive factor | Lean toward |
|---|---|
| Broadest integration ecosystem and modular platform coverage | Datadog |
| Automatic instrumentation and discovery across large estates | Dynatrace |
| Multiple investigation entry points and developer-oriented navigation | Datadog |
| Topology-led root-cause analysis | Dynatrace |
| Self-service rollout and incremental module adoption | Datadog |
| Real-time dependency mapping as the default model | Dynatrace |
| Native incident-response loop, including On-Call and Status Pages | Datadog |
| Customer-infrastructure deployment | Dynatrace Managed |
| Broad Cloud SIEM and security-operations workflow | Datadog |
| Runtime application vulnerability analysis and protection | Dynatrace |
| Kubernetes and cloud-native environments | Both are credible; validate the preferred operating model |
| Large hybrid estates and legacy enterprise systems | Dynatrace often fits the default model better |
Three implementation recommendations apply to either choice.
First, run a bounded trial with real traffic. Select 10–20 hosts that carry a critical service and replay an incident the team already understands. Measure the path from symptom to evidence, judgment, and action.
Second, use OpenTelemetry where it genuinely improves portability. It can reduce reinstrumentation, but semantic mapping, topology, sampling, dashboards, alerts, retention, and cost still need to be rebuilt or validated. Migration is not simply an exporter change.
Third, treat cost governance as part of rollout. For Datadog, watch product sprawl, high cardinality, and log tiers. For Dynatrace, watch high-memory systems, automatic collection, logs, retention, and query consumption.
Product capabilities and prices were reviewed against public information available on August 4, 2026. Both platforms change quickly, so final purchasing decisions should use current vendor documentation and a written quote. The conclusions above interpret documented workflows and buyer consequences; they are not a controlled performance ranking. Guance publishes this article and competes with both vendors.
Sources
- Datadog Application Performance Monitoring
- Datadog public price list
- Datadog APM billing
- Datadog custom metrics billing
- Datadog Agent setup
- Datadog integrations directory
- Datadog host log collection
- Datadog OpenTelemetry documentation
- Datadog Incident Response
- Datadog Sites
- Dynatrace Application Observability
- Dynatrace public pricing
- Dynatrace Full-Stack consumption
- Dynatrace OneAgent
- OpenTelemetry and Dynatrace
- Dynatrace OTLP API
- Dynatrace root-cause analysis concepts
- Dynatrace data security controls and SaaS regions
- Dynatrace Managed
- Guance pricing
- OpenTelemetry to DataKit
- Guance Commercial Plan sites
- Guance deployment options
- Better Stack: Datadog vs. Dynatrace
- Datadog Cloud SIEM
- Datadog Status Pages
- Datadog Bits AI Agents
- Datadog Bits Security Analyst
- Dynatrace Davis AI
- Dynatrace AI models
- Dynatrace Application Security
- Dynatrace Runtime Application Protection
- Dynatrace DPS licensing
- Datadog 2025 annual report
- Dynatrace fiscal 2026 annual report
- Datadog On-Call
- Dynatrace Problems
- Dynatrace alerting and notifications
- Datadog named a Leader in the 2026 Gartner Magic Quadrant for Observability Platforms
- Dynatrace named a Leader in the 2026 Gartner Magic Quadrant for Observability Platforms
Contact us
Join the community

to join the community
Try Guance
Start online and pay only for what you use.
Get startedChoose a Guance plan