Prometheus Pushgateway 协议上报观测云最佳实践

Pushgateway 介绍
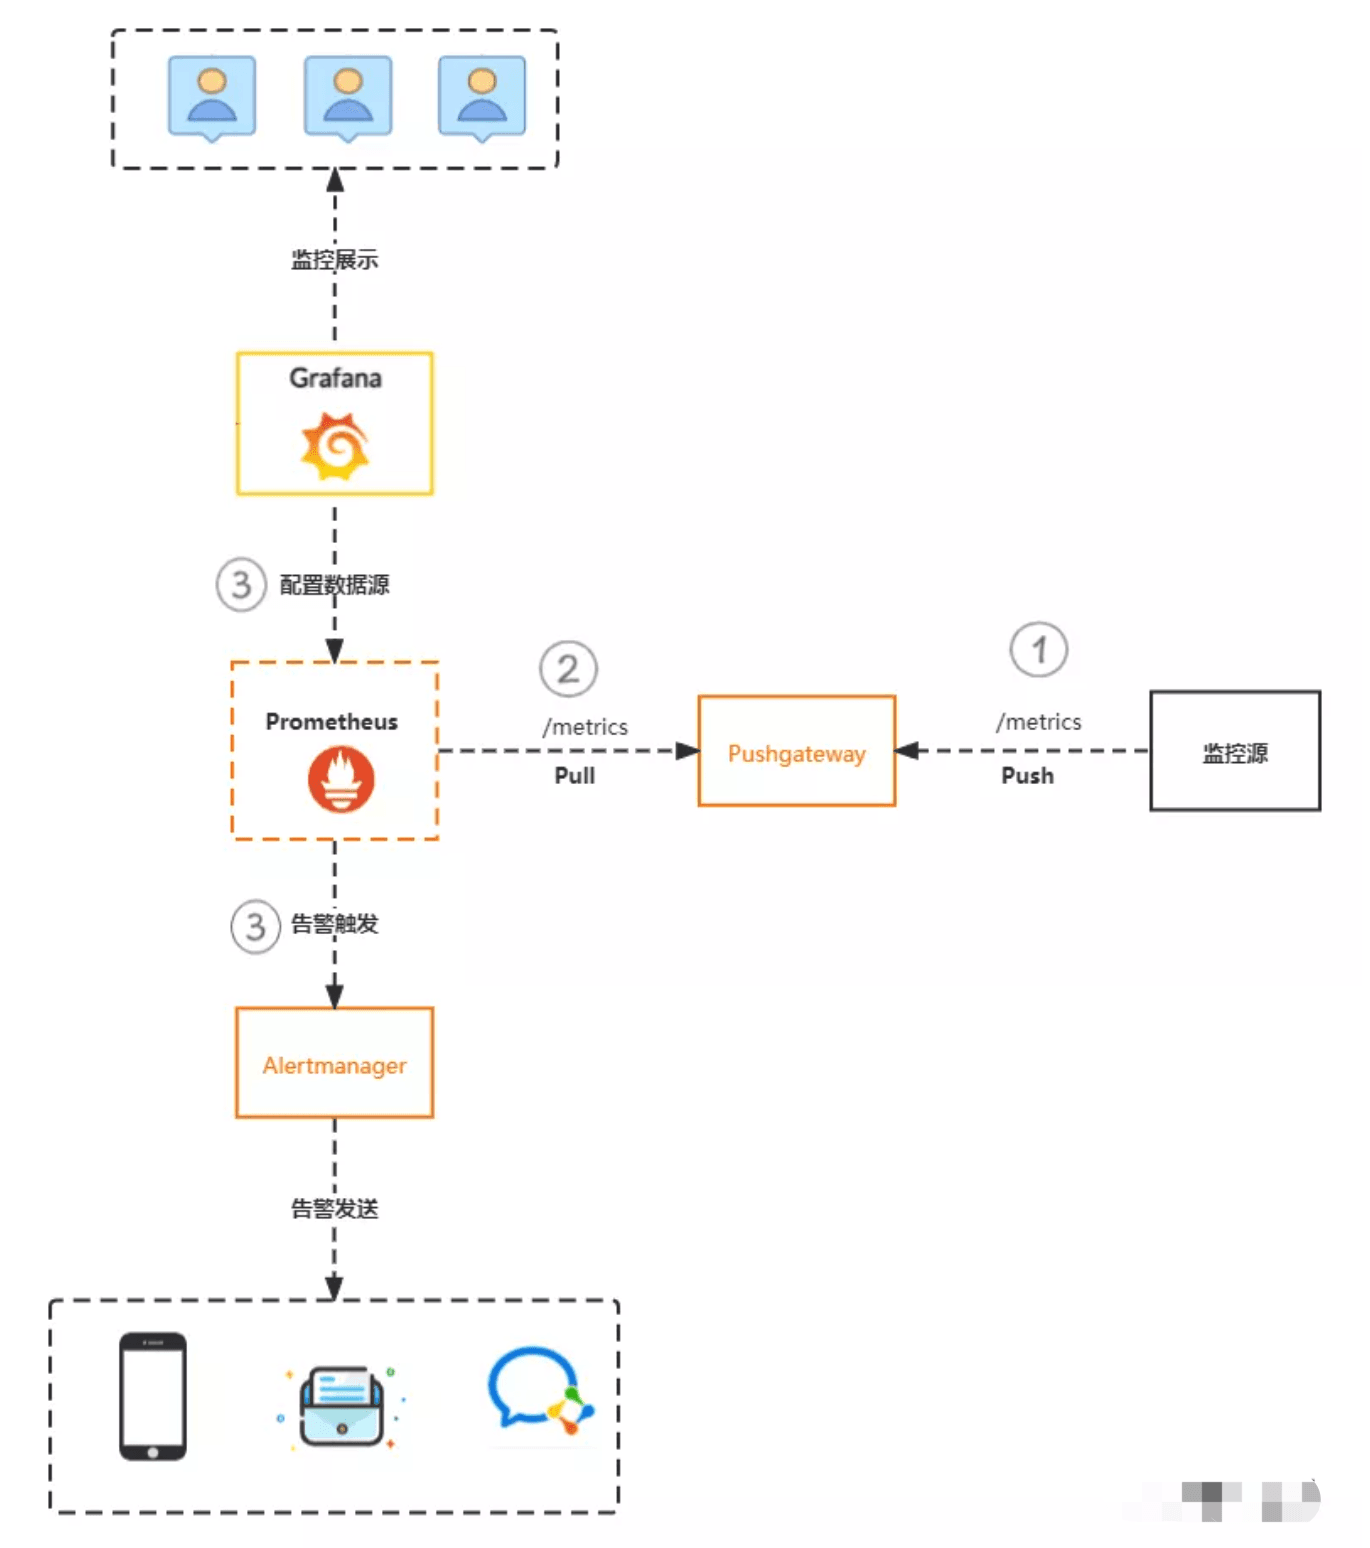
Pushgateway 是 Prometheus 生态系统中的一个组件,主要用于解决 Prometheus 默认的 pull(拉取)模式在某些情况下无法获取数据的问题,如监控源位于防火墙之后,Prometheus 无法穿透防火墙,目标服务没有可抓取监控数据的端点,即时任务执行时间端无法拉取监控指标等。在类似场景中,可通过部署 Pushgateway 的方式解决问题。当部署该组件后,监控源通过主动发送监控数据到 Pushgateway,再由 Prometheus 定时获取信息,实现资源的状态监控。
尽管 Pushgateway 在某些场景下非常有用,但它也有一些缺点需要考虑:
- 单点故障风险:如果 Pushgateway 出现问题,整个采集到的数据都会受到影响。这意味着 Pushgateway 的稳定性和可用性对整个监控系统至关重要。
- 数据清理问题:Pushgateway 可以持久化推送给它的所有监控数据,这意味着即使你的监控已经下线,Prometheus 还会拉取到旧的监控数据。这需要手动清理 Pushgateway 中不需要的数据,增加了维护的复杂性。
- 监控状态不准确:Prometheus 拉取状态 up 只针对 Pushgateway,而不能对每个节点都有效。这可能导致监控数据的准确性受到影响。
使用 DataKit 替换 Pushgateway
DataKit 是观测云的统一采集器,利用 DataKit 上报 Pushgateway 协议的数据可以解决 Pushgateway 组件的缺点,实现高可用,监控状态一致的指标上报体验。
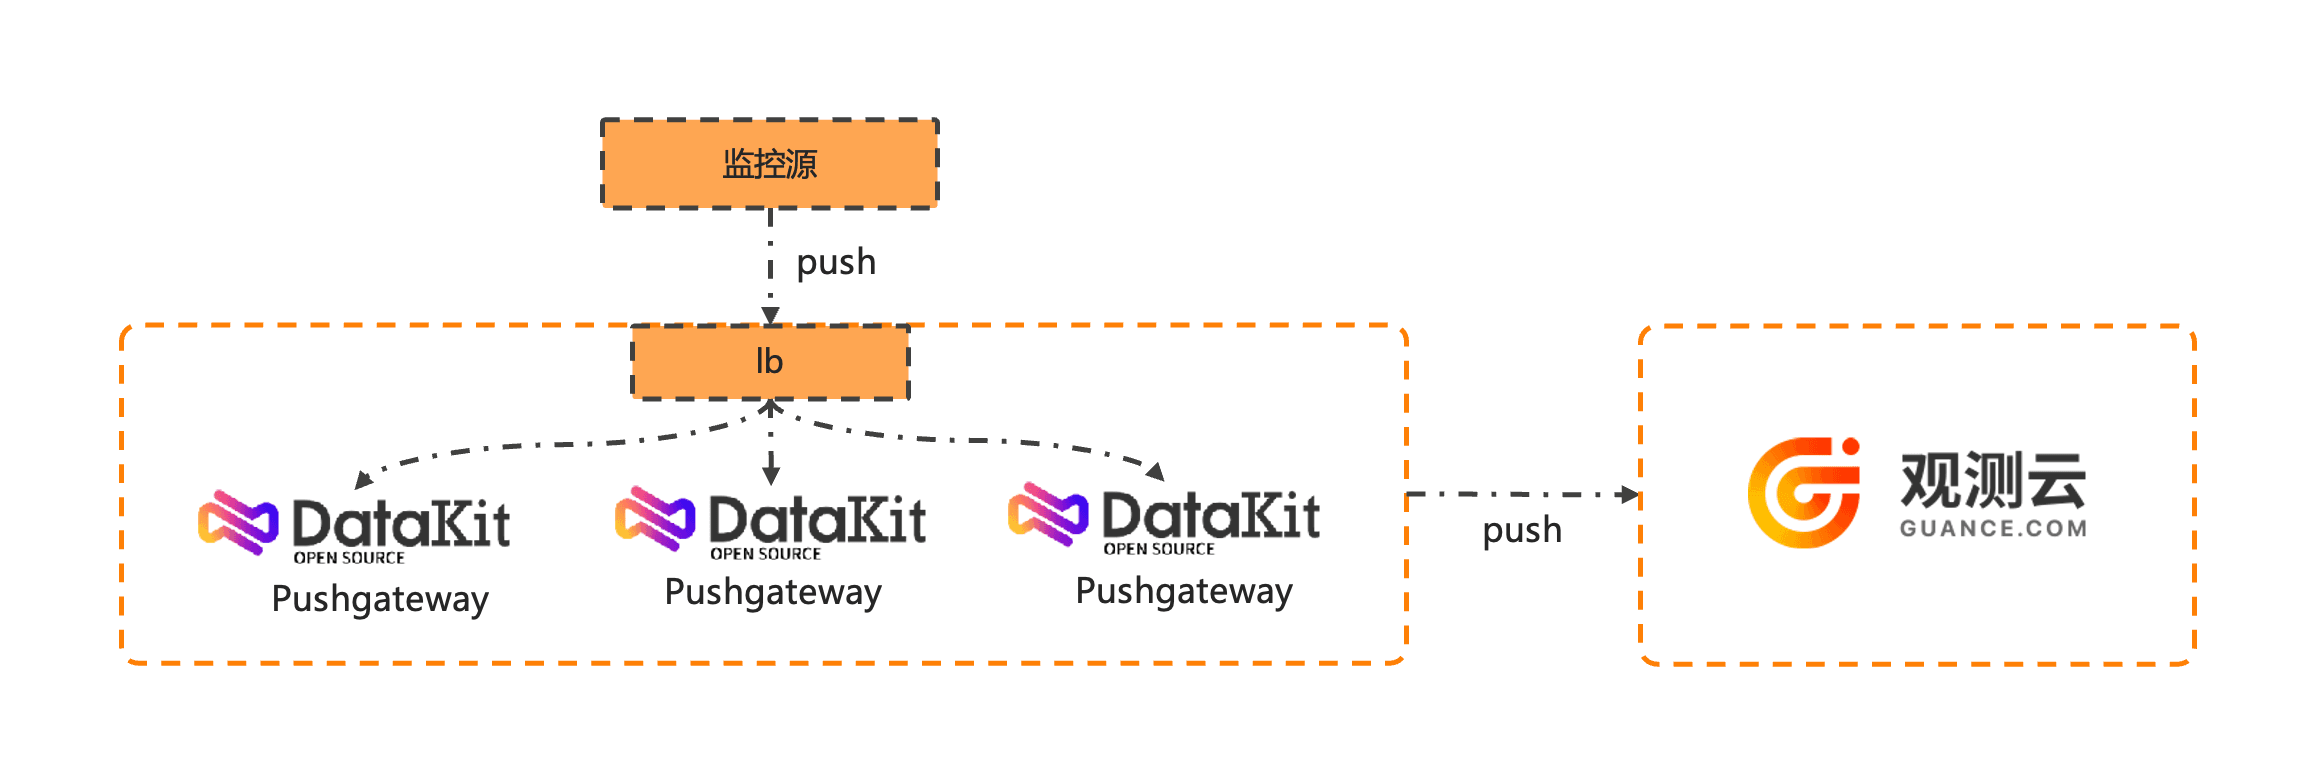
同 Prometheus 通过 pull 方式采集 Pushgateway 方式不同,观测云 DataKit 完全采用 push 方式上报指标,这样可以实现上报高可用,维护配置方便,监控状态和数据清理问题也不复存在。具体步骤如下:
安装 DataKit
开启 Pushgateway 采集器
- 主机环境
cd /usr/local/datakit/conf.d/pushgateway
cp pushgateway.conf.sample pushgateway.conf
pushgateway 配置修改如下:
[[inputs.pushgateway]]
  ## Prefix for the internal routes of web endpoints. Defaults to empty.
  # 目标路由会变成 "/pushgateway/metrics"
  route_prefix = "/pushgateway"

  ## Measurement name.
  ## If measurement_name is not empty, using this as measurement set name.
  # measurement_name = "prom_pushgateway"

  ## If job_as_measurement is true, use the job field for the measurement name.
  ## The measurement_name configuration takes precedence.
  job_as_measurement = true

  ## Keep Exist Metric Name.
  ## Split metric name by '_', the first field after split as measurement set name, the rest as current metric name.
  ## If the keep_exist_metric_name is true, keep the raw value for field names.
  keep_exist_metric_name = true
重启 DataKit
datakit service -R
- k8s 环境
    # ..other..
    spec:
      containers:
      - name: datakit
        env:
        - name: ENV_DEFAULT_ENABLED_INPUTS
          value: dk,cpu,container,pushgateway  # 添加 pushgateway,开启采集器
        - name: ENV_INPUT_PUSHGATEWAY_ROUTE_PREFIX
          value: /pushgateway               # 选填,指定 endpoints 路由前缀,目标路由会变成 "/pushgateway/metrics"
        - name: ENV_INPUT_PUSHGATEWAY_JOB_AS_MEASUREMENT
          value: "true"
    # ..other..
上报 Pushgateway 数据
使用如下命令上报 Pushgateway 协议数据。
i=100;
while true;
do
  ## 定期使用 cURL 命令向 Datakit Pushgateway API 发送数据
  echo -e "# TYPE pushgateway_count counter\npushgateway_count{name=\"client\"} $i" | curl --data-binary @- http://127.0.0.1:9529/pushgateway/metrics/job/pushgateway;
  i=$((i+1));
  sleep 2;
done
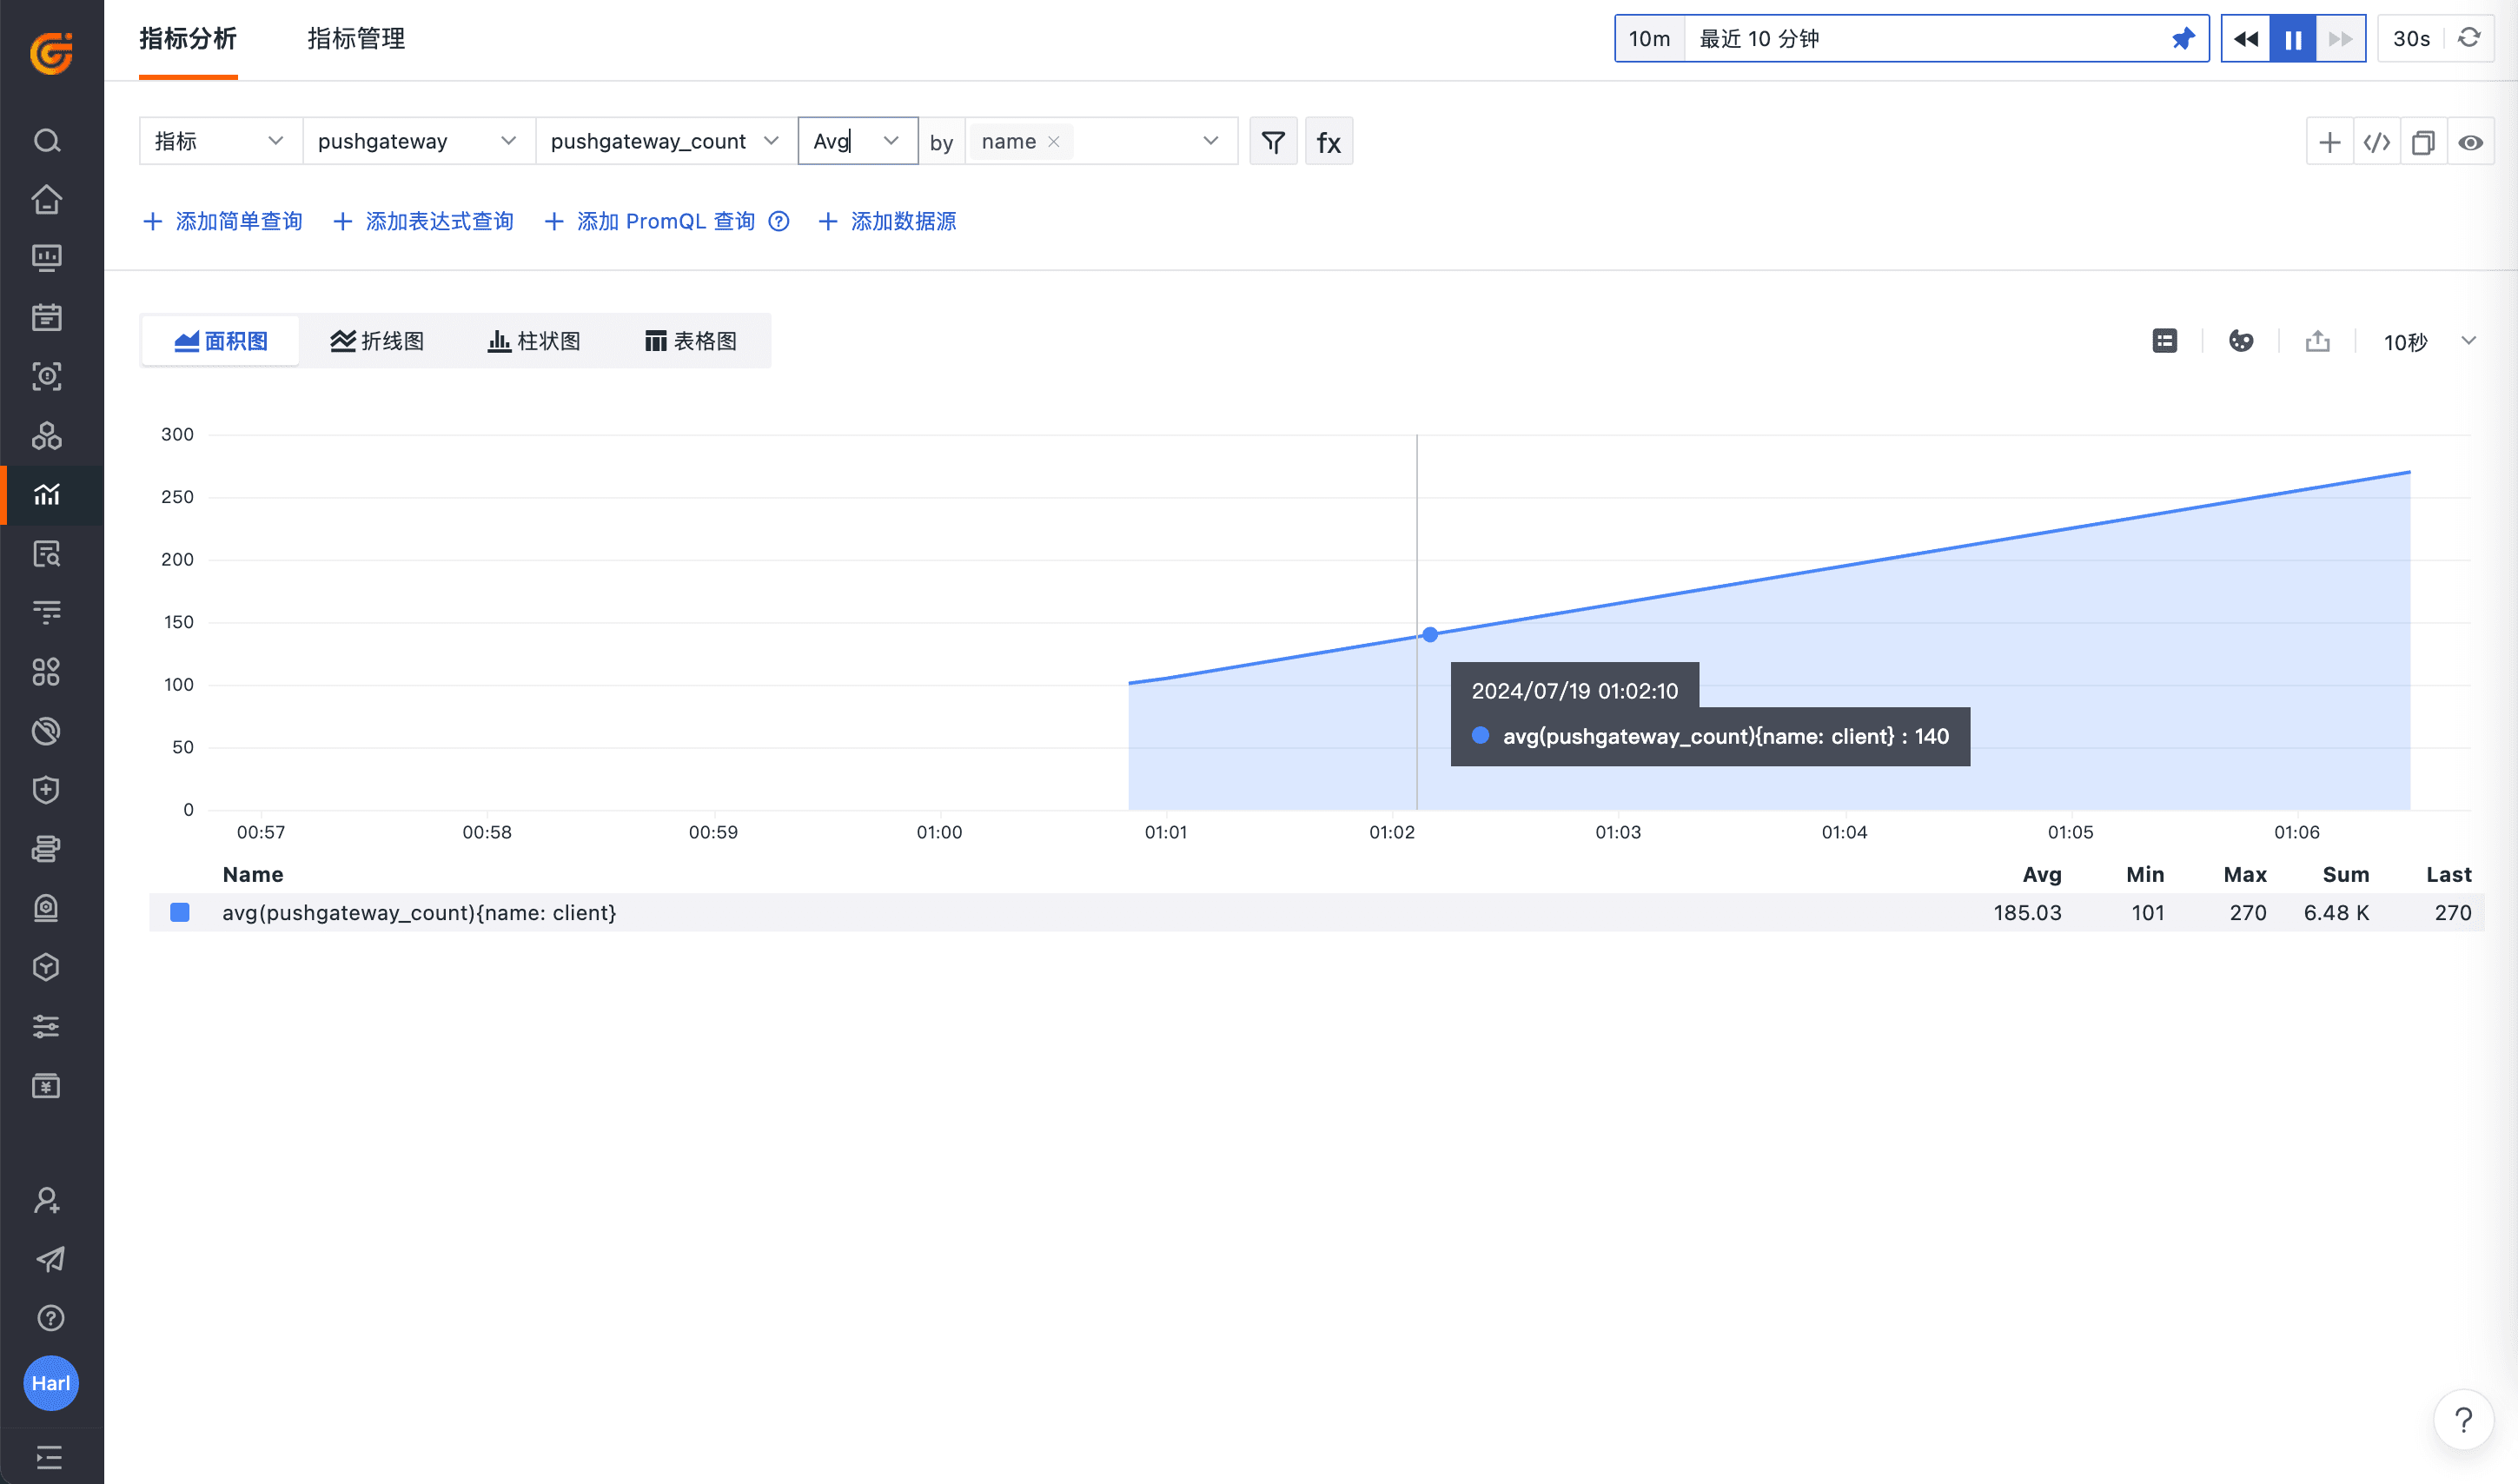
实现效果
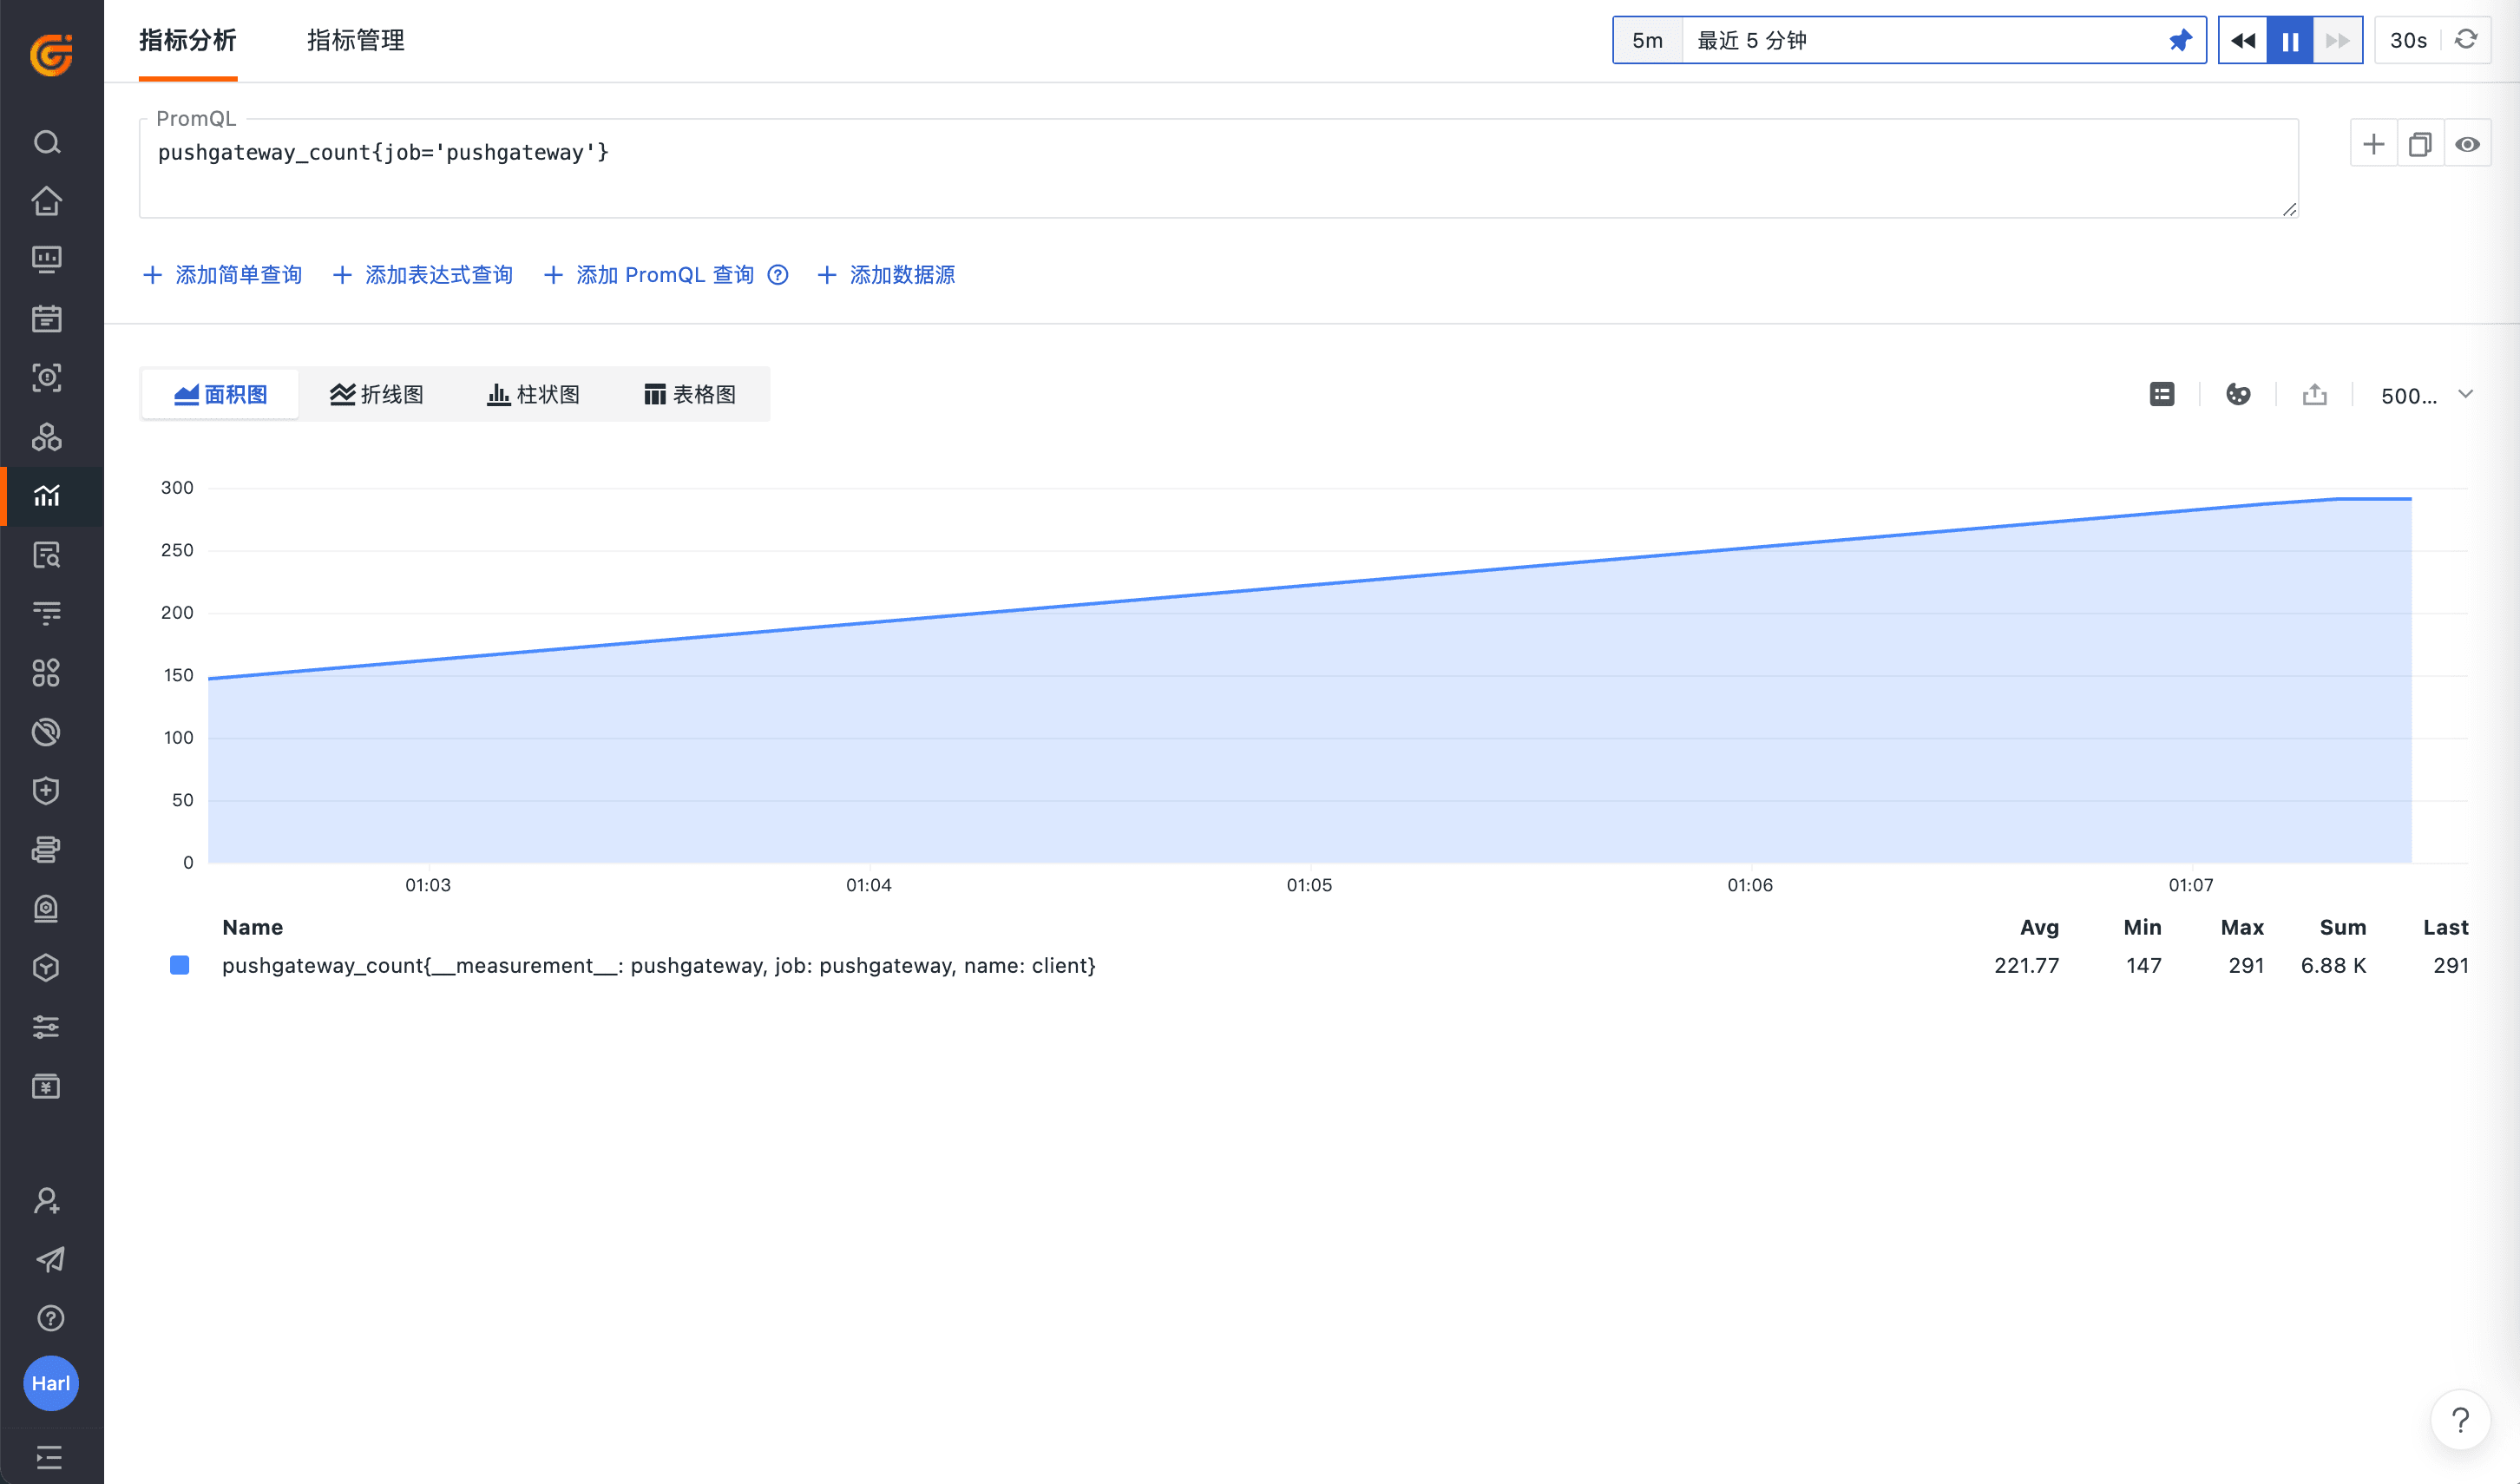
默认会上报至 pushgateway 指标集,通过观测云指标面板即可查询指标数据,也可通过 promQL 查询上报的指标数据。
参考资料