MongoDB 可观测性最佳实践

MongoDB 介绍
MongoDB 是一个高性能、开源的 NoSQL 数据库,它采用灵活的文档数据模型,非常适合处理大规模的分布式数据。MongoDB 的文档存储方式使得数据结构可以随需求变化而变化,提供了极高的灵活性。它支持丰富的查询语言,允许执行复杂的数据操作,同时具备自动分片和副本集等特性,确保了数据的高可用性和水平扩展性。MongoDB 的易用性、高性能和可扩展性使其成为现代应用程序,特别是需要处理大量非结构化或半结构化数据的应用程序的理想选择。
对 MongoDB 进行监控是确保数据库系统健康、优化性能和预防故障的关键措施。监控可以帮助管理员实时了解数据库的运行状态,包括性能指标、资源使用情况和潜在的安全威胁。通过监控,可以及时发现并解决性能瓶颈,如慢查询或高内存使用,从而提高应用程序的响应速度和用户体验。此外,监控还能帮助预测和预防系统故障,比如通过监控磁盘空间来避免潜在的数据丢失。总的来说,监控 MongoDB 对于维护数据库的稳定性、安全性和高效性至关重要。
观测云
观测云是一款专为 IT 工程师打造的全链路可观测产品,它集成了基础设施监控、应用程序性能监控和日志管理,为整个技术栈提供实时可观察性。这款产品能够帮助工程师全面了解端到端的用户体验追踪,了解应用内函数的每一次调用,以及全面监控云时代的基础设施。此外,观测云还具备快速发现系统安全风险的能力,为数字化时代提供安全保障。
部署 DataKit
DataKit 是一个开源的、跨平台的数据收集和监控工具,由观测云开发并维护。它旨在帮助用户收集、处理和分析各种数据源,如日志、指标和事件,以便进行有效的监控和故障排查。DataKit 支持多种数据输入和输出格式,可以轻松集成到现有的监控系统中。
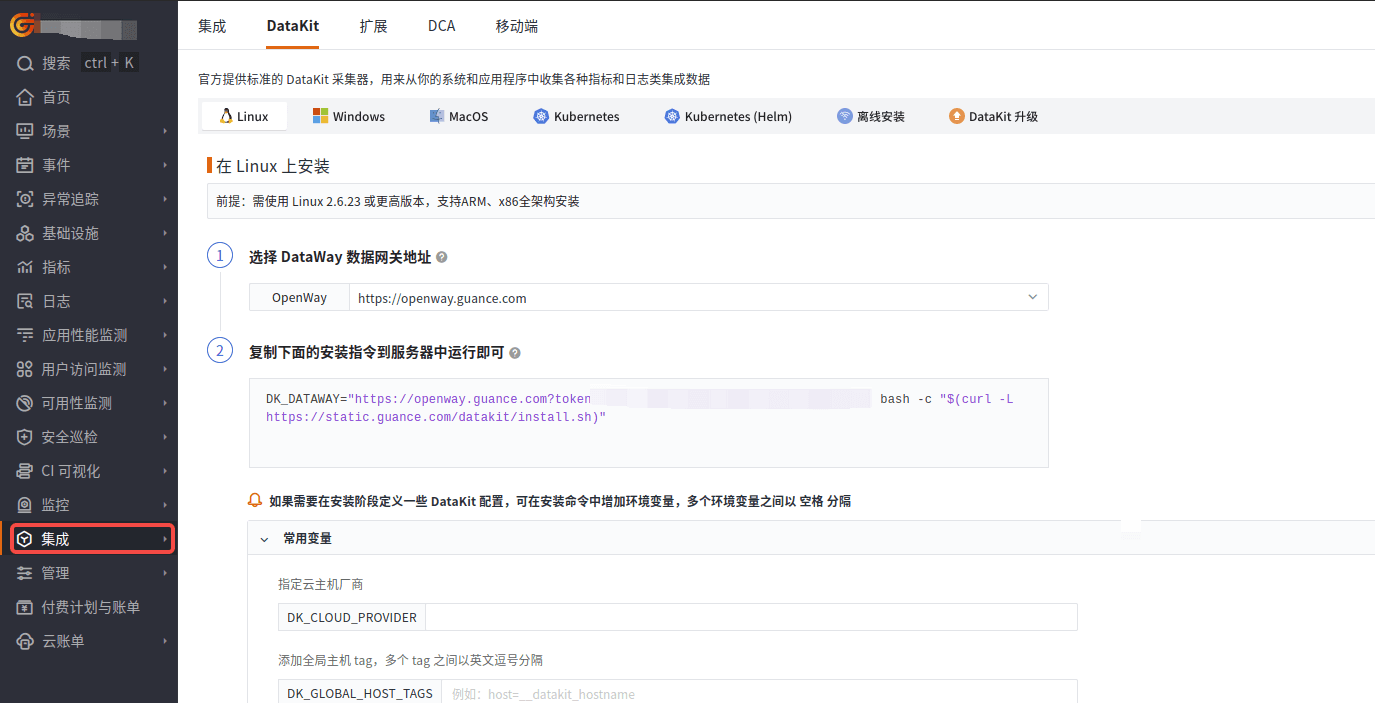
登录观测云控制台,在「集成」 - 「DataKit」 选择对应安装方式,当前采用 Linux 主机部署 DataKit。
开启 MongoDB 采集器
进入 DataKit 安装目录下的 conf.d/db 目录,复制 mongodb.conf.sample 并命名为 mongodb.conf。示例如下:
[[inputs.mongodb]]
  ## Gathering interval
  interval = "10s"

  ## Specify one single Mongodb server. These server related fields will be ignored when the 'servers' field is not empty.
  ## connection_format is a string in the standard connection format (mongodb://) or SRV connection format (mongodb+srv://).
  connection_format = "mongodb://"

  ## The host and port.
  host_port = "127.0.0.1:27017"

  ## Username
  username = "datakit"

  ## Password
  password = "<PASS>"

  ## The authentication database to use.
  # default_db = "admin"

  ## A query string that specifies connection specific options as <name>=<value> pairs.
  # query_string = "authSource=admin&authMechanism=SCRAM-SHA-256"

  ## A list of Mongodb servers URL
  ## Note: must escape special characters in password before connect to Mongodb server, otherwise parse will failed.
  ## Form: "mongodb://[user ":" pass "@"] host [ ":" port]"
  ## Some examples:
  ## mongodb://user:pswd@localhost:27017/?authMechanism=SCRAM-SHA-256&authSource=admin
  ## mongodb://user:pswd@127.0.0.1:27017,
  ## mongodb://10.10.3.33:18832,
  # servers = ["mongodb://127.0.0.1:27017"]

  ## When true, collect replica set stats
  gather_replica_set_stats = false

  ## When true, collect cluster stats
  ## Note that the query that counts jumbo chunks triggers a COLLSCAN, which may have an impact on performance.
  gather_cluster_stats = false

  ## When true, collect per database stats
  gather_per_db_stats = true

  ## When true, collect per collection stats
  gather_per_col_stats = true

  ## List of db where collections stats are collected, If empty, all dbs are concerned.
  col_stats_dbs = []

  ## When true, collect top command stats.
  gather_top_stat = true

  ## Set true to enable election
  election = true

  ## TLS connection config
  # ca_certs = ["/etc/ssl/certs/mongod.cert.pem"]
  # cert = "/etc/ssl/certs/mongo.cert.pem"
  # cert_key = "/etc/ssl/certs/mongo.key.pem"
  # insecure_skip_verify = true
  # server_name = ""

  ## Mongodb log files and Grok Pipeline files configuration
  # [inputs.mongodb.log]
    # files = ["/var/log/mongodb/mongod.log"]
    # pipeline = "mongod.p"

  ## Customer tags, if set will be seen with every metric.
  # [inputs.mongodb.tags]
    # "key1" = "value1"
    # "key2" = "value2"
    # ...
重启 DataKit。
# Linux/Mac 可能需加上 sudo
datakit service -R # restart
关键指标
| 指标名称 | 描述 |
|---|---|
| uptime_ns | MongoDB实例的总运行时间 |
| cpu_usage | 系统CPU的使用率 |
| mem_used_percent | 系统内存的使用率 |
| disk_used_percent | 系统磁盘的使用率 |
| net_out_bytes | 从MongoDB实例发送出去的网络字节数 |
| net_in_bytes | 进入MongoDB实例的网络字节数 |
| connections_current | 当前与数据库服务器的活跃连接数 |
| connections_total_created | 每秒新创建的连接数 |
| queries_per_sec | 每秒执行的查询次数 |
| inserts_per_sec | 每秒执行的插入操作次数 |
| updates_per_sec | 每秒执行的更新操作次数 |
| deletes_per_sec | 每秒执行的删除操作次数 |
| percent_cache_used | 缓存的使用率 |
| percent_cache_dirty | 脏缓存的使用率 |
| cursor_total_count | 当前打开的游标数量 |
| cursor_timed_out_count | 因超时而关闭的游标数量 |
| cursor_total | MongoDB维护的游标总数 |
| cursor_pinned_count | 固定的游标数量 |
| aggregate_command_total | 聚合命令执行的总次数 |
| aggregate_command_failed | 聚合命令失败的次数 |
| assert_msg | 消息断言发生的次数 |
| assert_user | 用户断言发生的次数 |
| ttl_deletes_per_sec | 每秒因TTL索引而删除的文档数量 |
| ttl_passes_per_sec | 每秒后台TTL线程进行删除的次数 |
| document_inserted | 插入的文档总数 |
| document_deleted | 删除的文档总数 |
| document_returned | 返回的文档总数 |
| document_updated | 更新的文档总数 |
| insert_command_total | insert 命令执行的总次数 |
| delete_command_total | delete 命令执行的总次数 |
| update_command_total | update 命令执行的总次数 |
| find_command_total | find 命令执行的总次数 |
| insert_command_failed | insert 命令失败的次数 |
| find_command_failed | find 命令失败的次数 |
| update_command_failed | update 命令失败的次数 |
| delete_command_failed | delete 命令失败的次数 |
| repl_state | Replica Set成员的状态 |
| repl_queries, repl_deletes, repl_inserts, repl_updates | Replica Set的查询、删除、插入、更新操作 |
| repl_lag | 主从复制的滞后时间 |
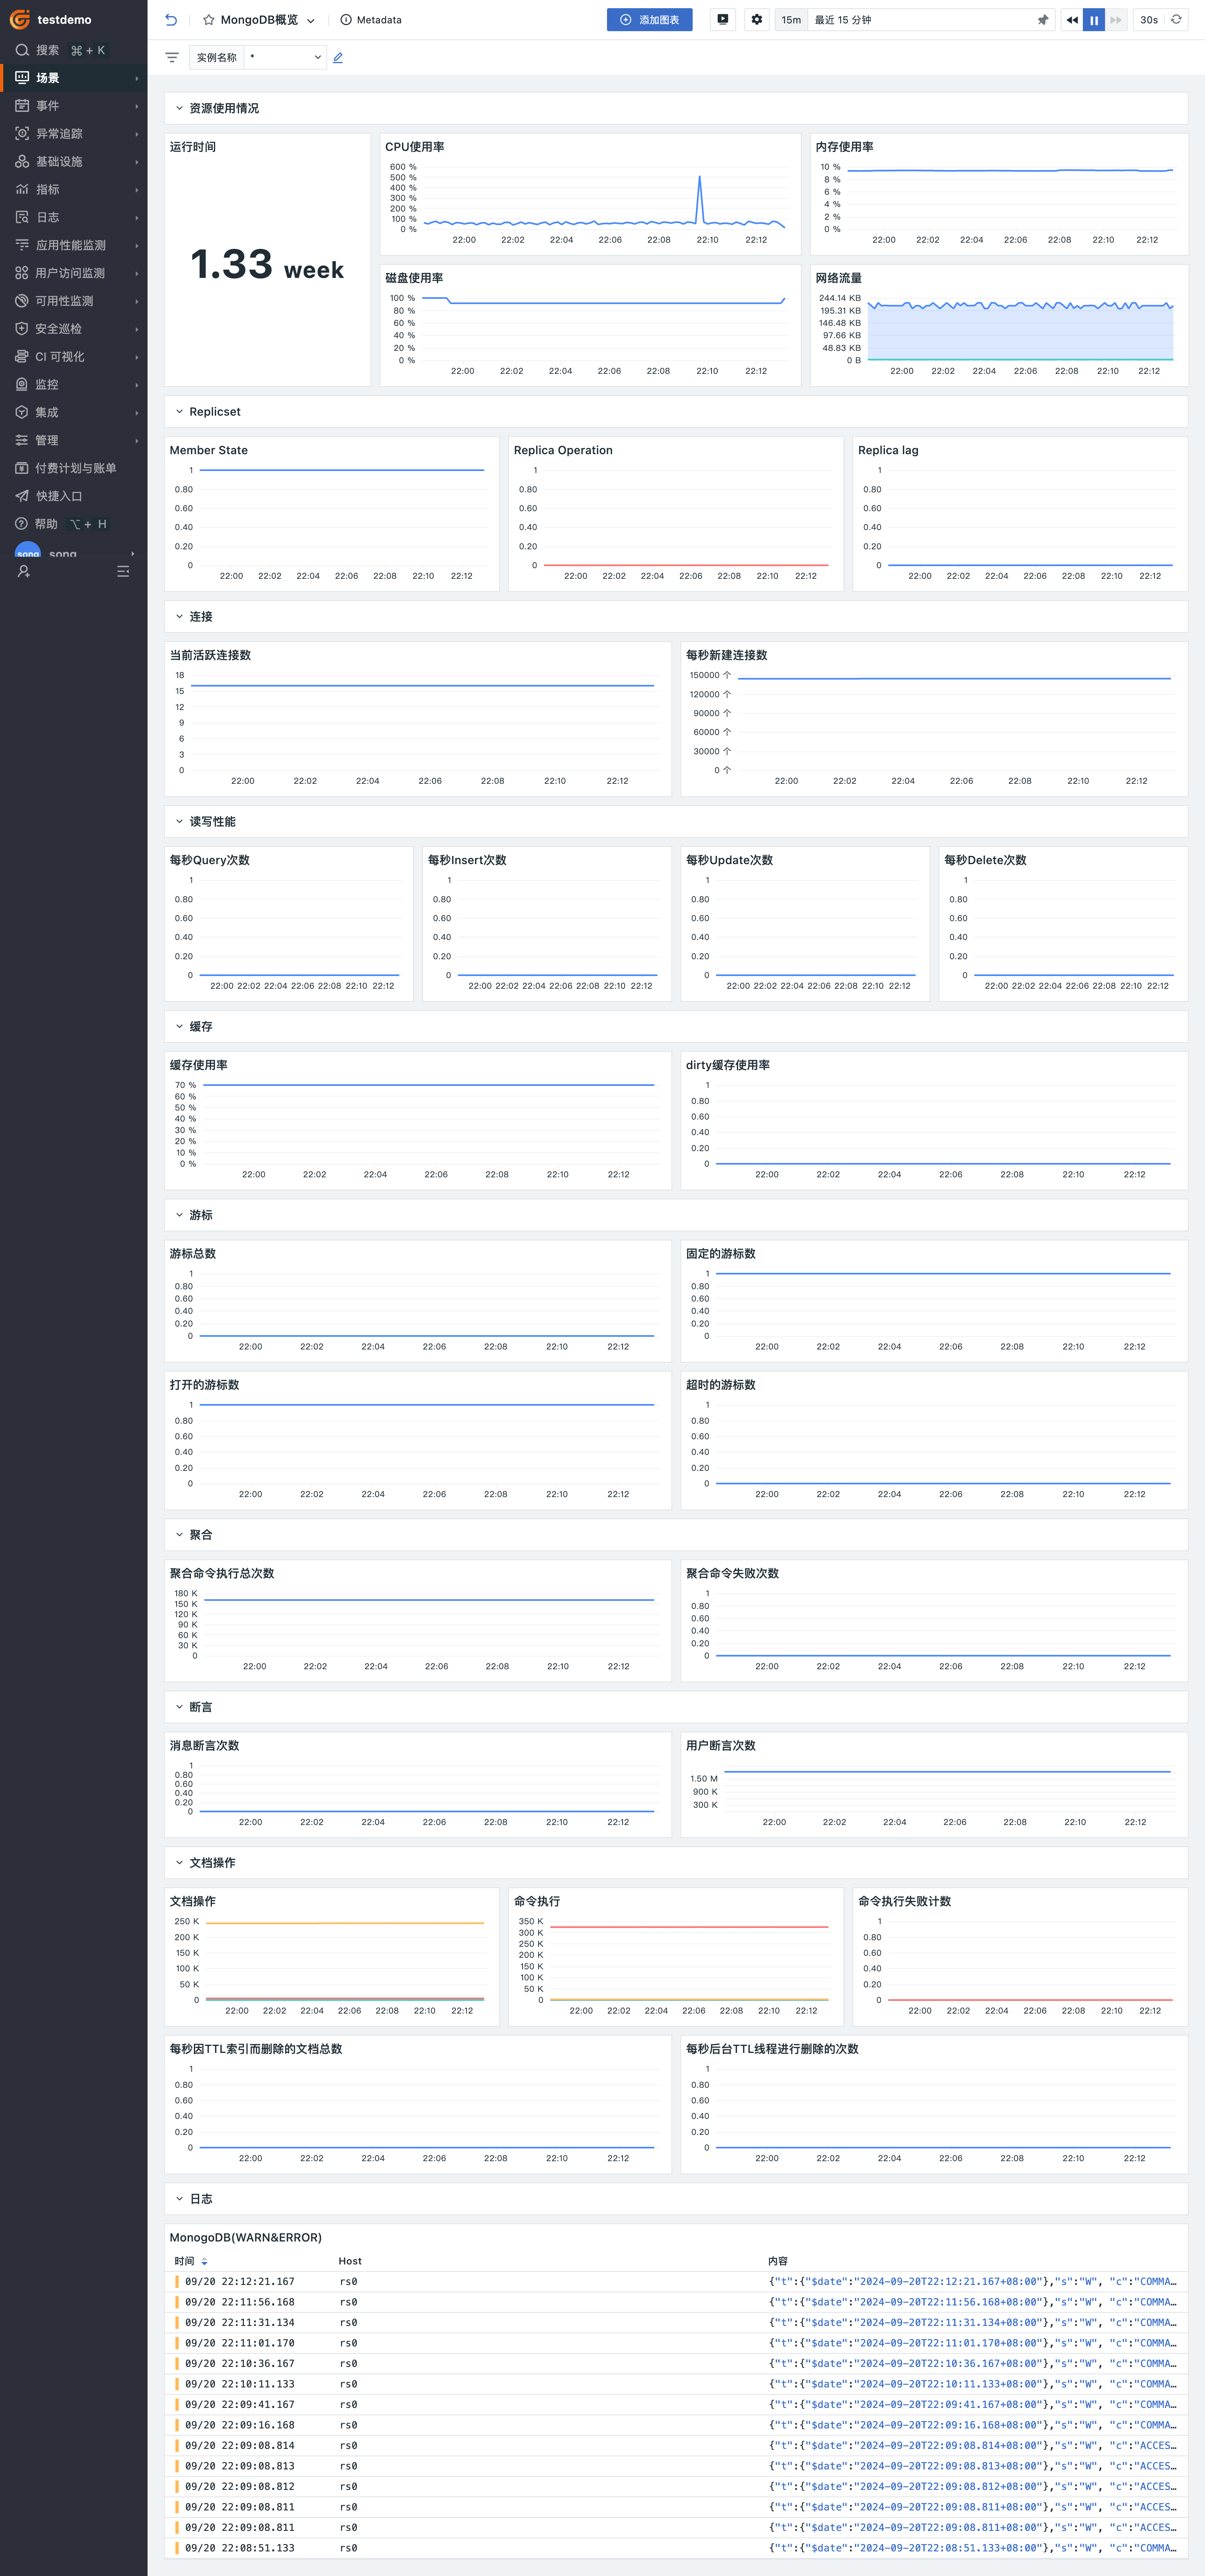
场景视图
登录观测云控制台,点击「场景」 -「新建仪表板」,输入 “MongoDB”, 选择 “MongoDB 监控视图”,点击 “确定” 即可添加视图。
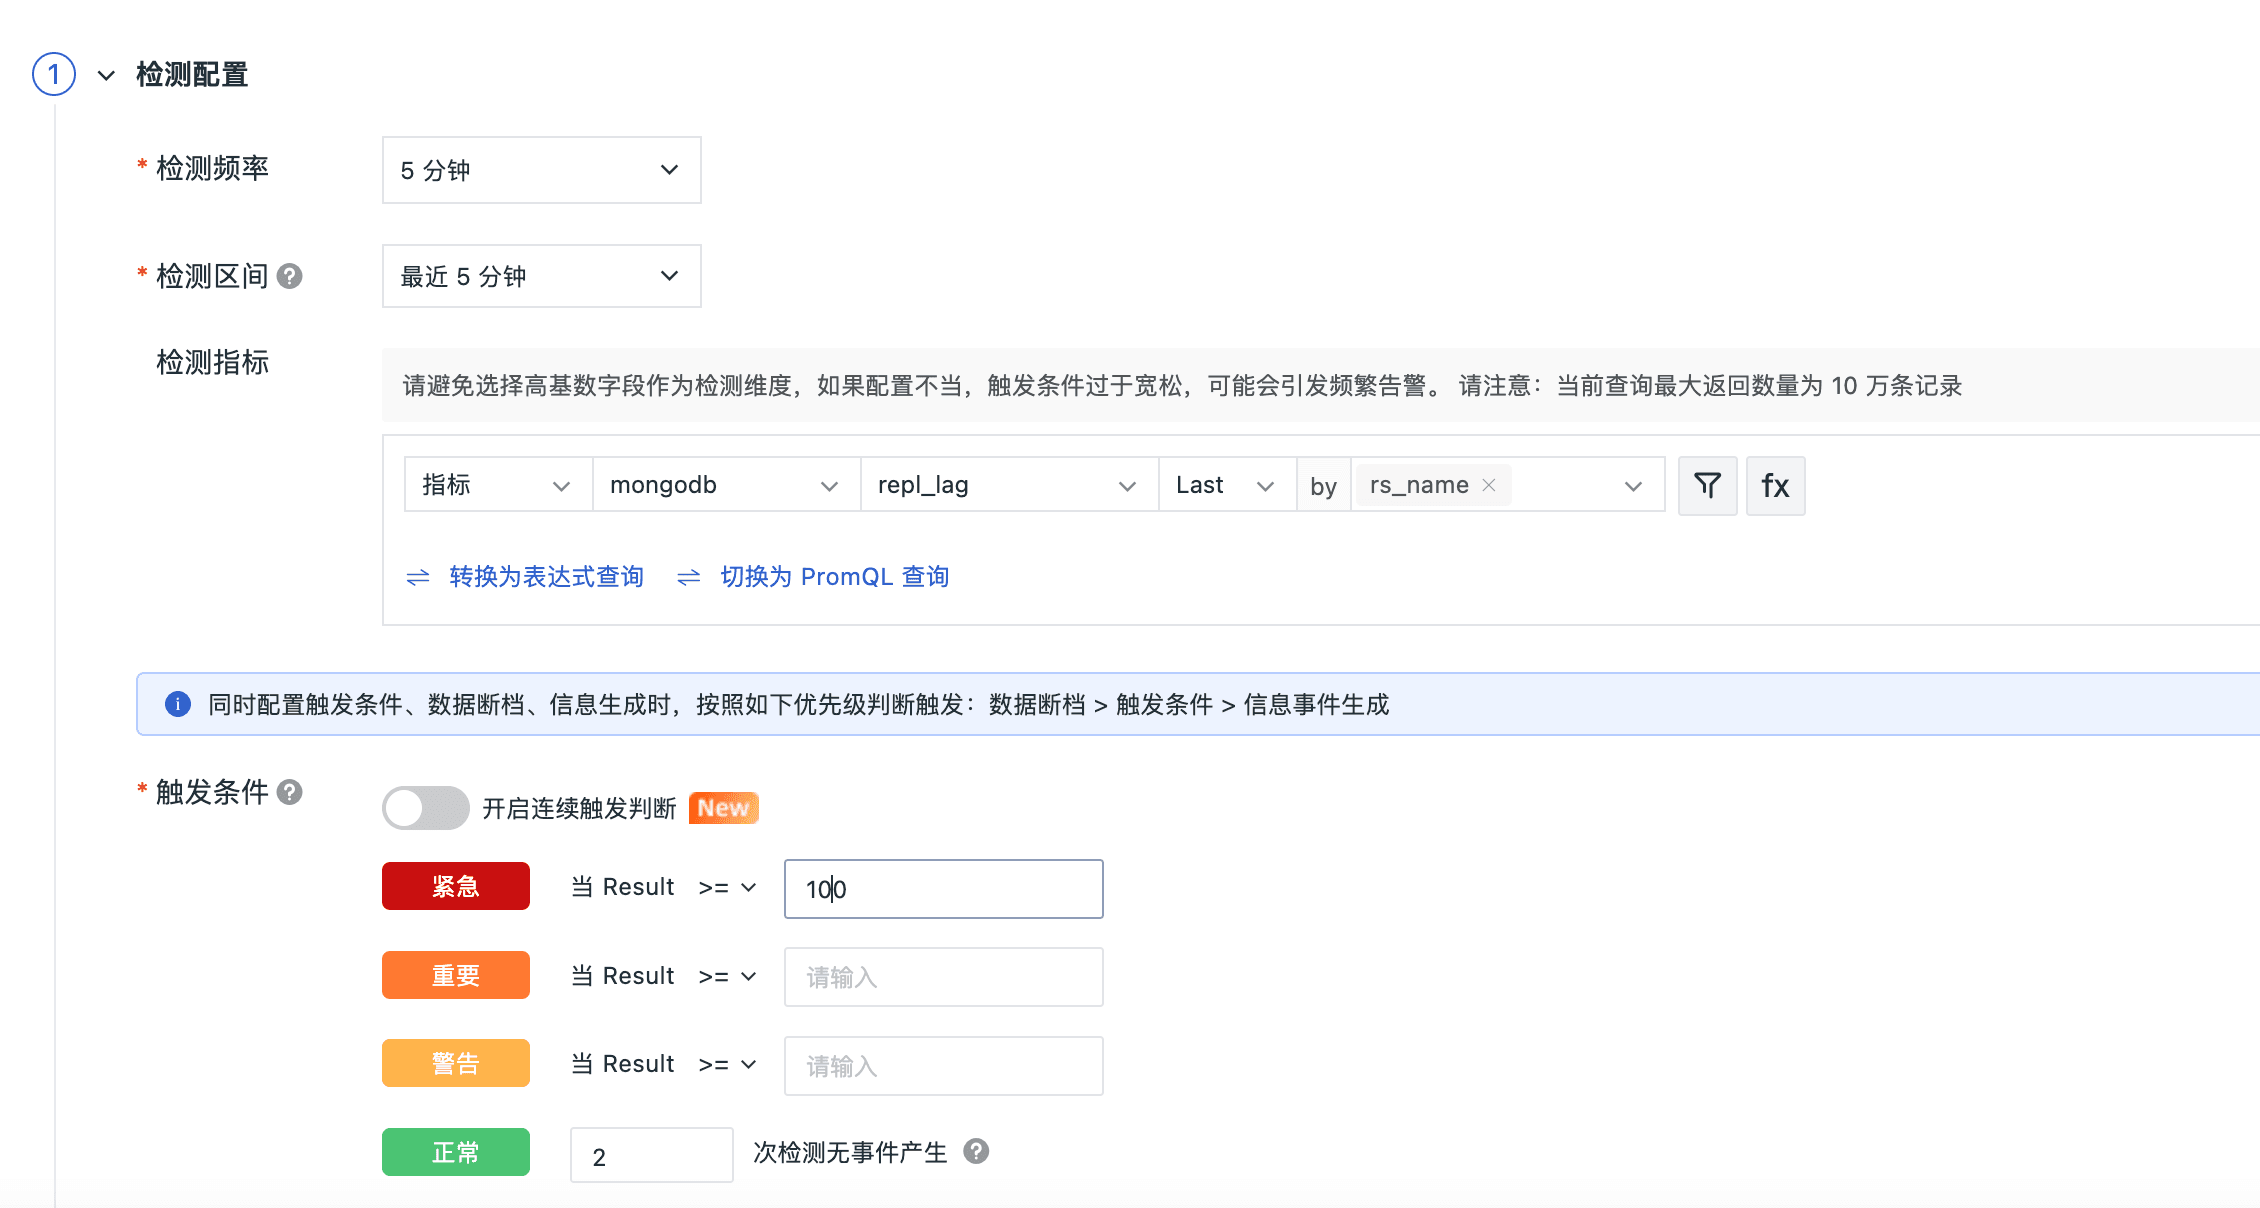
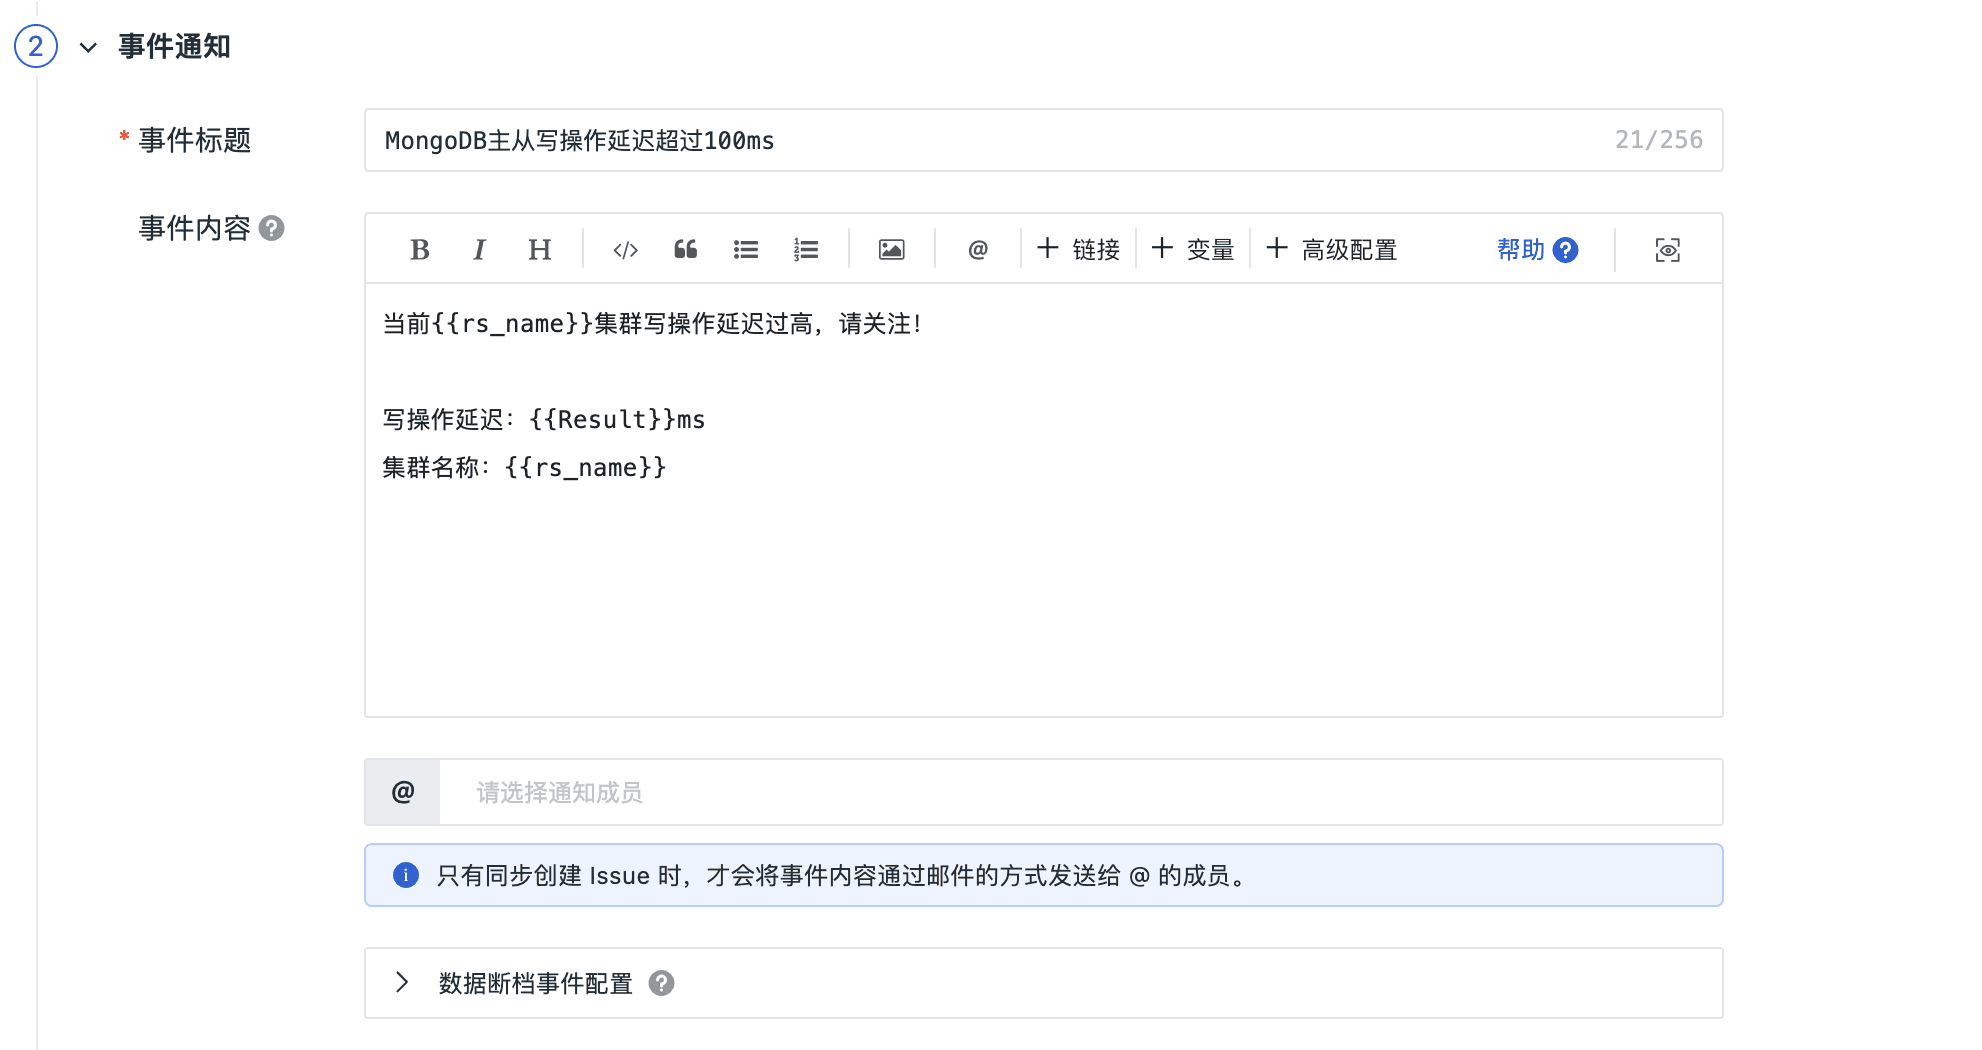
监控器(告警)
主从写操作延迟超过30ms告警
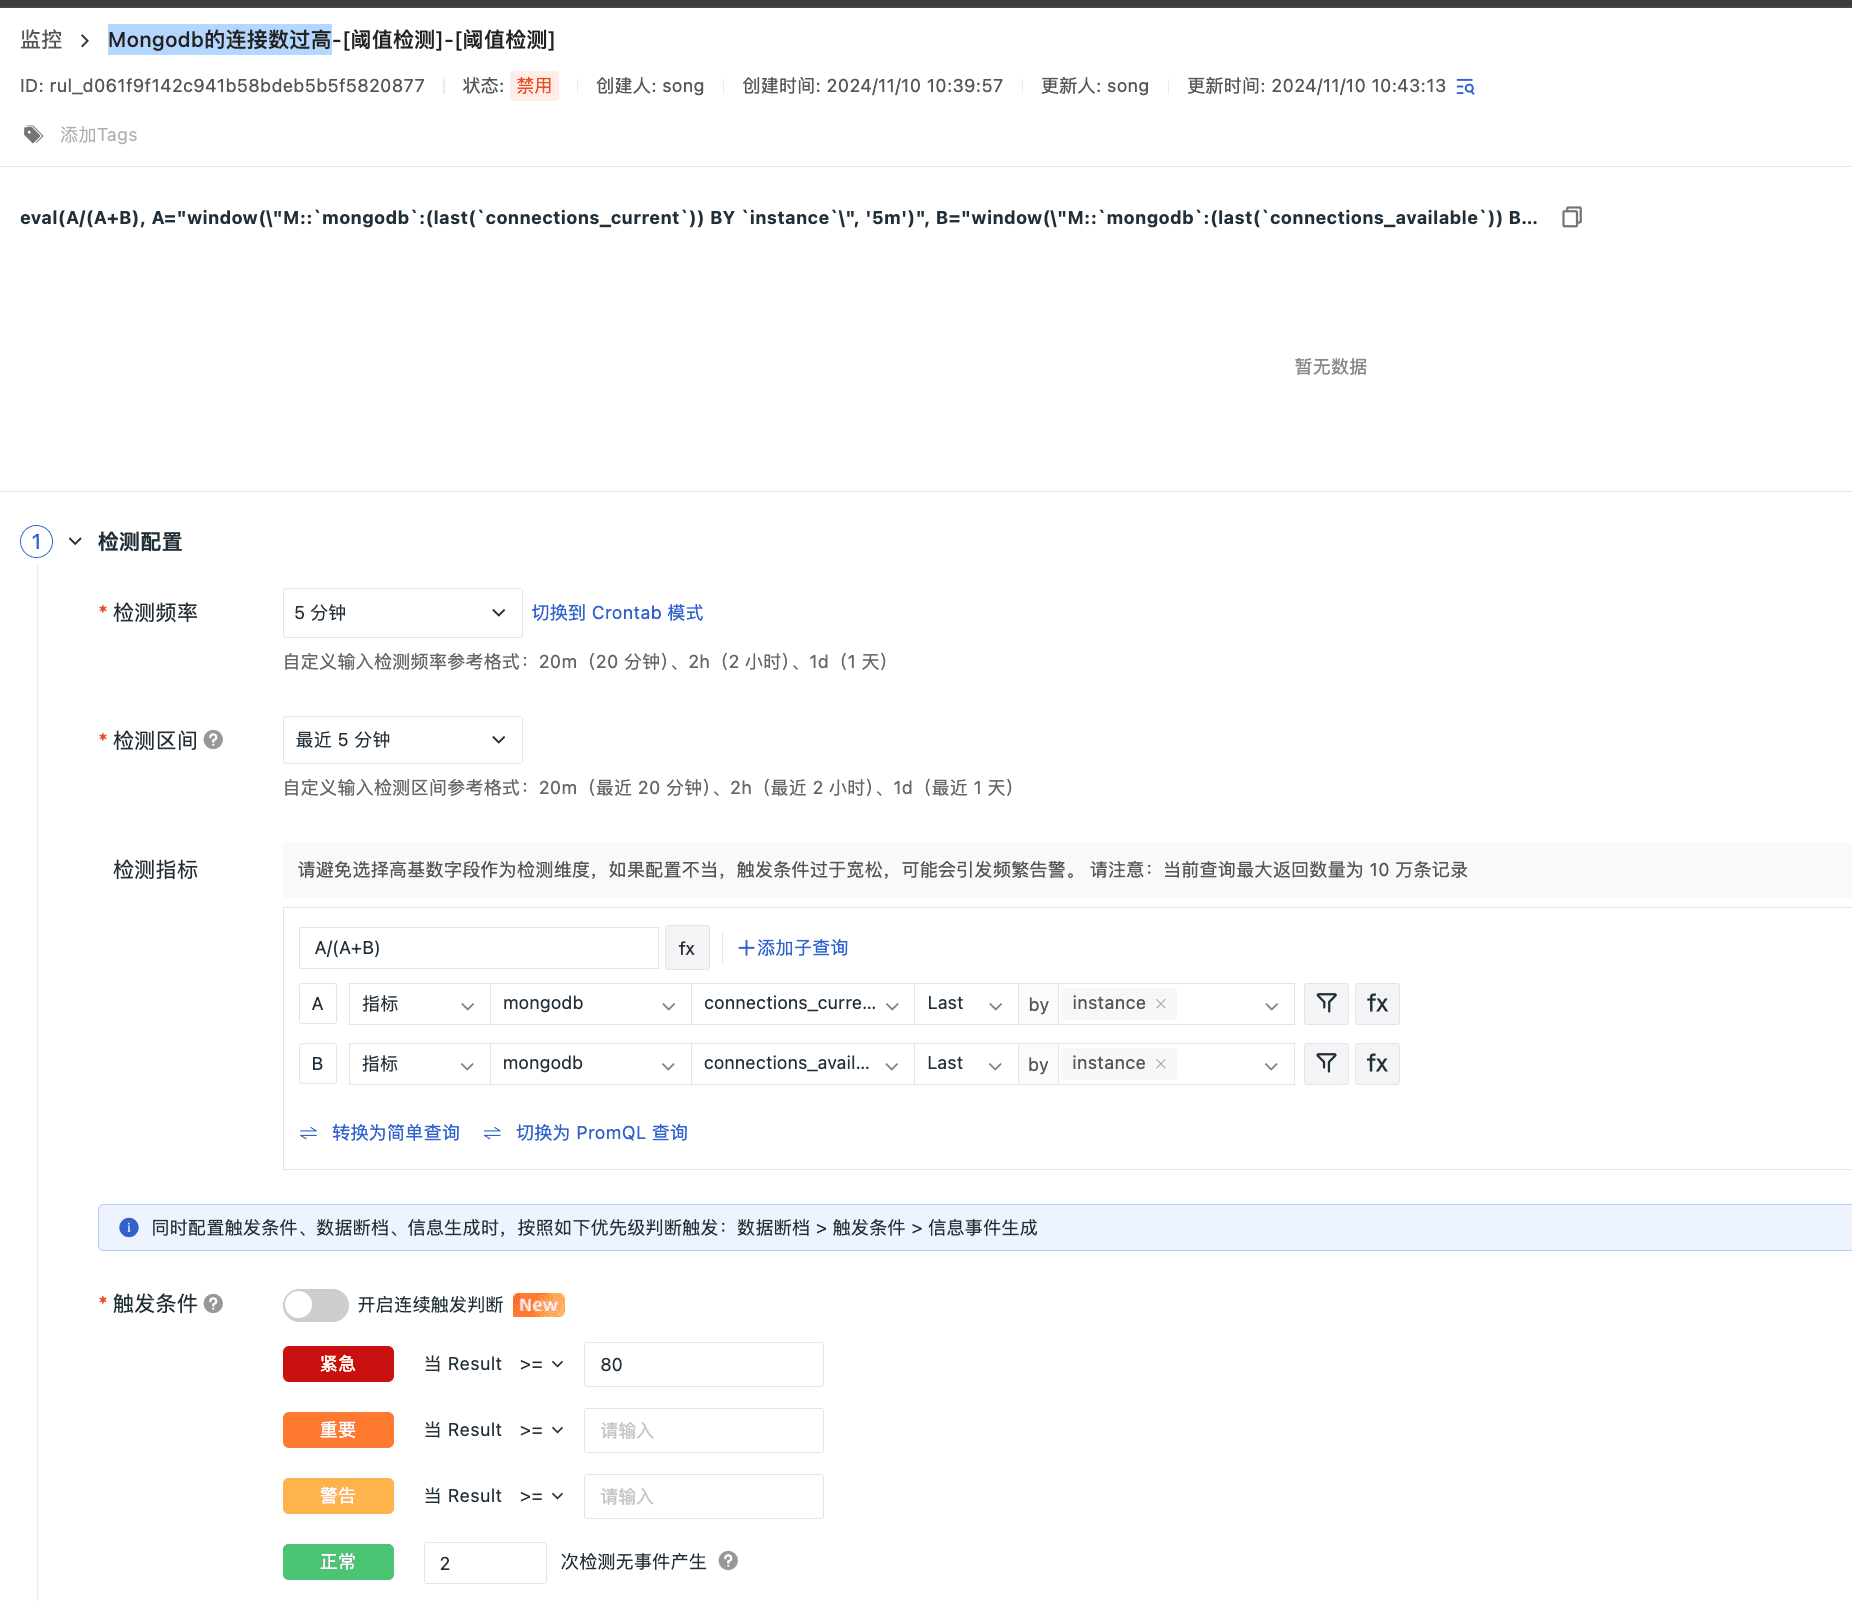
Mongodb的连接数过高
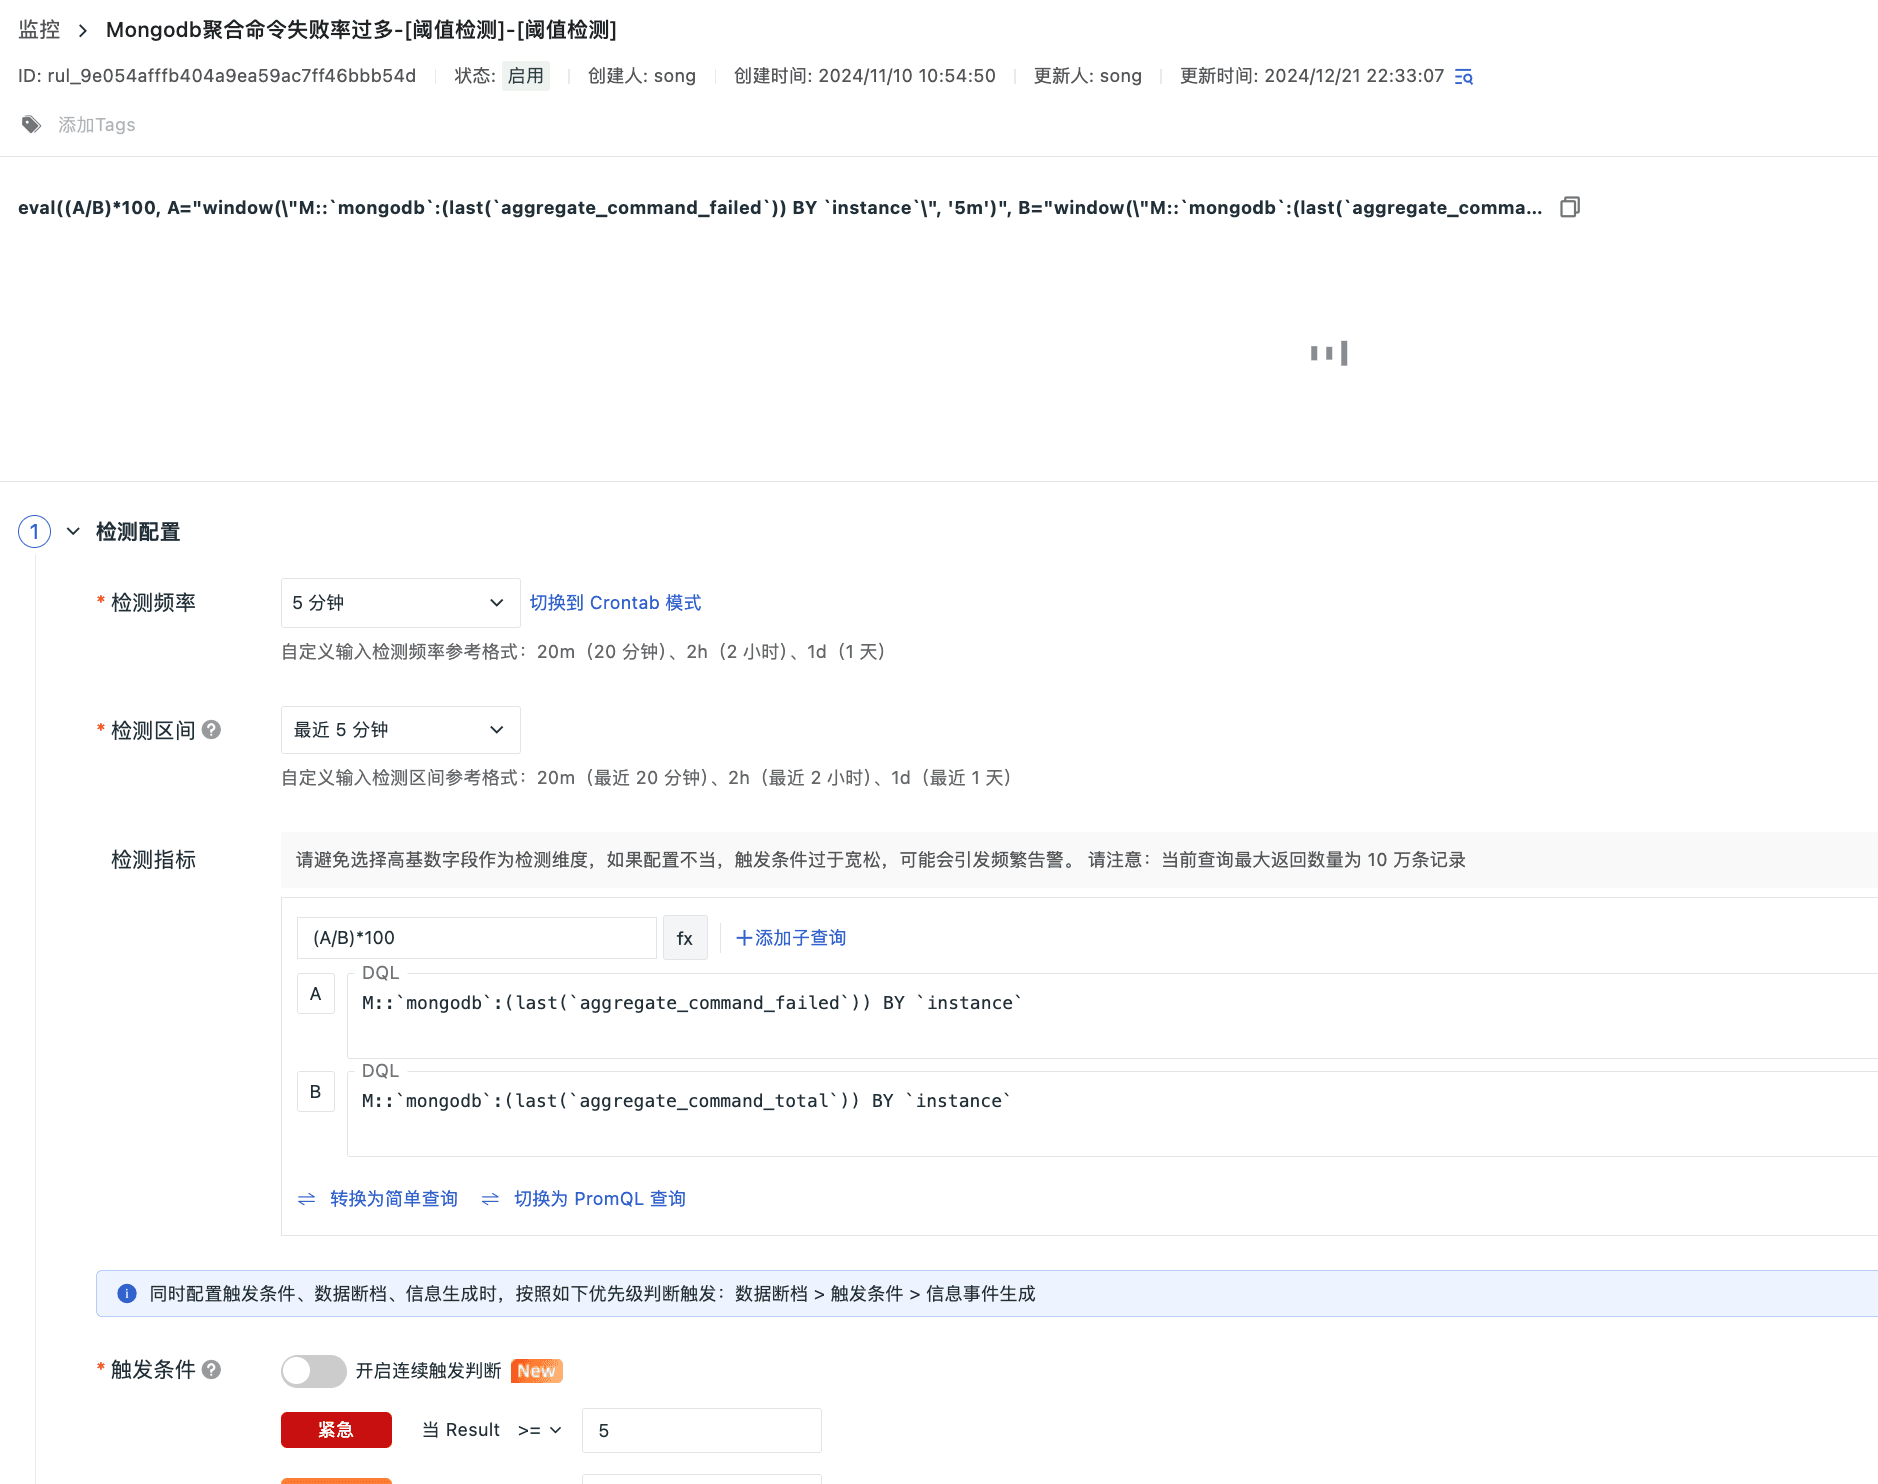
Mongodb聚合命令失败率过多
总结
通过观测云平台对 MongoDB 进行统一监控,我们能够实时追踪关键性能指标,如活跃读写连接数、聚合命令的执行与失败次数、以及断言情况。这些指标对于优化数据库性能、识别性能瓶颈、及时排查故障至关重要。它们帮助我们提升缓存策略,确保数据一致性,进行有效的容量规划,并为业务分析提供支持。这样的监控不仅增强了用户体验,也显著提高了系统的可靠性和稳定性。