

Monitor Claude Code sessions, tool calls, and token usage in Guance
Connect Claude Code to Guance, inspect sessions and trace waterfalls, and understand the collection boundaries behind token usage and risk events.
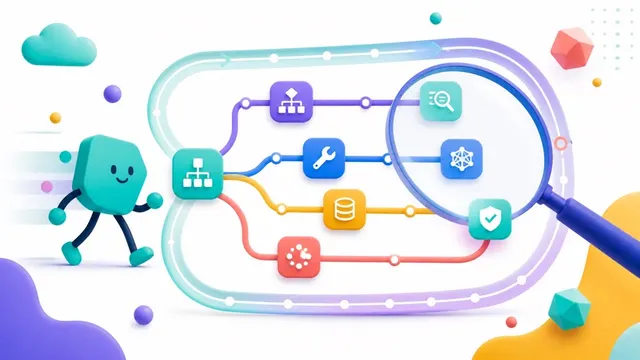
A coding task rarely maps to a single model request. Claude Code may inspect files, call tools, run tests, and return to the model several times before it produces a result. A final diff tells you what changed. It does not tell you which step took the time or where the tokens went.
Guance supports Claude Code in Agent Monitoring, so you can investigate the recorded activity as sessions, traces, and spans. Start with a session to understand the task as a whole, then open a trace when you need the details of a model or tool call.
Investigate the task, then the individual calls
At session level, the useful questions are straightforward: how long did the work take, how much input and output did the model process, and which calls contributed to the total? Guance's Session list exposes input and output token counts alongside risk-event counts and alert levels. From the session details, you can inspect the trace waterfall and the mix of model, Skill, and Tool calls.
That hierarchy matters when an apparently small change turns into a long-running task. A large token total alone cannot tell you whether the Agent read a large context, repeated a failed operation, or made several useful passes over the code. The call sequence gives you somewhere to investigate those possibilities.
Keep token usage and cost separate. Token counts describe the collected usage; a monetary estimate also depends on the model and applicable pricing. Treat that estimate as an aid to attribution, rather than a substitute for the provider's bill.
Read the waterfall as execution evidence
Open a trace to examine its duration, status, token usage, and individual spans. Where the integration reports them, tool-call records can provide context for file access, commands, tests, and other coding operations. Input and output fields help connect a call to the surrounding task.
The important qualification is where the integration reports them. An empty field does not establish that an operation never happened. Collection settings, adapter behavior, and the information emitted by the Agent determine what is available. Likewise, a trace shows recorded execution; it does not expose a model's private reasoning or prove why it selected one implementation over another.
Risk events give you another route into the session. Use a flagged operation as a starting point, then inspect the corresponding call and its context. Visibility and detection are different from enforcement: a displayed risk event does not, by itself, mean that Guance blocked the action. Validate the relevant rules and collection coverage for the behavior you need to monitor.
Connect Claude Code
In the Guance console, open Agent Monitoring > Summary, select the Agent tab, and choose Integrate Agent. Select Claude Code and follow the instructions generated for your environment.
The documented installer is obs-agent-connector. Its Claude Code integration uses a built-in adapter for Stop and SessionEnd Hooks. Before setup, confirm that the connector supports your Agent and operating system with obs-agent-connector agents. Use the endpoint and token supplied by your own workspace; do not copy credentials from another environment.
The setup also includes a user-identity choice. Associating workspace personal information uses the member UUID as user_id and the member name as user_name. If you leave that option unselected, Guance generates an anonymous ID and asks you to enter a display name. Review this setting before rolling collection out across a development team.
After installation, run a small coding task and locate its new session in Guance. Check the model and tool calls you expect, then compare the collected token and timing fields with the task you ran. This gives you a concrete baseline before using the data to investigate slower or more expensive sessions.
For current installation steps and supported environments, see Create an Agent Monitoring Application and the connector command reference. The Agent Monitoring overview explains the session and trace views.
Contact us
Join the community

to join the community
Try Guance
Start online and pay only for what you use.
Get startedChoose a Guance plan