

Investigate Qoder coding sessions with Guance Agent Monitoring
Connect Qoder to Guance to inspect model and tool activity, compare token usage, and investigate coding sessions with trace-level context.
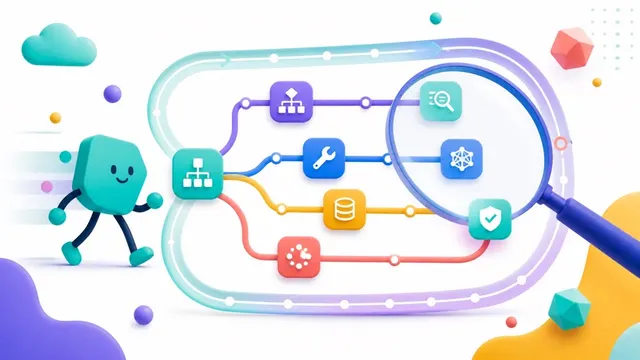
When Qoder works through a coding task, the final response is only part of the record. The task may involve several model calls, file operations, and test runs. If it takes longer than expected or consumes more tokens, you need to examine that sequence rather than infer everything from the generated code.
Guance supports Qoder in Agent Monitoring. Collected activity is organized into sessions, traces, and spans, giving you a task-level view and a way to drill into the calls behind it.
Compare sessions before drawing cost conclusions
Begin with the session. Guance's Session list includes input and output token counts, risk-event counts, and alert levels. Session details expose the trace waterfall and the proportions of model, Skill, and Tool calls.
This gives a team a more useful starting point than treating every prompt as an equivalent unit of work. A small edit and a repository-wide change can have very different context requirements. Even two requests for the same feature may follow different execution paths. Investigate the calls and the work attempted before describing one run as inefficient.
Keep the model attached to usage data when assessing cost. Input and output tokens are not interchangeable billing units across models, and a displayed cost estimate is not the provider's invoice. If you change the model used for a workflow, compare the recorded usage and the quality of the result as separate dimensions.
Follow a slow or unexpected operation into its trace
The Trace view provides duration, status, token usage, and access to span details. Tool-call records can help you inspect the operations recorded during the coding task. Depending on the collected data, that context may include file access, commands, test execution, or other tool activity.
Use the waterfall to identify where time accumulated. A long model call suggests a different investigation from a slow tool invocation or a sequence of repeated failures. The value is in that distinction: you can narrow the next check to the part of the task that actually consumed the time.
Recorded inputs and outputs can help explain the sequence, but collection has boundaries. Do not assume every file read, code diff, Git operation, or pull-request link is present just because the integration is enabled. Check the fields emitted by your Qoder version and collection configuration. The trace is evidence of reported activity, not a reconstruction of the model's private reasoning.
The same caution applies to risk events. Inspect the operation and its context when a session is flagged, and confirm which detection rules apply. Monitoring an operation does not necessarily prevent it; enforcement belongs to the controls configured for the development environment and Agent.
Set up the Qoder integration
Open Agent Monitoring > Summary in Guance, select the Agent tab, and click Integrate Agent. Choose Qoder and use the configuration generated for your workspace.
Qoder connects through obs-agent-connector and qoder-otel-plugin. The connector documentation distinguishes the international and China editions: it detects the corresponding configuration directory and passes the appropriate variant to the plugin. This is worth checking during setup if a machine has more than one edition or an older installation.
Run obs-agent-connector agents to check support in the installed connector. Follow the current installation guide for the host operating system, then use obs-agent-connector discover to discover supported Agents and configure their integrations. Keep the workspace endpoint and token specific to the environment you intend to monitor.
Decide how to associate users during setup. Guance can use workspace member information, or generate an anonymous user_id with a manually entered display name. The identifier is used to aggregate and filter usage; the display name is not the unique identity.
Finish with a small, recognizable task. Find its session in Guance and confirm that the expected model and tool activity appears. Check token fields, timing, and any inputs or outputs you intend to rely on. A verified session is a better basis for a team rollout than a successful installer exit alone.
See Create an Agent Monitoring Application for setup, the connector command reference for Qoder-specific behavior, and Agent Monitoring for the available investigation views.
Contact us
Join the community

to join the community
Try Guance
Start online and pay only for what you use.
Get startedChoose a Guance plan