Network Performance Monitoring

Find the service or workload behind network latency

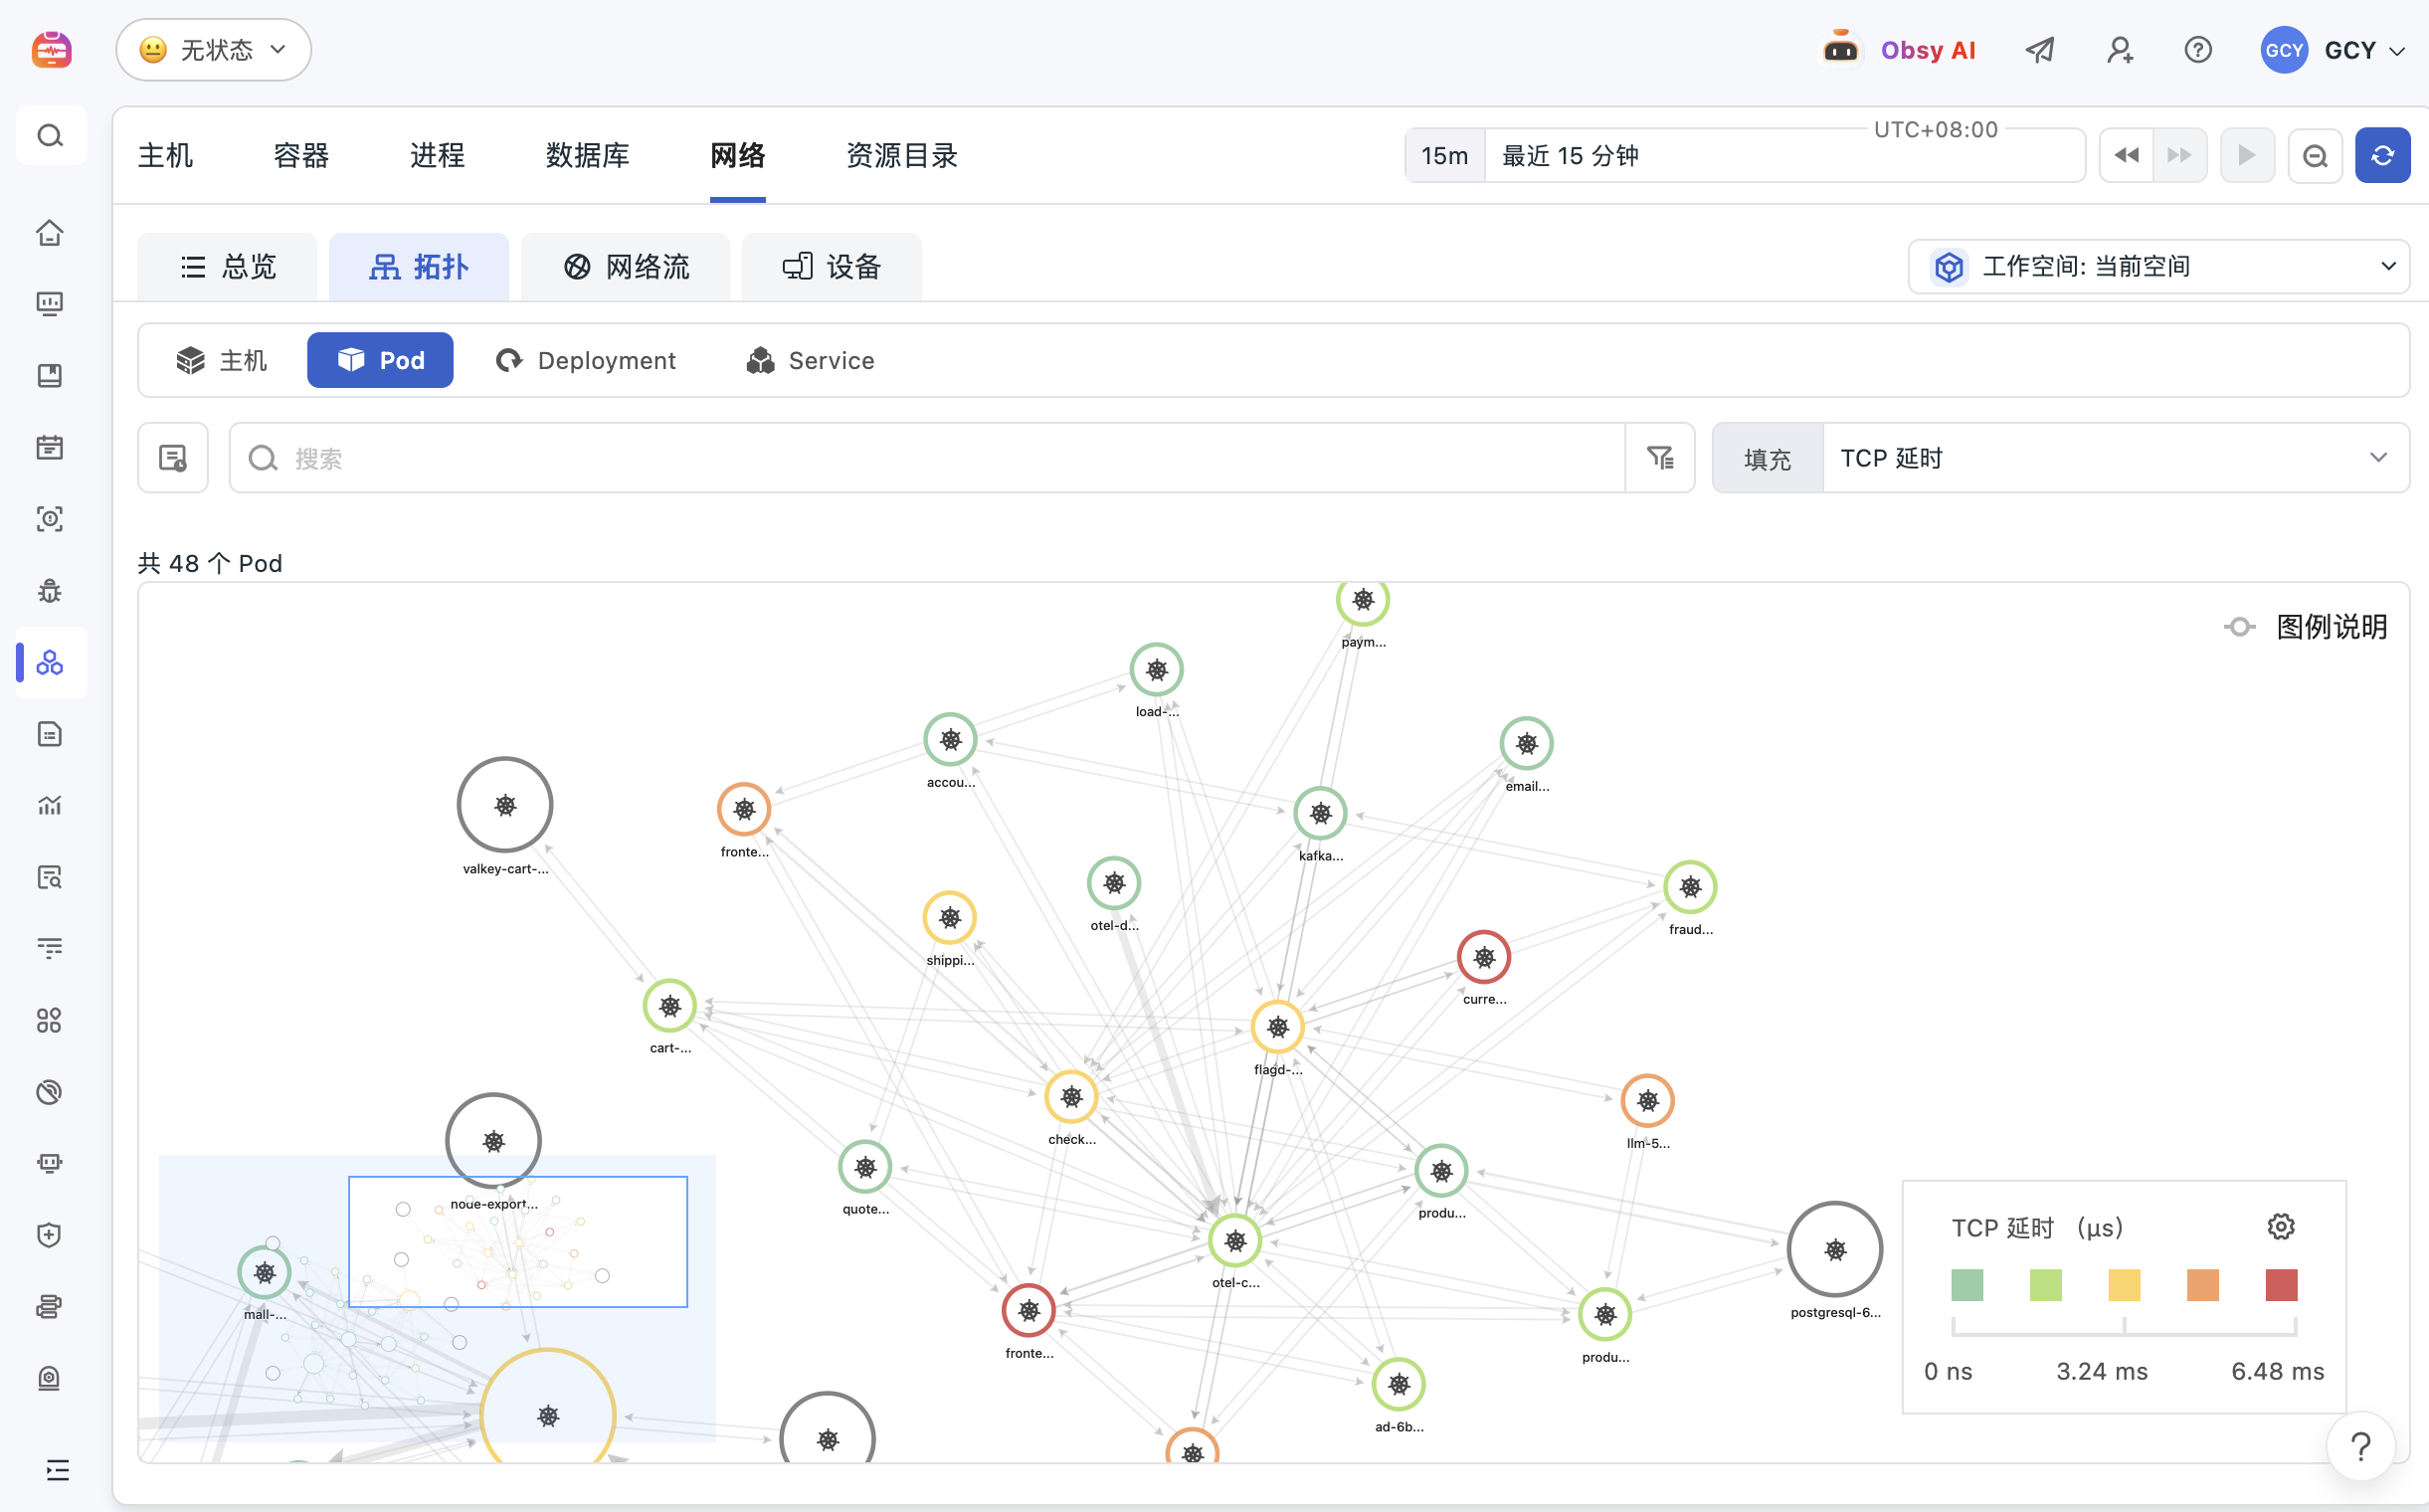
Guance Network Performance Monitoring uses eBPF network telemetry, live topology, upstream and downstream relationships, and BPF network logs to explain traffic between hosts, pods, and services. Teams can isolate latency, packet loss, connection errors, and traffic spikes, then continue into application and infrastructure context.

Find the service or workload behind network latency

What Network Performance Monitoring helps you solve

Turn invisible service traffic into topology, flow, and request evidence

A network symptom rarely identifies its owner. Guance shows communication across cloud, container, host, and application environments, then uses common resource and service context to narrow a failure to an affected path, endpoint, workload, or dependency.

Collect host and container network evidence without instrumenting every service
Use eBPF-based collection for network connections, throughput, latency, and errors at the system layer. Hosts, Pods, Deployments, Services, cloud instances, and container platforms can share one network view while application instrumentation remains optional for the network signal itself.
View documentation
Collect host and container network evidence without instrumenting every service
Use topology to see which upstream or downstream path became abnormal
Visualize traffic direction and relationships among hosts, Pods, Deployments, and Services. When latency, packet loss, or connection failures appear, scope the affected path first and then inspect related logs, traces, infrastructure, and events.
View documentation
Turn unusual traffic and connection behavior into a scoped alert
Create dashboards and monitors from latency, traffic, connection count, error, and dependency signals. Group by service, namespace, host, region, or other shared tags so the notification identifies the affected slice of the network.
View documentation
Turn unusual traffic and connection behavior into a scoped alert
Use BPF network logs when the investigation needs request-level evidence
Filter connection direction, addresses, ports, protocols, hosts, pods, and services in BPF network logs. Where HTTP fields are available, correlate transport and application-layer evidence such as method and path to understand how the failing request crossed services.
View documentation

Frequently asked questions

What does Network Performance Monitoring help teams investigate?

It helps isolate latency, packet loss, traffic spikes, connection errors, and dependency-path problems between hosts, pods, services, and cloud resources, then relate them to application and infrastructure evidence.

Does eBPF network collection require application code changes?

No application code change is required for supported system-level eBPF network collection. Deployment requirements and available fields depend on the operating system, kernel, permissions, and DataKit configuration.

What is the difference between network topology and BPF network logs?

Topology provides an aggregate view of traffic direction and relationships. BPF network logs provide detailed connection and, where available, HTTP evidence for filtering and validating a specific path.

Is Network Performance Monitoring useful for Kubernetes?

Yes. It can organize network evidence by namespace, workload, pod, service, and host, which helps teams investigate dynamic service-to-service traffic together with container, log, and trace context.


Related reading

Connect network paths to workloads, logs, and infrastructure

Explore infrastructure, containers, logs, Kubernetes, documentation, and pricing.

Get started > View documentation > View pricing >