Application Performance Monitoring (APM)

Find the cause of slow and failing application requests

Guance APM connects distributed traces, service maps, endpoint latency, errors, Continuous Profiling, logs, infrastructure, and deployment context. Teams can see which requests are affected, follow the evidence across services and dependencies, and verify the result of a fix without rebuilding the incident in several tools.

Find the cause of slow and failing application requests

After adopting Guance, we connected the end-to-end transaction path—from network and server resources through application services to frontend pages and POS terminals—for real-time performance monitoring across the full stack. When an alert fires, we can immediately see where a performance bottleneck, user-experience degradation, or log anomaly occurred, helping the team pinpoint issues from multiple angles and turn findings into performance improvements.

———— Wu Hongqin · Technical Director, Data & IT Systems, Meiyijia

What APM helps you solve

Investigate slow and failed requests with every signal in context

Give developers, SREs, and platform teams the same view of service health and individual requests. Start with a latency or error regression, inspect a representative trace, and continue into the logs, resource state, database work, profile, or deployment that explains it.

A real investigation path

From a slow request to the responsible service, dependency, or code path

APM identifies the requests that affect users, then uses traces, logs, resources, and profiling evidence to narrow the cause to something a team can change and verify.

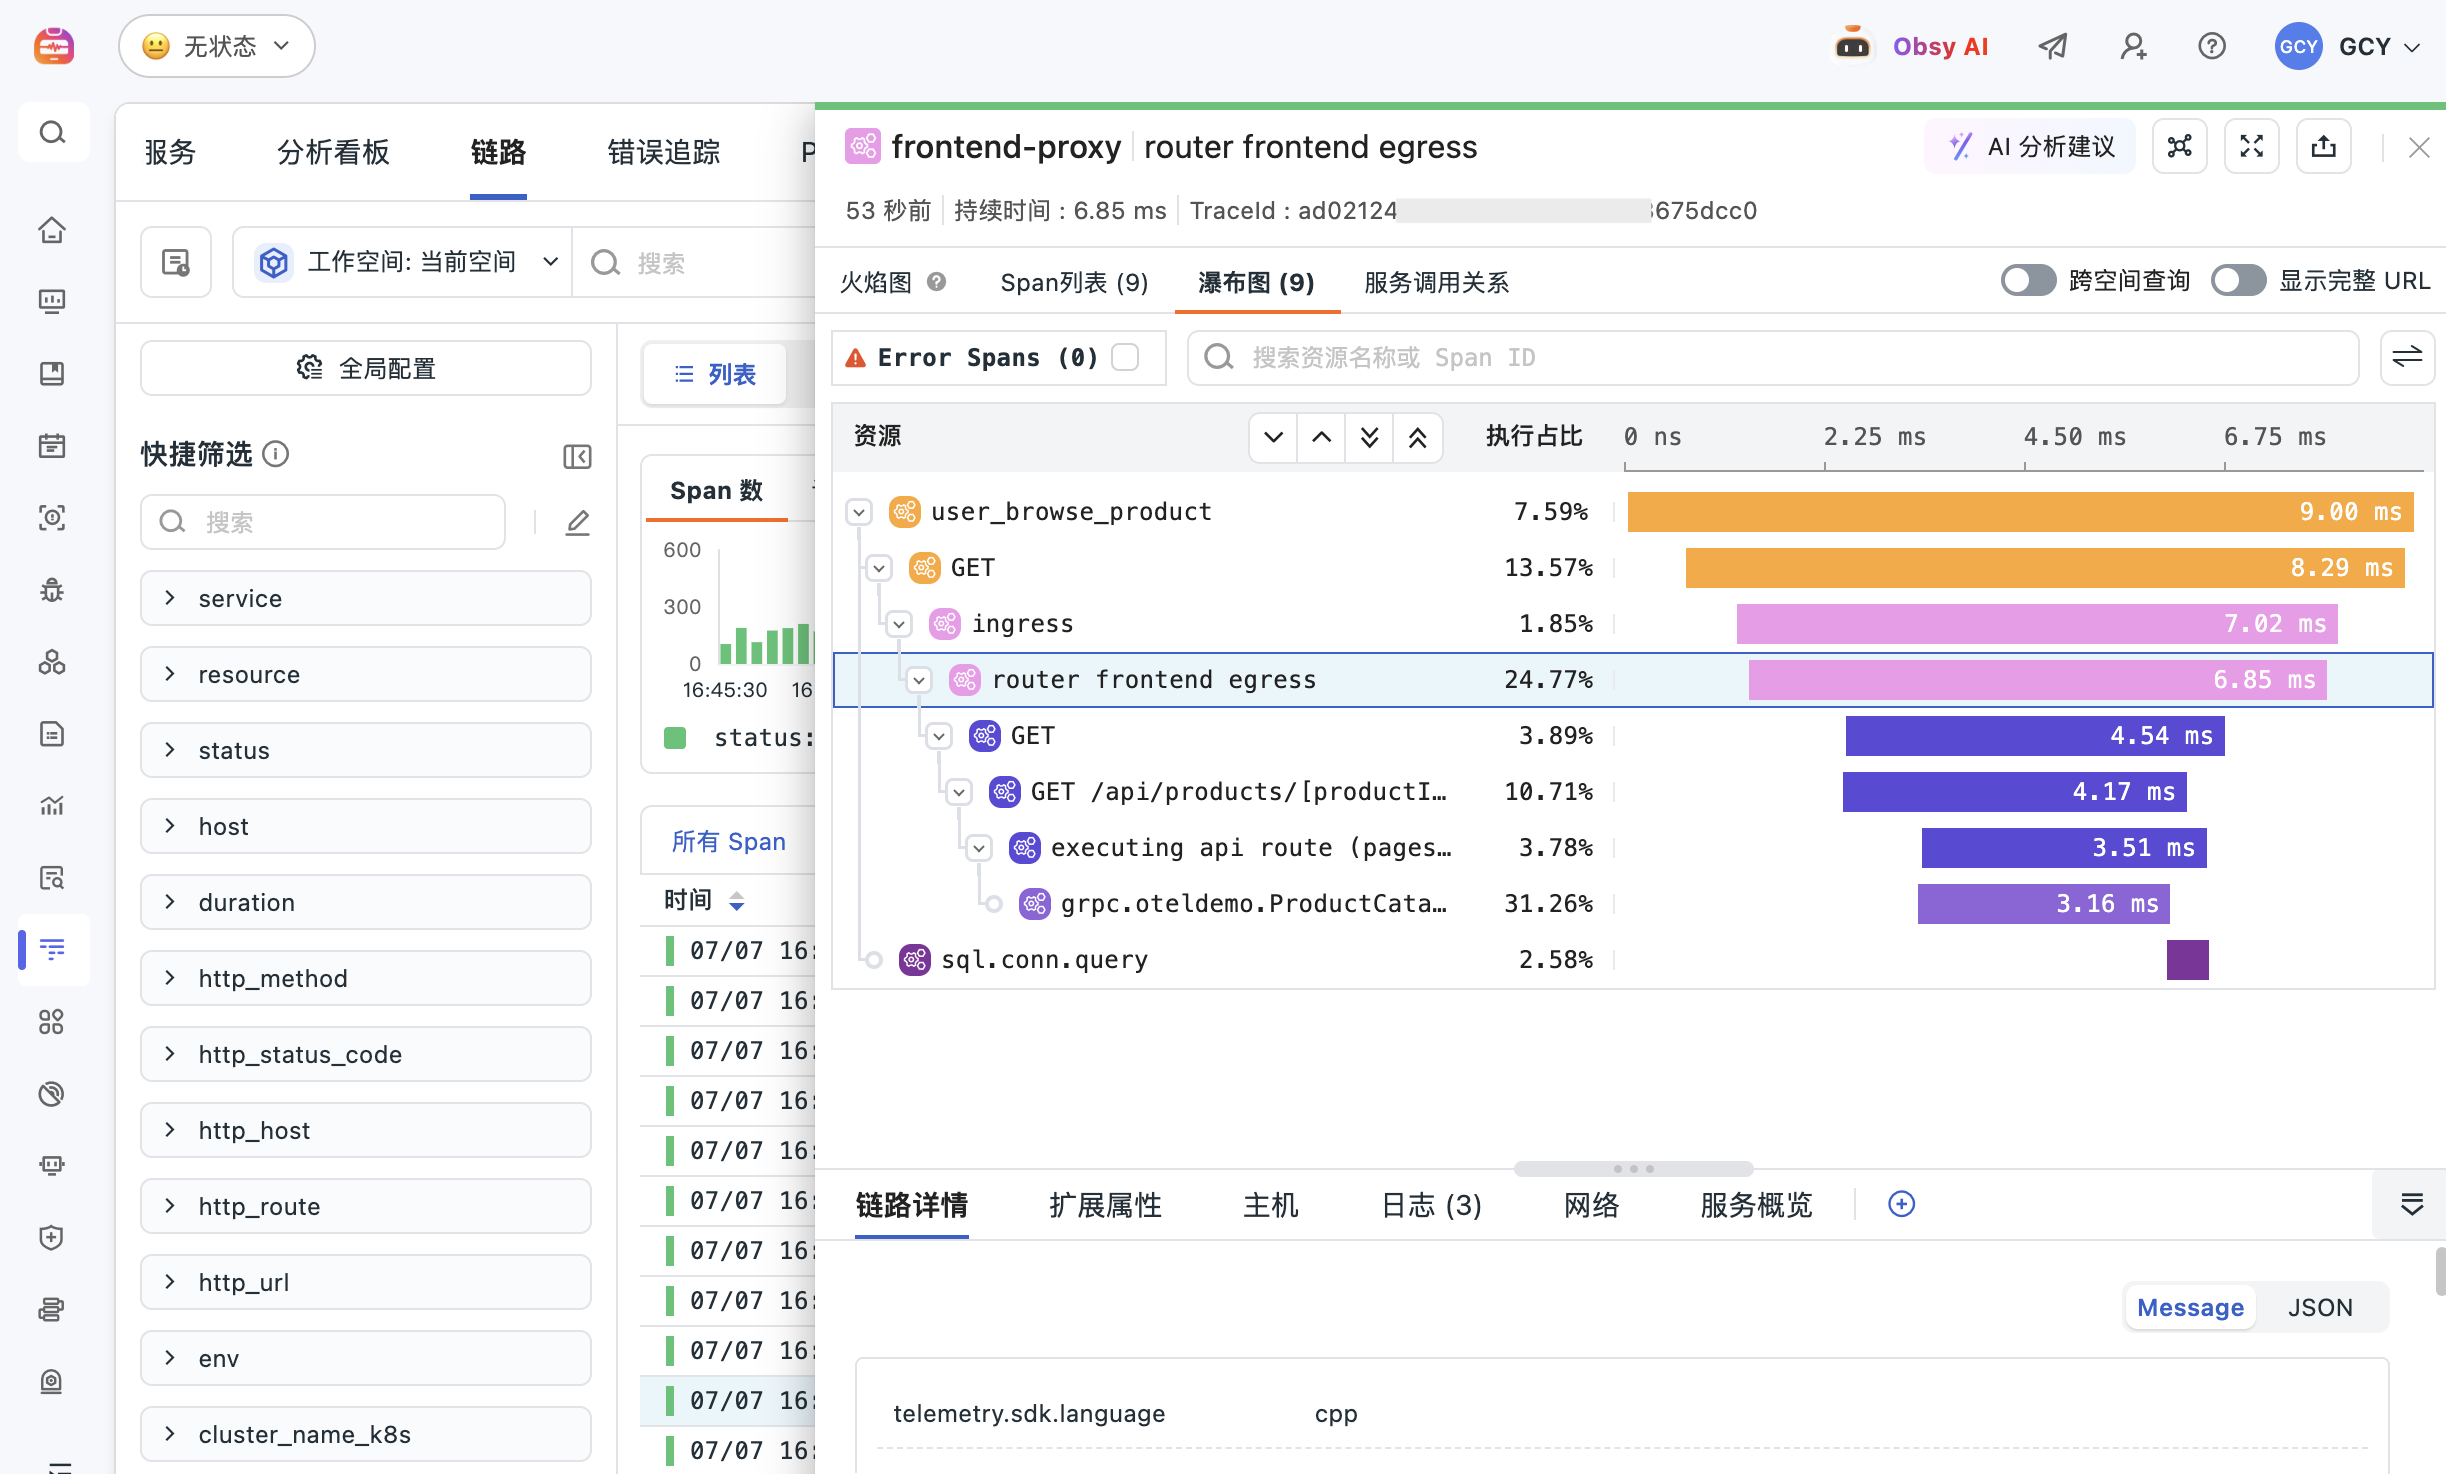
Open a representative slow or failed trace

EvidenceResponse time, error status, service path, and span timing

ConclusionIdentify the slowest span and the first abnormal dependency

Data path

Language agent / OpenTelemetry → Services, endpoints, and traces → Logs, infrastructure, and profiling context

Best for

For development, SRE, and platform teams operating microservices, distributed systems, and business-critical request paths.

Requirements

Application instrumentation or OpenTelemetry is required. Use RUM for real frontend experience and infrastructure monitoring for deeper resource analysis.

View setup guide
Error rate is rising. Identify the affected service, endpoint, and dependency
Use service and endpoint views to compare request volume, latency distributions, errors, and downstream dependencies. Segment by environment, version, region, or tag to separate a broad regression from an isolated workload.
View documentation
Error rate is rising. Identify the affected service, endpoint, and dependency
Turn recurring latency and errors into SLOs and actionable monitors
Create monitors and service objectives from throughput, latency, error, and availability signals. Route incidents with the affected service, environment, trace, and supporting evidence already attached.
View documentation
Use existing agents and OpenTelemetry without rebuilding instrumentation
Bring in common language agents, DataKit integrations, and OpenTelemetry traces. Preserve service, environment, version, and resource attributes so new telemetry joins the same investigation model.
View documentation
Use existing agents and OpenTelemetry without rebuilding instrumentation

Frequently asked questions

What is Application Performance Monitoring (APM)?

Application Performance Monitoring continuously measures service requests, latency, throughput, errors, dependencies, and code execution. Guance connects those signals to logs, infrastructure, RUM, and release context so teams can investigate an unknown production issue without rebuilding context in several tools.

How does Guance APM help investigate a slow request?

Start with a slow endpoint or service, open an affected trace, compare span duration and status, and then inspect related logs, infrastructure, database work, or profiling data. This evidence-led workflow narrows the issue to the responsible service, dependency, resource, or code hotspot.

Can APM data be correlated with logs and infrastructure?

Yes. Shared trace, service, environment, host, container, and Kubernetes attributes connect an application request to the surrounding logs and resource state.

Does Guance support OpenTelemetry and common language agents?

Yes. Guance can ingest OpenTelemetry data and supports common language and framework integrations through DataKit and compatible collectors. Exact setup depends on the runtime and collection architecture.

How is APM different from infrastructure monitoring?

Infrastructure monitoring explains the health and capacity of hosts, containers, clusters, and cloud resources. APM explains how application requests move through services and code. Used together, they show whether a user-facing issue comes from application logic, a dependency, or resource pressure.


Continue exploring application performance

Connect APM to database, log, OpenTelemetry, platform, and pricing resources.

Get started > View documentation > View pricing >