Frequently asked questions
What is Application Performance Monitoring (APM)?
Application Performance Monitoring continuously measures service requests, latency, throughput, errors, dependencies, and code execution. Guance connects those signals to logs, infrastructure, RUM, and release context so teams can investigate an unknown production issue without rebuilding context in several tools.
How does Guance APM help investigate a slow request?
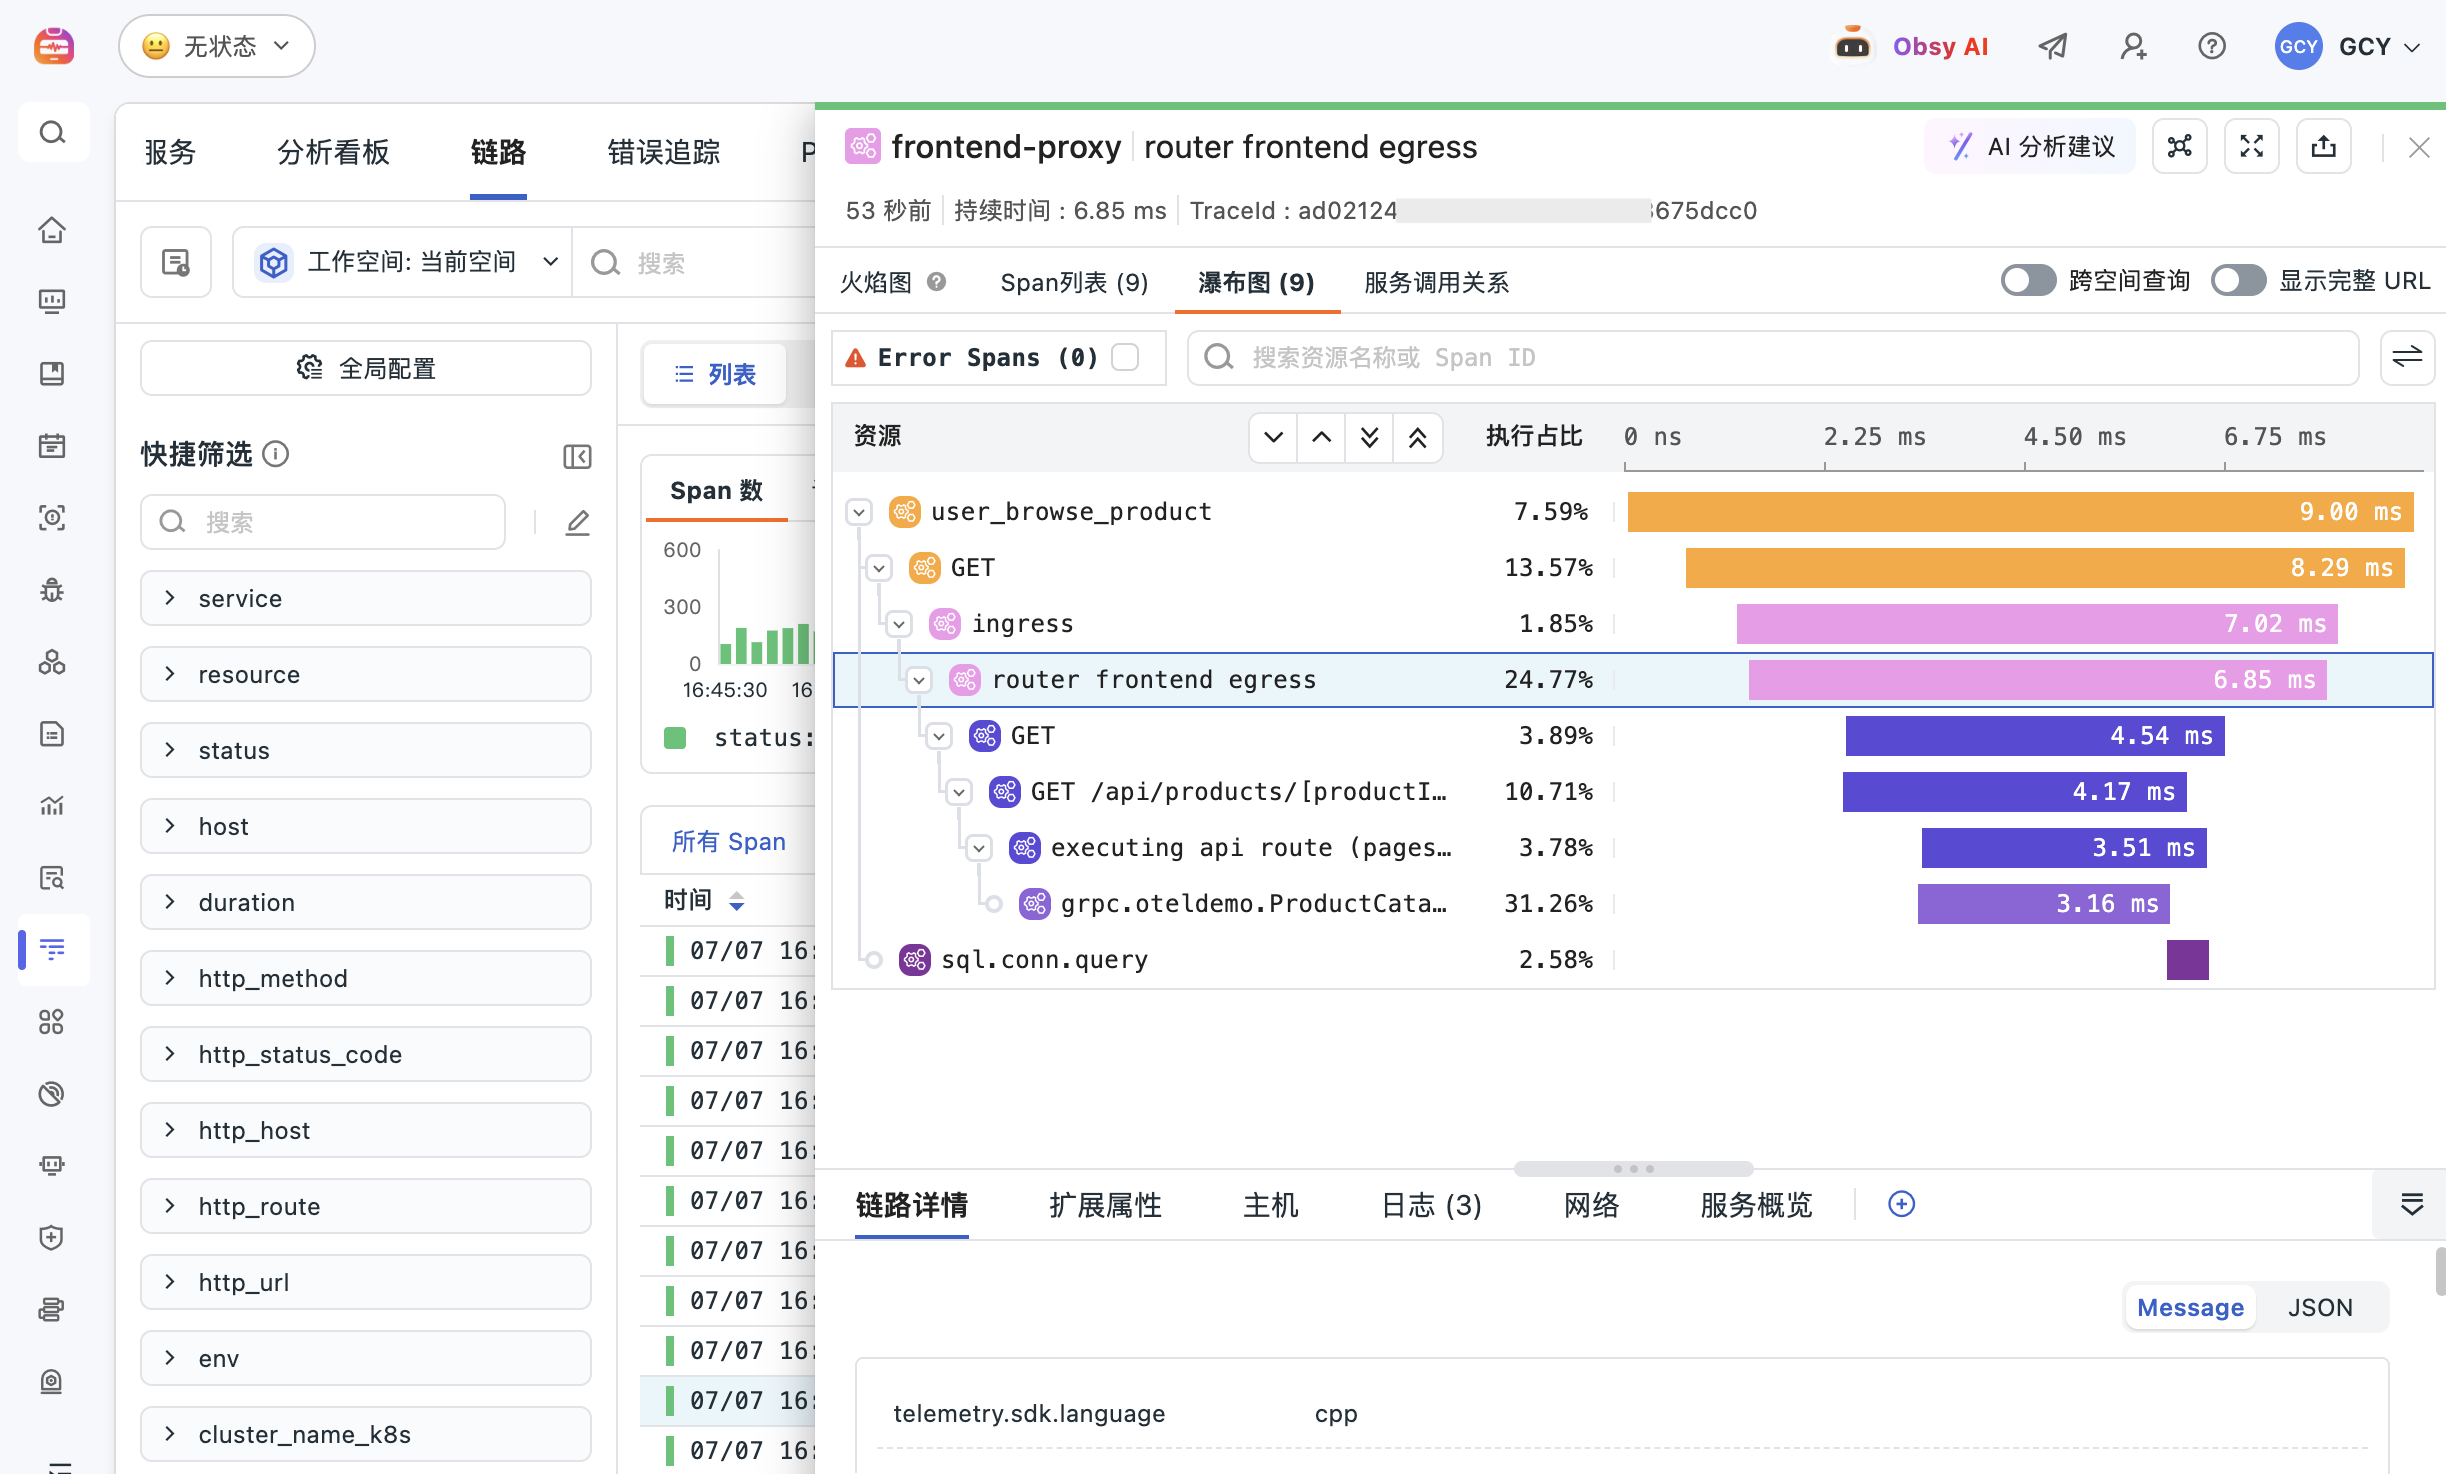
Start with a slow endpoint or service, open an affected trace, compare span duration and status, and then inspect related logs, infrastructure, database work, or profiling data. This evidence-led workflow narrows the issue to the responsible service, dependency, resource, or code hotspot.
Can APM data be correlated with logs and infrastructure?
Yes. Shared trace, service, environment, host, container, and Kubernetes attributes connect an application request to the surrounding logs and resource state.
Does Guance support OpenTelemetry and common language agents?
Yes. Guance can ingest OpenTelemetry data and supports common language and framework integrations through DataKit and compatible collectors. Exact setup depends on the runtime and collection architecture.
How is APM different from infrastructure monitoring?
Infrastructure monitoring explains the health and capacity of hosts, containers, clusters, and cloud resources. APM explains how application requests move through services and code. Used together, they show whether a user-facing issue comes from application logic, a dependency, or resource pressure.