Frequently asked questions
What is Continuous Profiling?
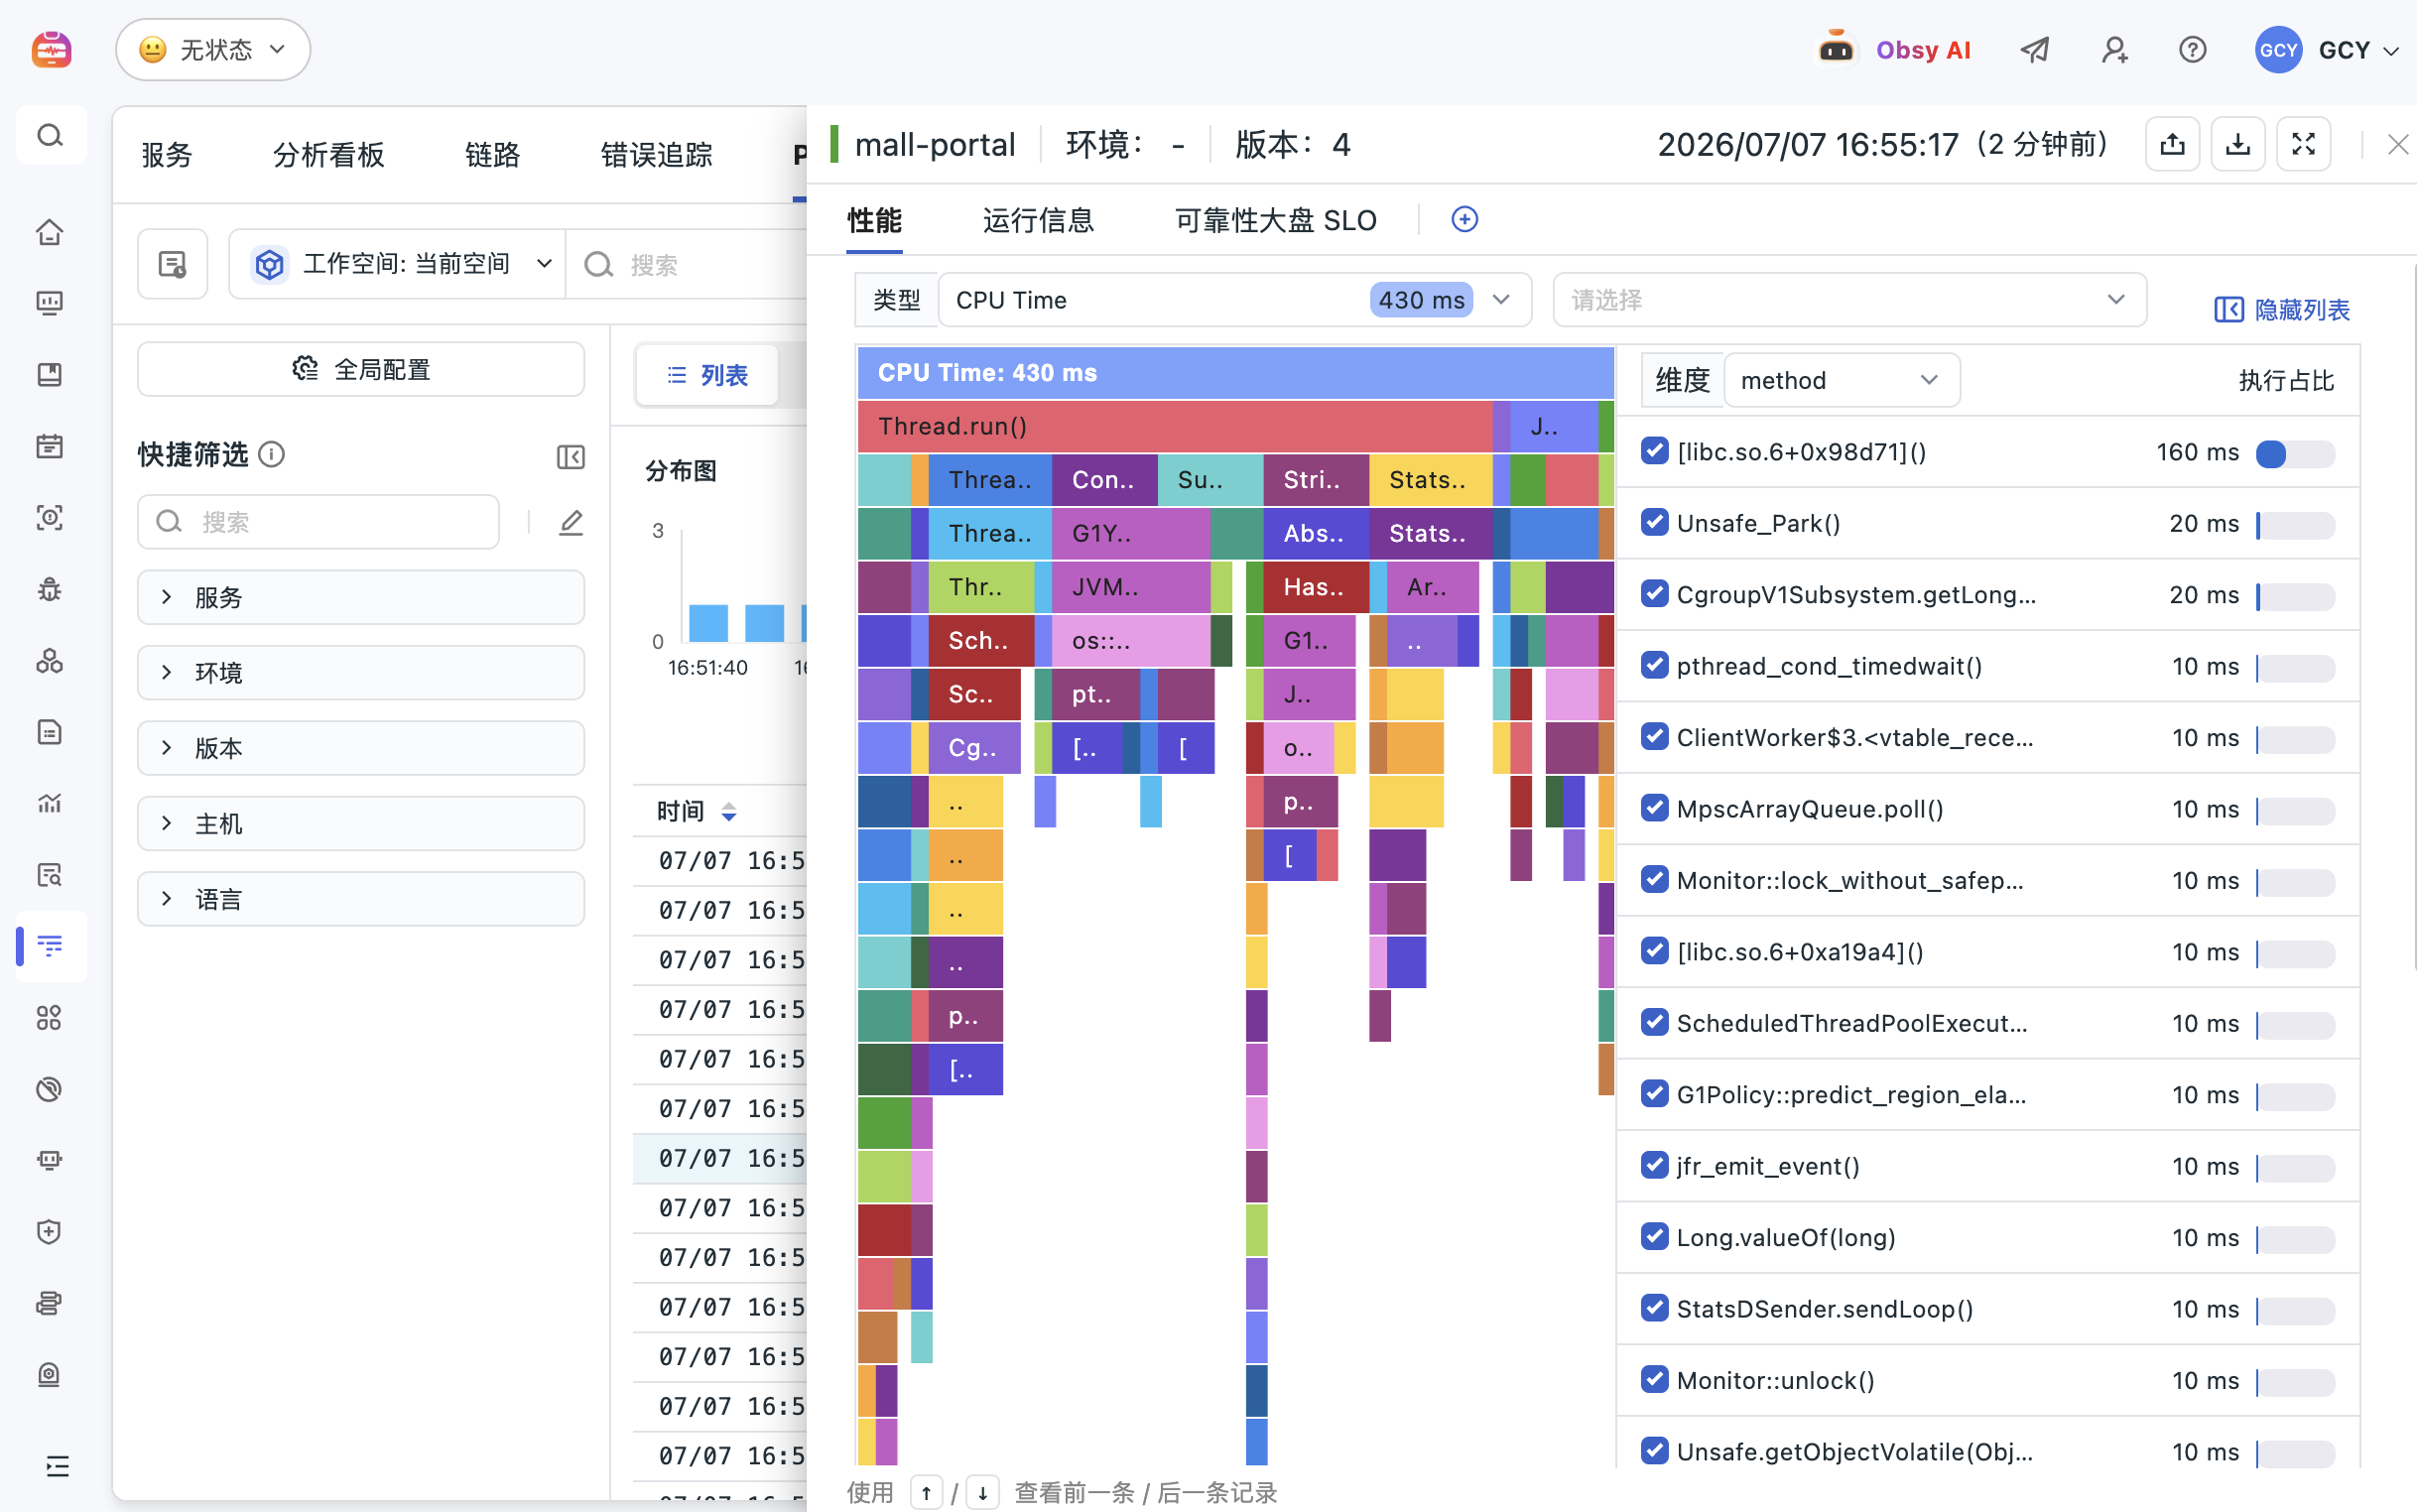
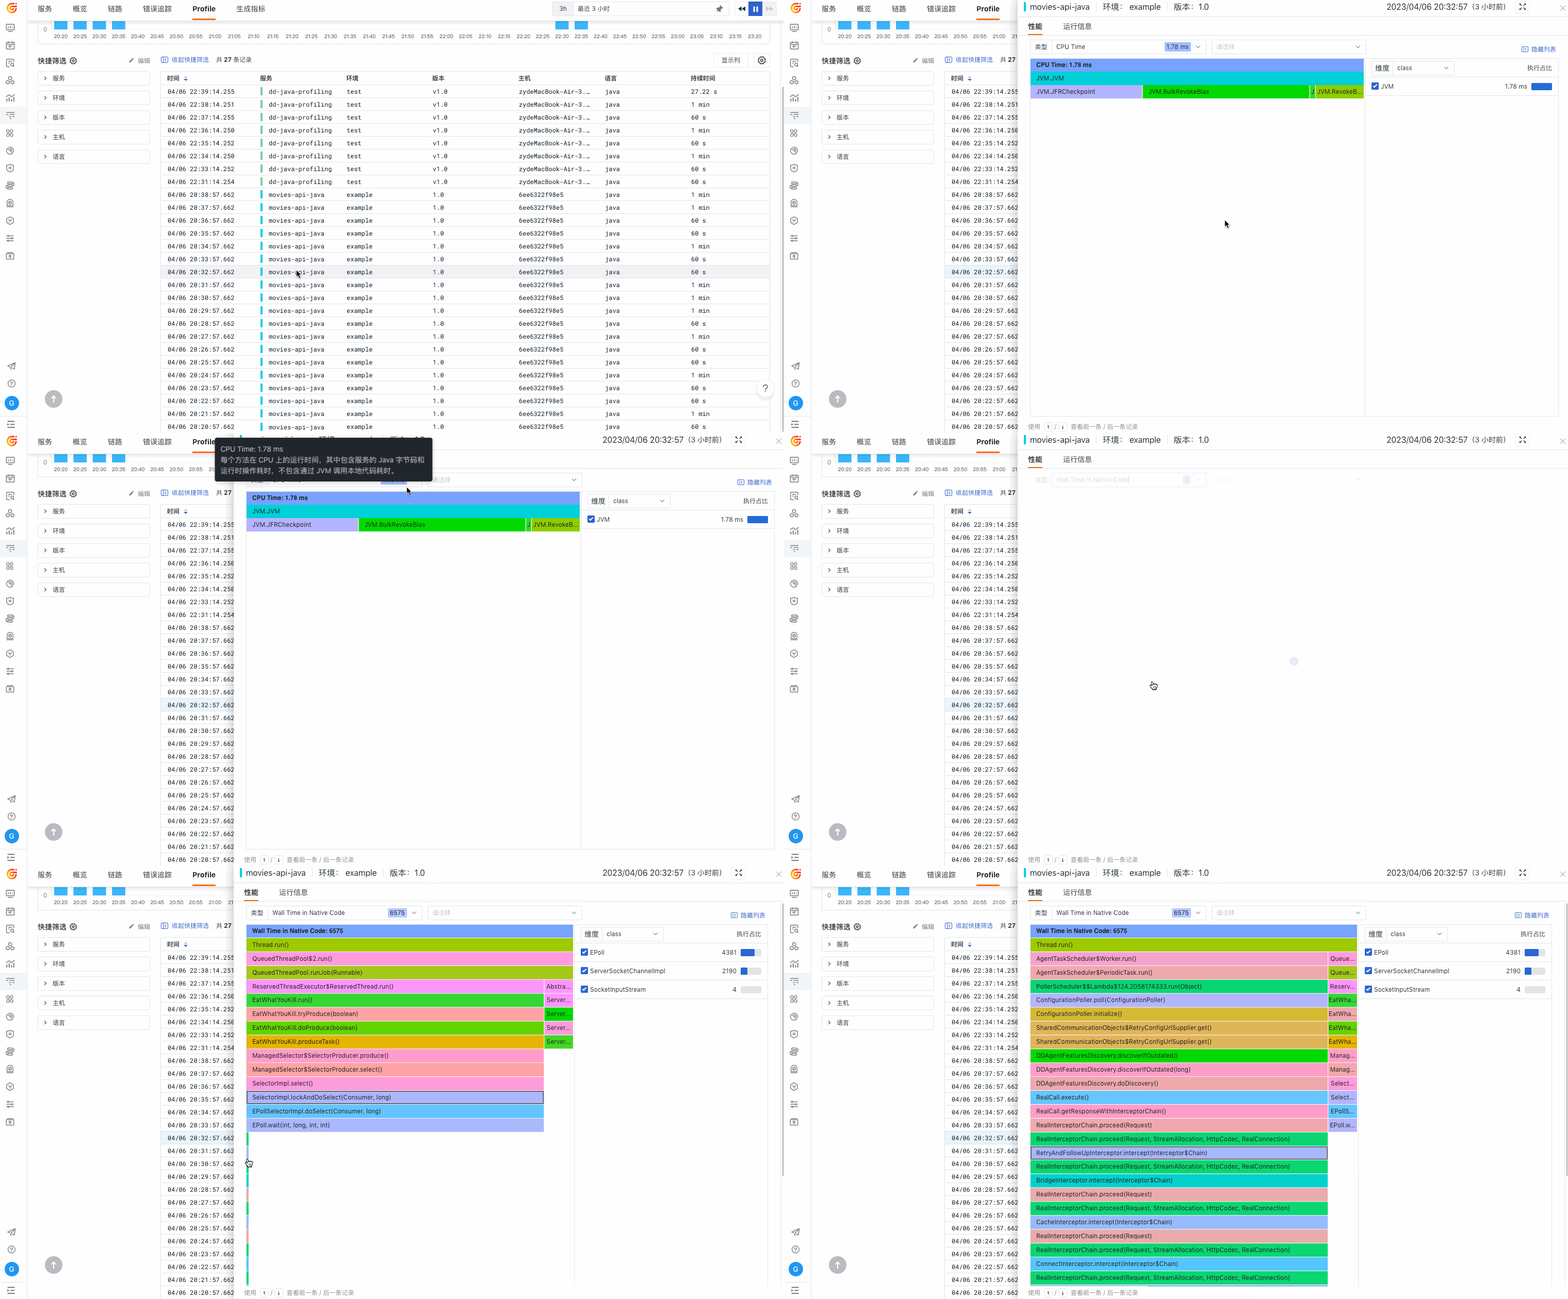
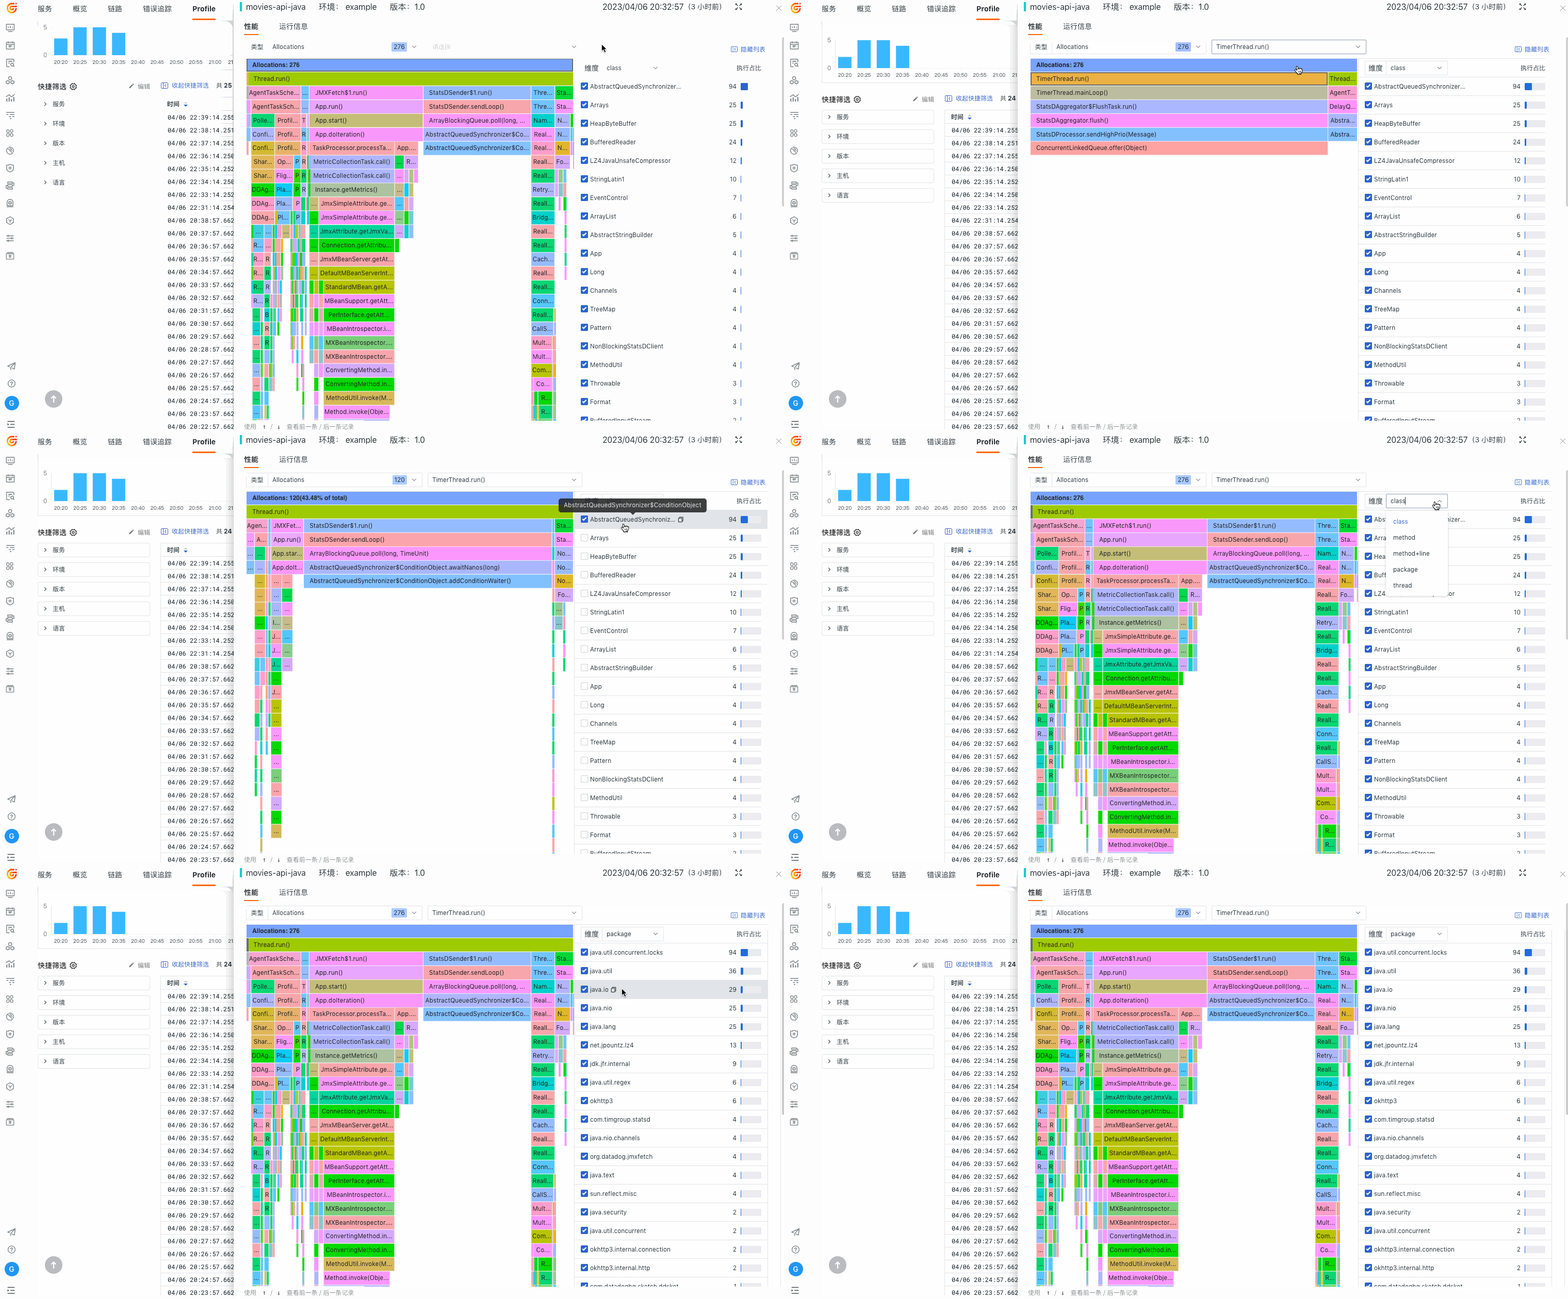
Continuous Profiling samples how production code uses CPU, memory, locks, I/O, queries, and function calls over time. It helps teams find code-level performance bottlenecks that aggregate service metrics and traces may not explain.
How is profiling different from an APM trace?
An APM trace shows how a request moves through services and how long each span took. A profile shows what the code and runtime were doing, such as CPU work, allocations, locks, I/O, and function calls, during the relevant period.
Which issues can production profiling help investigate?
Common investigations include slow endpoints, high CPU, unexpected allocation, memory pressure, lock contention, I/O waits, slow queries, and performance regressions after a release.
Can Guance correlate profiles with traces?
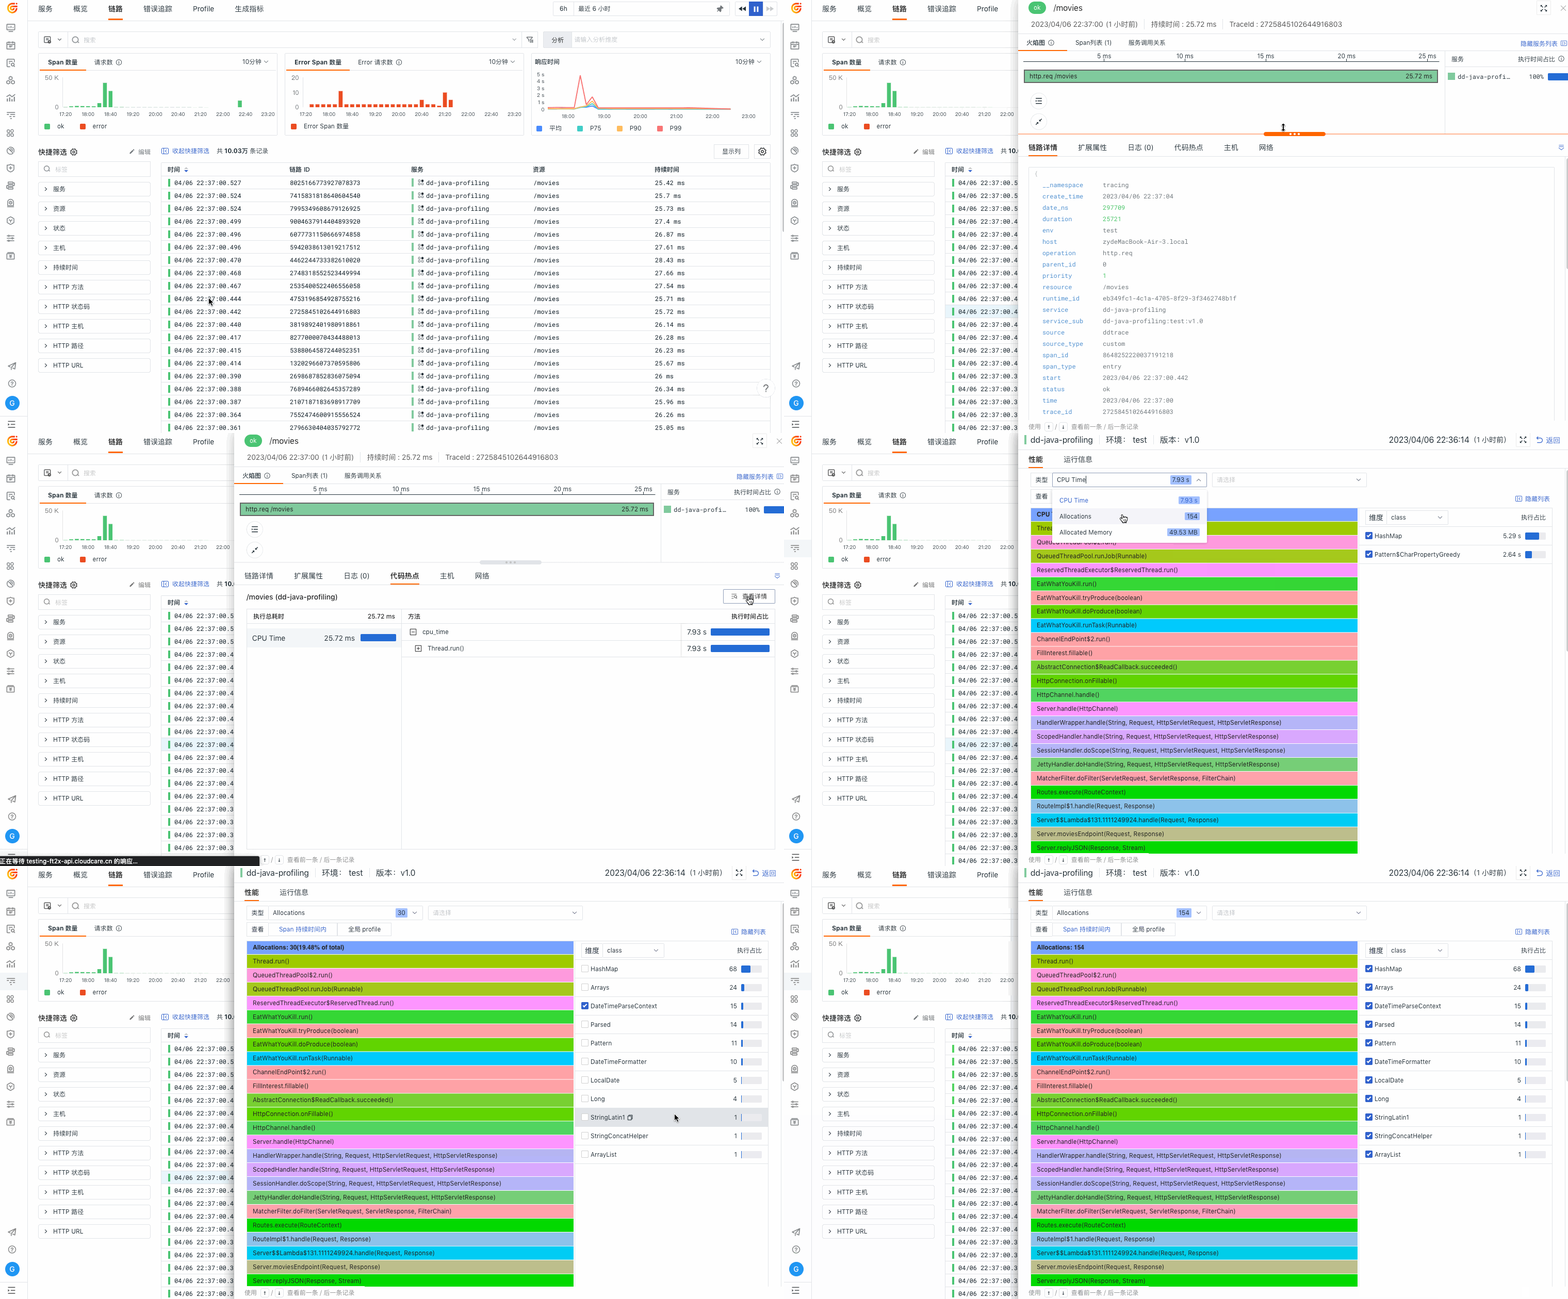
Yes. Guance supports trace-to-profile analysis for documented runtimes and configurations, helping teams move from an affected span to code hotspots in the corresponding service and time window.