Dashboards and Data Visualization

Turn observability data into dashboards your teams can act on

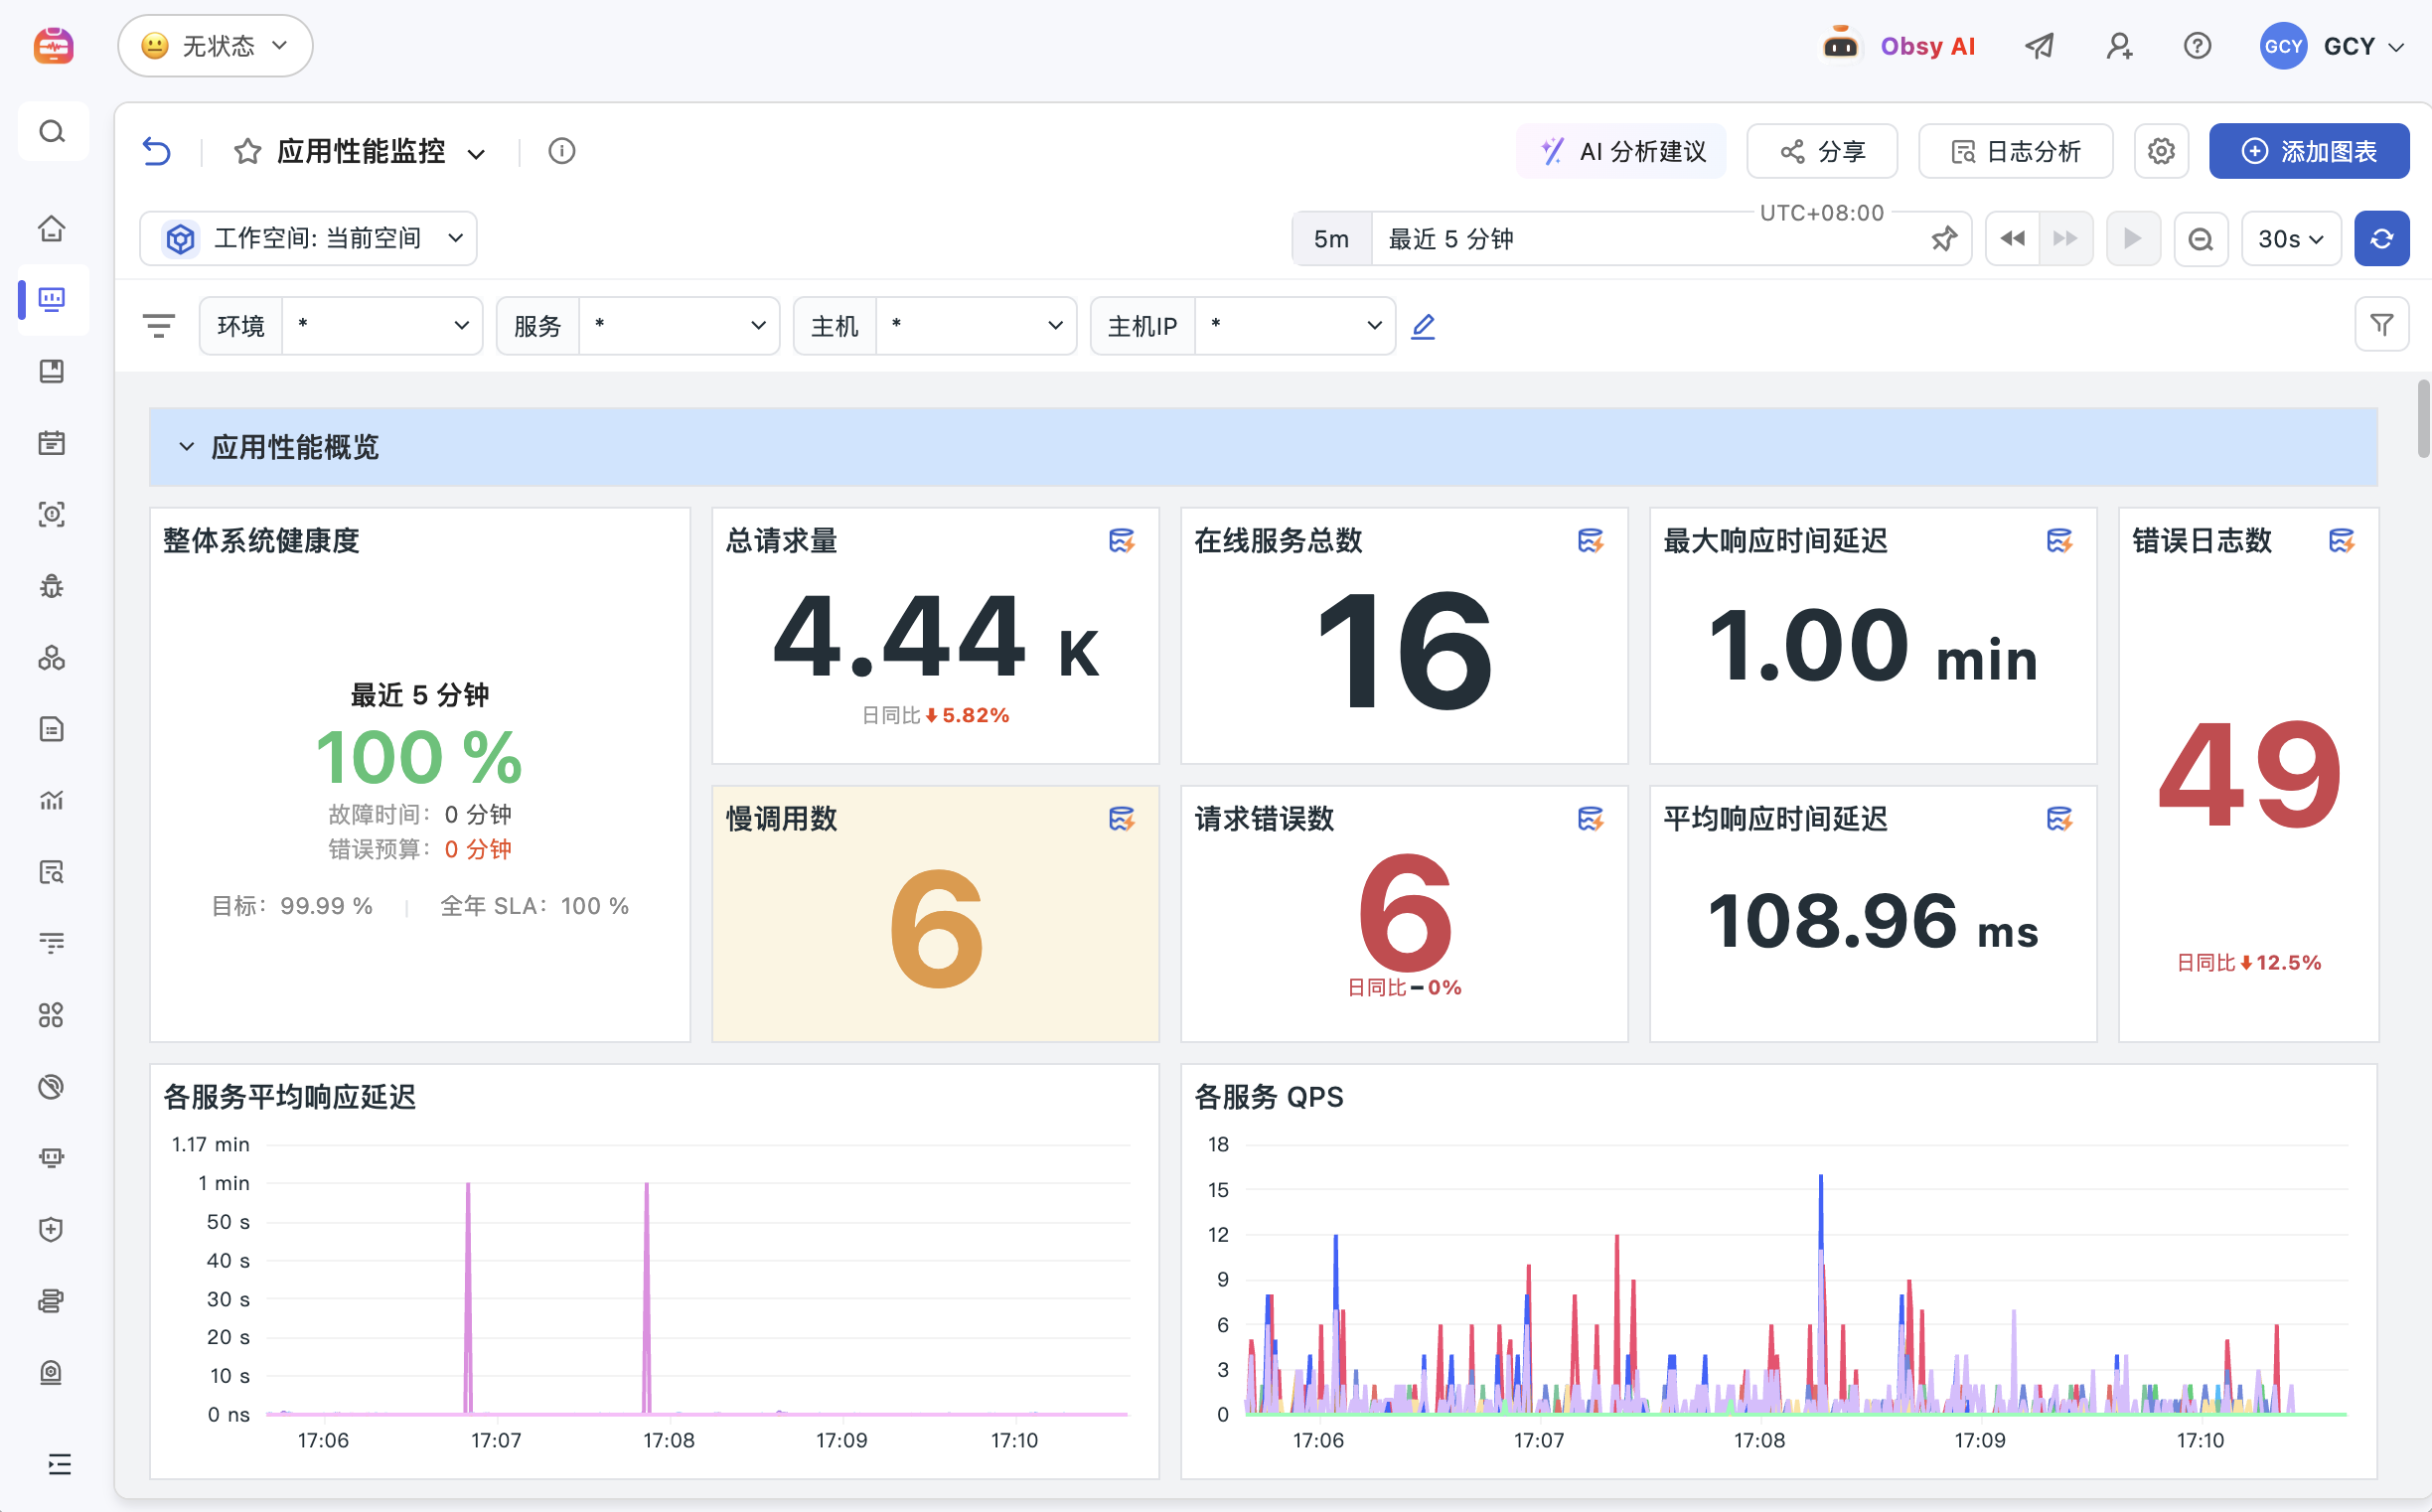
Guance brings metrics, logs, traces, RUM, infrastructure, events, and business data into shared dashboards, viewers, and notes. Teams can move from a trend to the supporting evidence without rebuilding the investigation in separate tools.

Turn observability data into dashboards your teams can act on
Start with a monitoring template, then adapt it to your service and ownership model
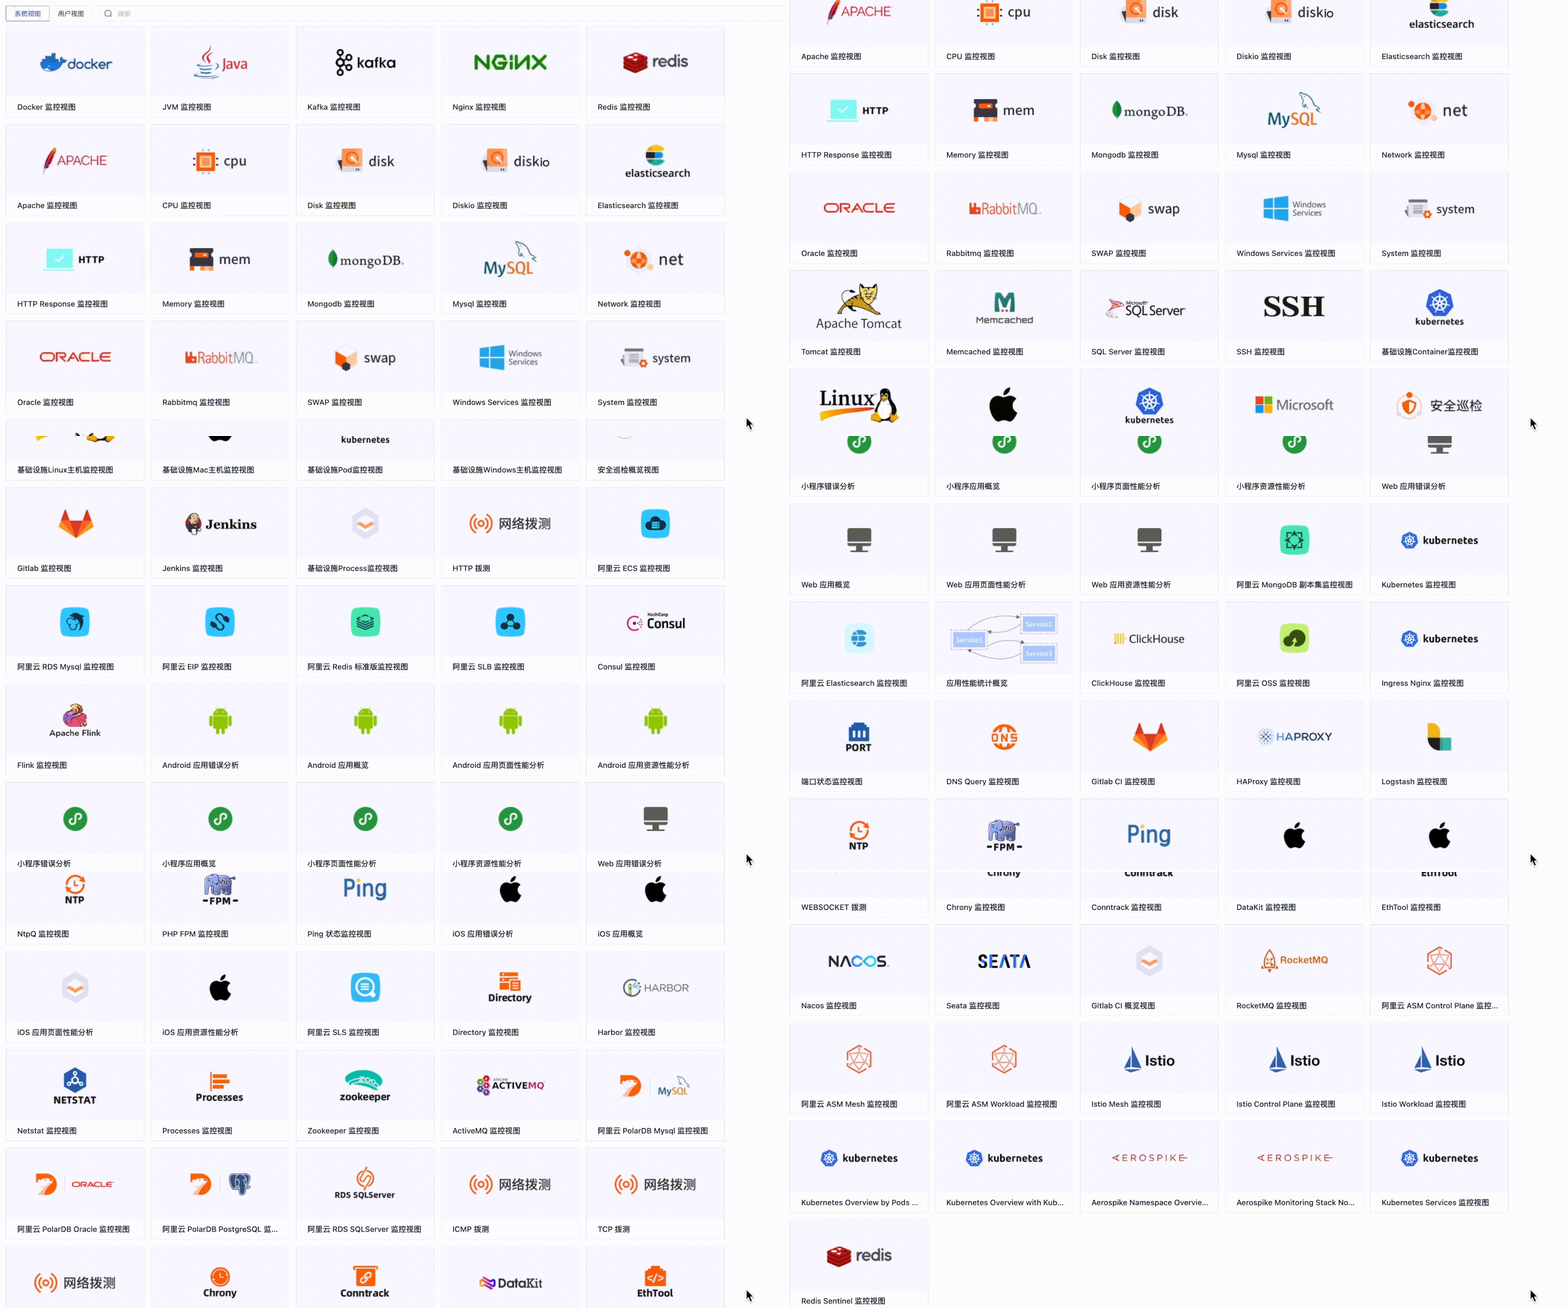
Guance provides monitoring views for infrastructure, middleware, Kubernetes, applications, availability, and cloud resources. Platform teams can establish a standard starting point, while service owners adjust variables, tags, and widgets for their environment and responsibilities.
View documentation
Start with a monitoring template, then adapt it to your service and ownership model
Design dashboards around a decision, not around a collection of unrelated charts
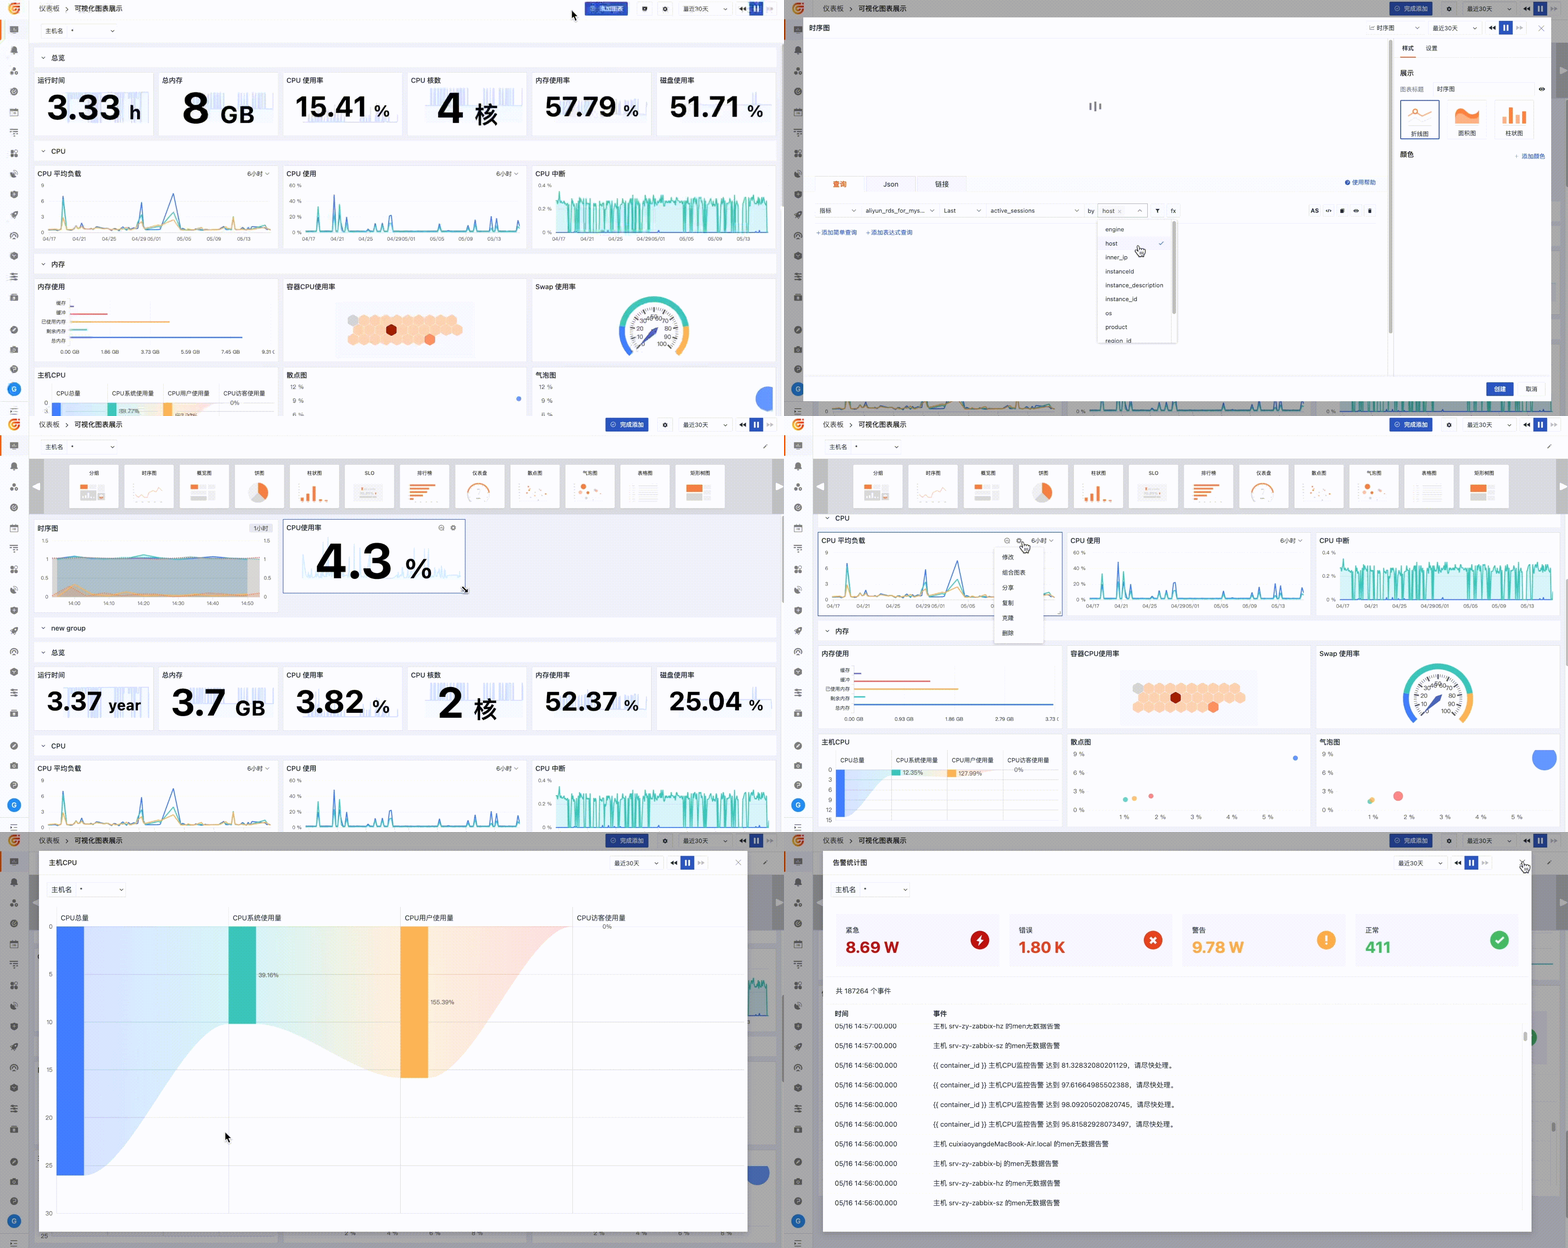
Flexible layouts, visualization widgets, variables, and DQL queries let teams combine service indicators, logs, traces, events, and business measures in one operating view. Custom viewers can also reflect the fields and workflows of a specific data type.
View documentation
Move from a trend to related telemetry without losing the time and filter context
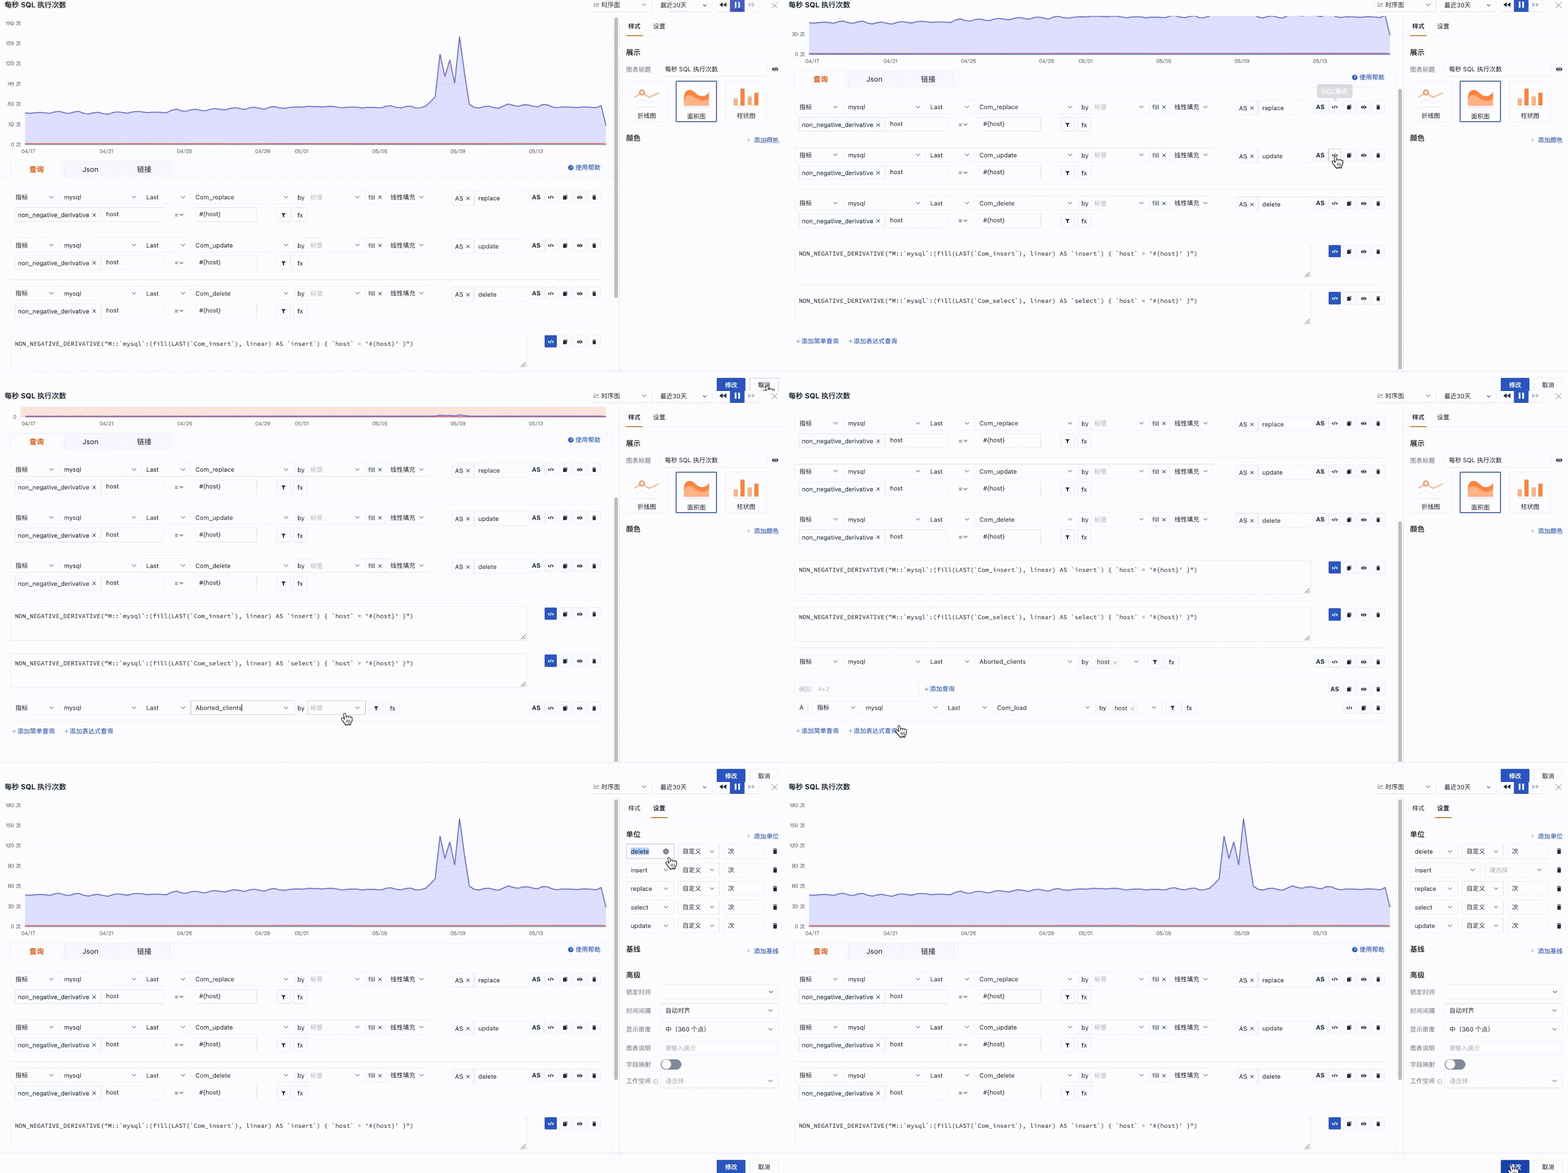
Simple queries, expressions, DQL, aliases, unit conversion, time locking, and contextual links help explain why a chart changed. Teams can continue from an aggregate signal into the relevant log, trace, resource, security event, or user session.
View documentation
Move from a trend to related telemetry without losing the time and filter context
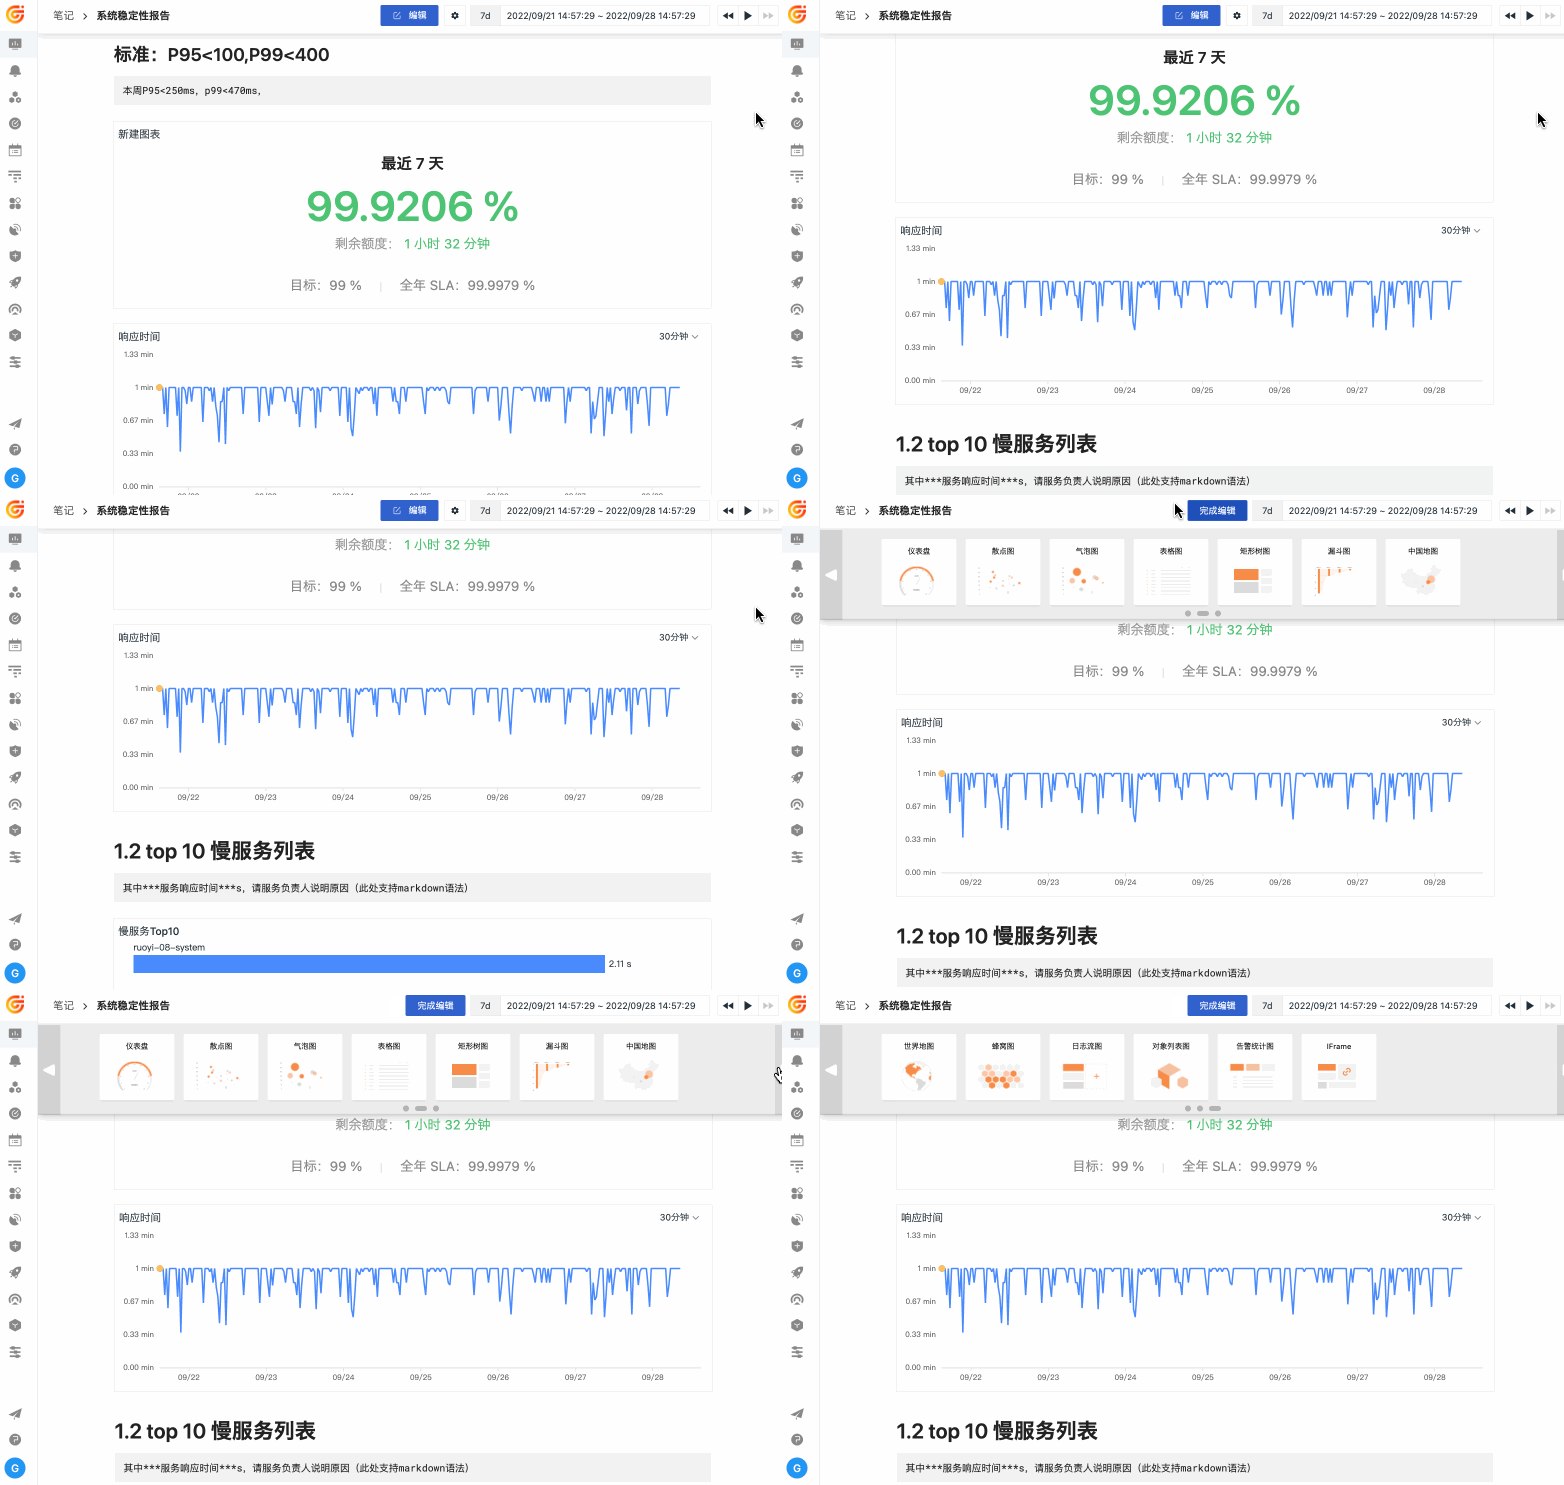
Turn a temporary investigation into a reusable note with its evidence attached
Notes retain charts, query conditions, observations, and conclusions for hand-offs and post-incident review. New responders can return to the same evidence instead of reconstructing the analysis from screenshots and chat messages.
View documentation

Frequently asked questions

What can teams visualize in Guance dashboards?

Teams can visualize and compare metrics, logs, traces, RUM, infrastructure, network, security, events, and selected business data. Available widgets and fields depend on the connected data and query.

How are Guance dashboards different from static monitoring charts?

Dashboards can use DQL queries, variables, shared filters, time controls, and contextual links so a team can move from a summary chart into the telemetry and resource records behind it.

How do dashboards support incident investigation and hand-off?

Teams can standardize common investigation views, preserve filters and charts in notes, and share the same context with responders and reviewers instead of recreating each query.


Continue from a dashboard into the evidence behind it

Explore metrics, logs, APM, visualization solutions, documentation, and pricing.

Get started > View documentation > View pricing >