Database Monitoring

Find slow queries, blocking sessions, and database bottlenecks in context

Guance Database Monitoring connects instance load, query performance, wait events, blocking sessions, host resources, slow-query logs, and application traces so developers, DBAs, and SRE teams can move from a latency symptom to the responsible query or resource constraint.

Find slow queries, blocking sessions, and database bottlenecks in context

What Database Monitoring helps you solve

Investigate database performance from instance load to the query causing impact

When an API slows down, a connection pool fills, or lock waits rise, Guance keeps instance metrics, query samples, wait states, blocking sessions, host resources, logs, and service context in one investigation. Teams can determine whether the constraint is a query, a session, an object change, or the underlying infrastructure.

Supported databases

Monitor major database engines through one investigation workflow

Guance uses DataKit integrations to bring instance, query, session, metric, and log context from supported database engines into a shared workspace.

Available fields, metrics, and setup steps vary by DataKit integration. Refer to the integration documentation for the selected engine.

Many instances, one starting point for load, throughput, and contention
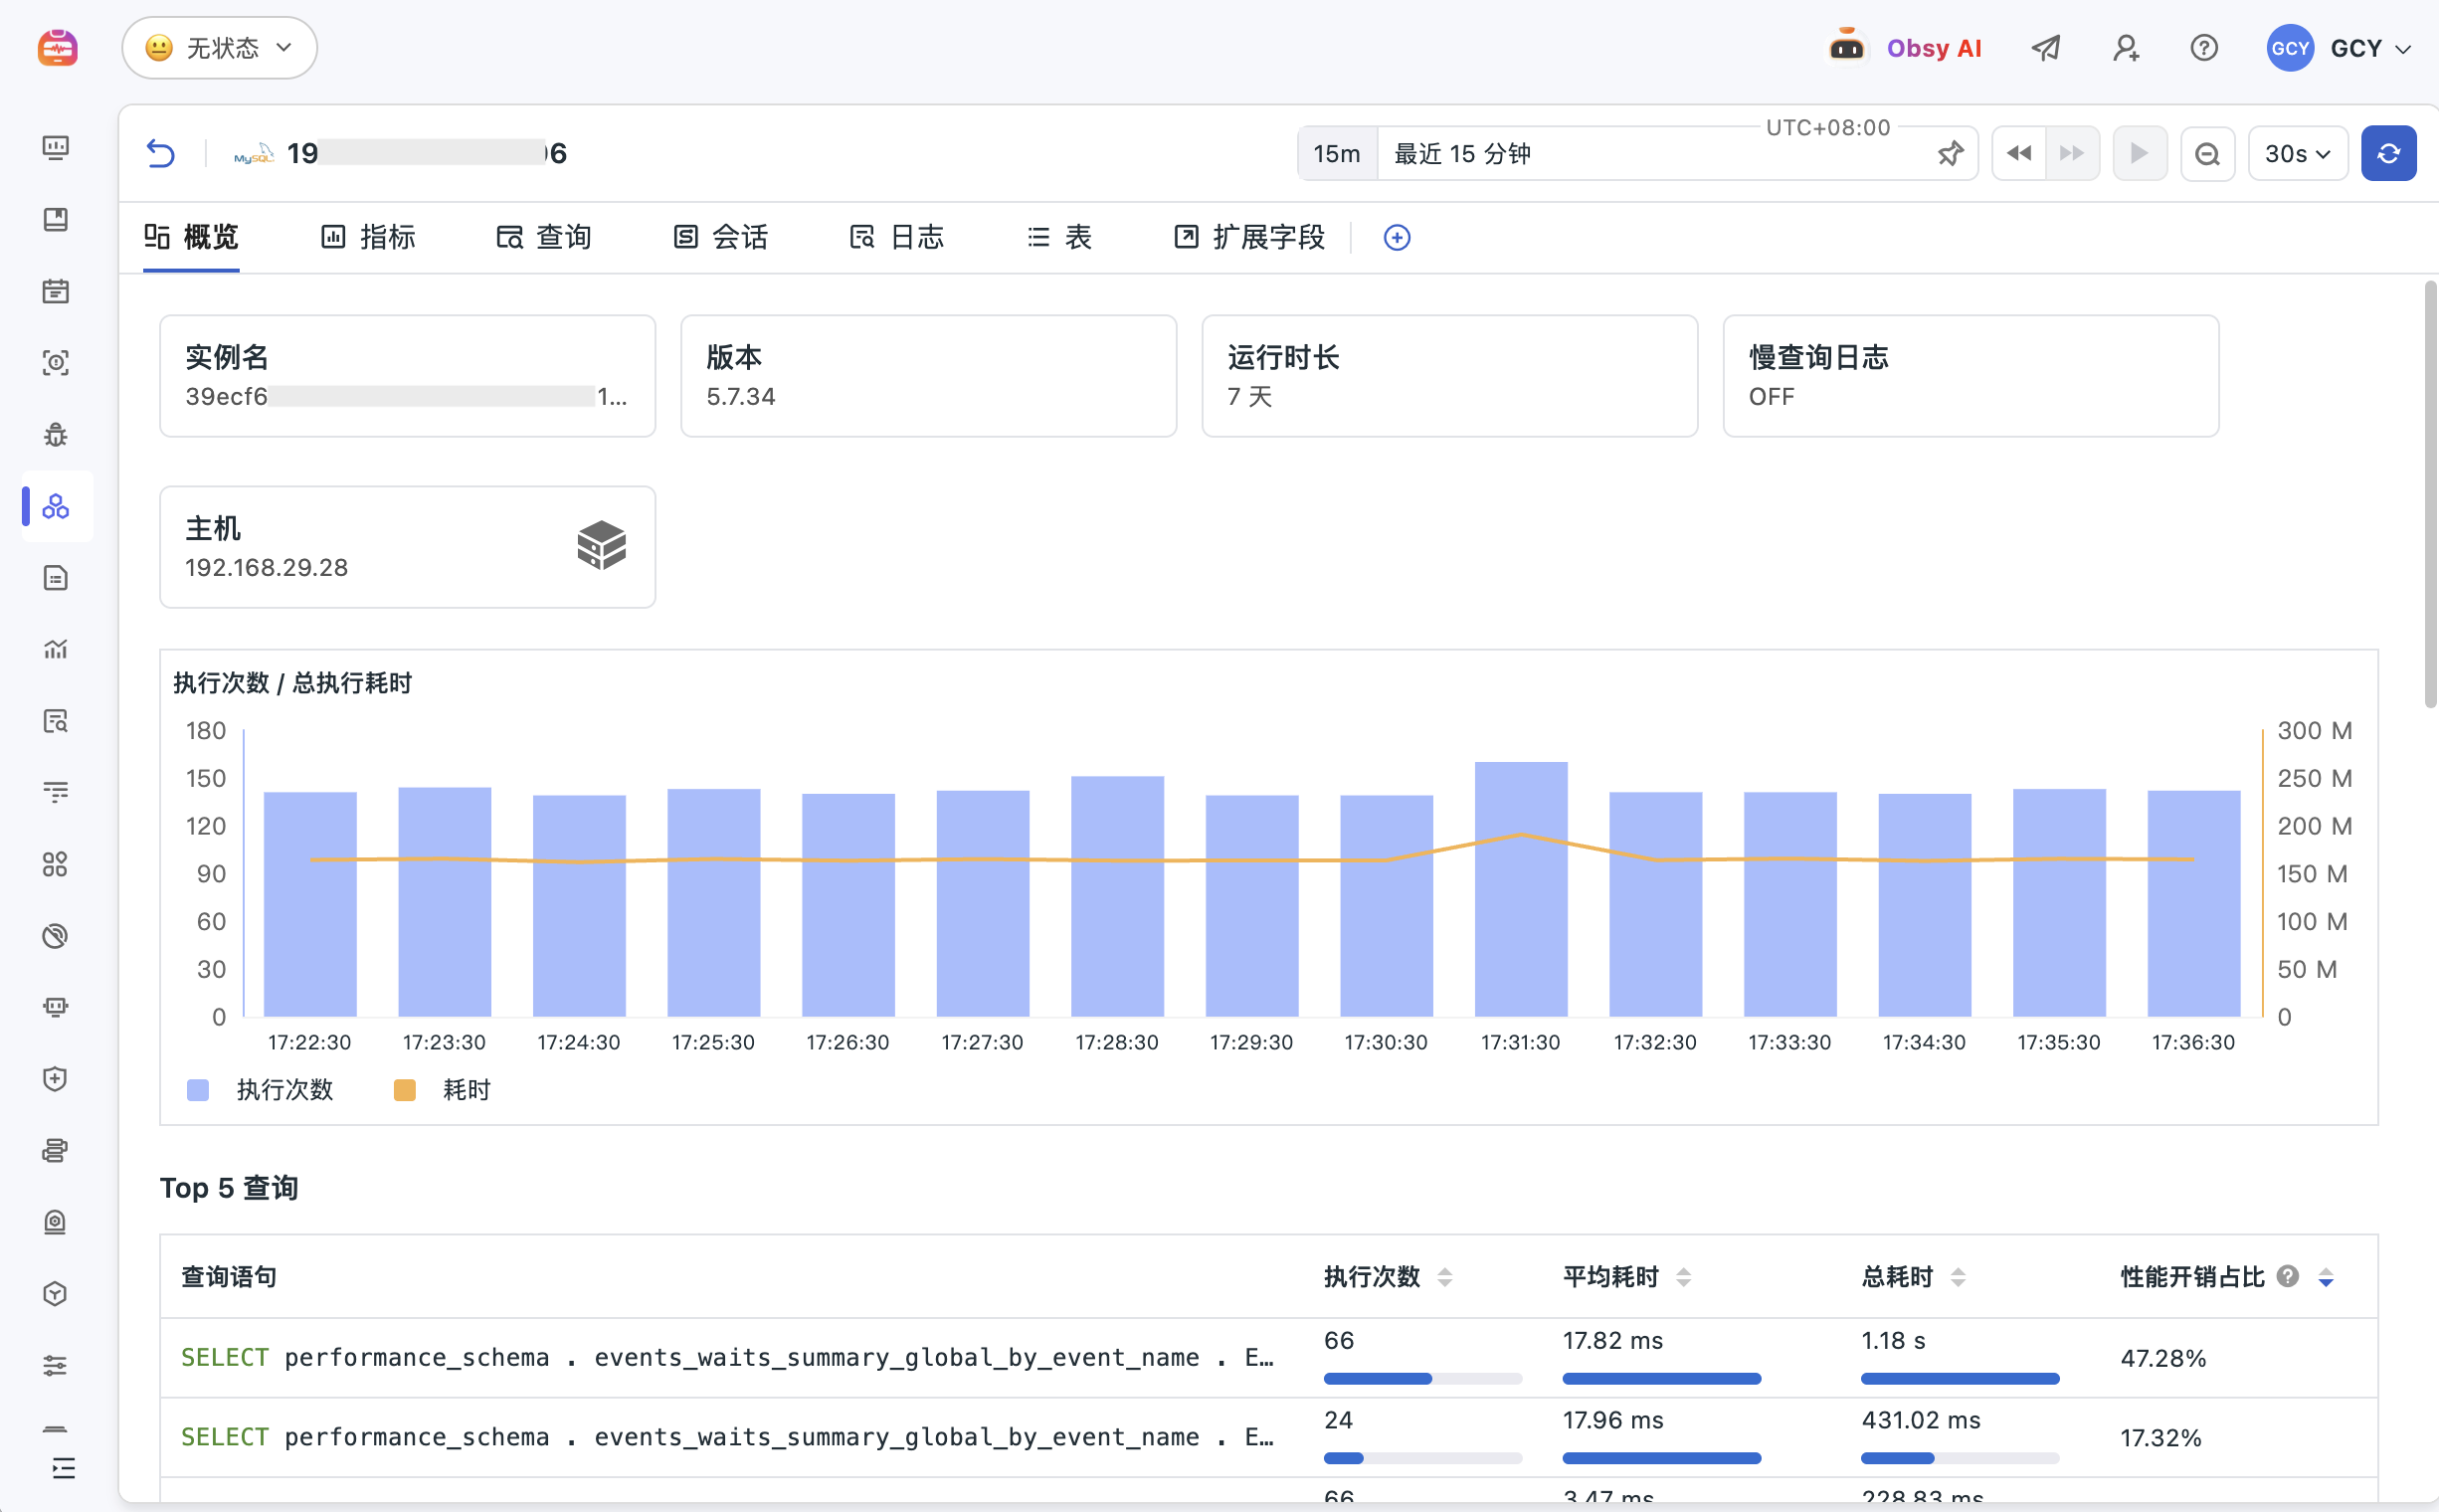
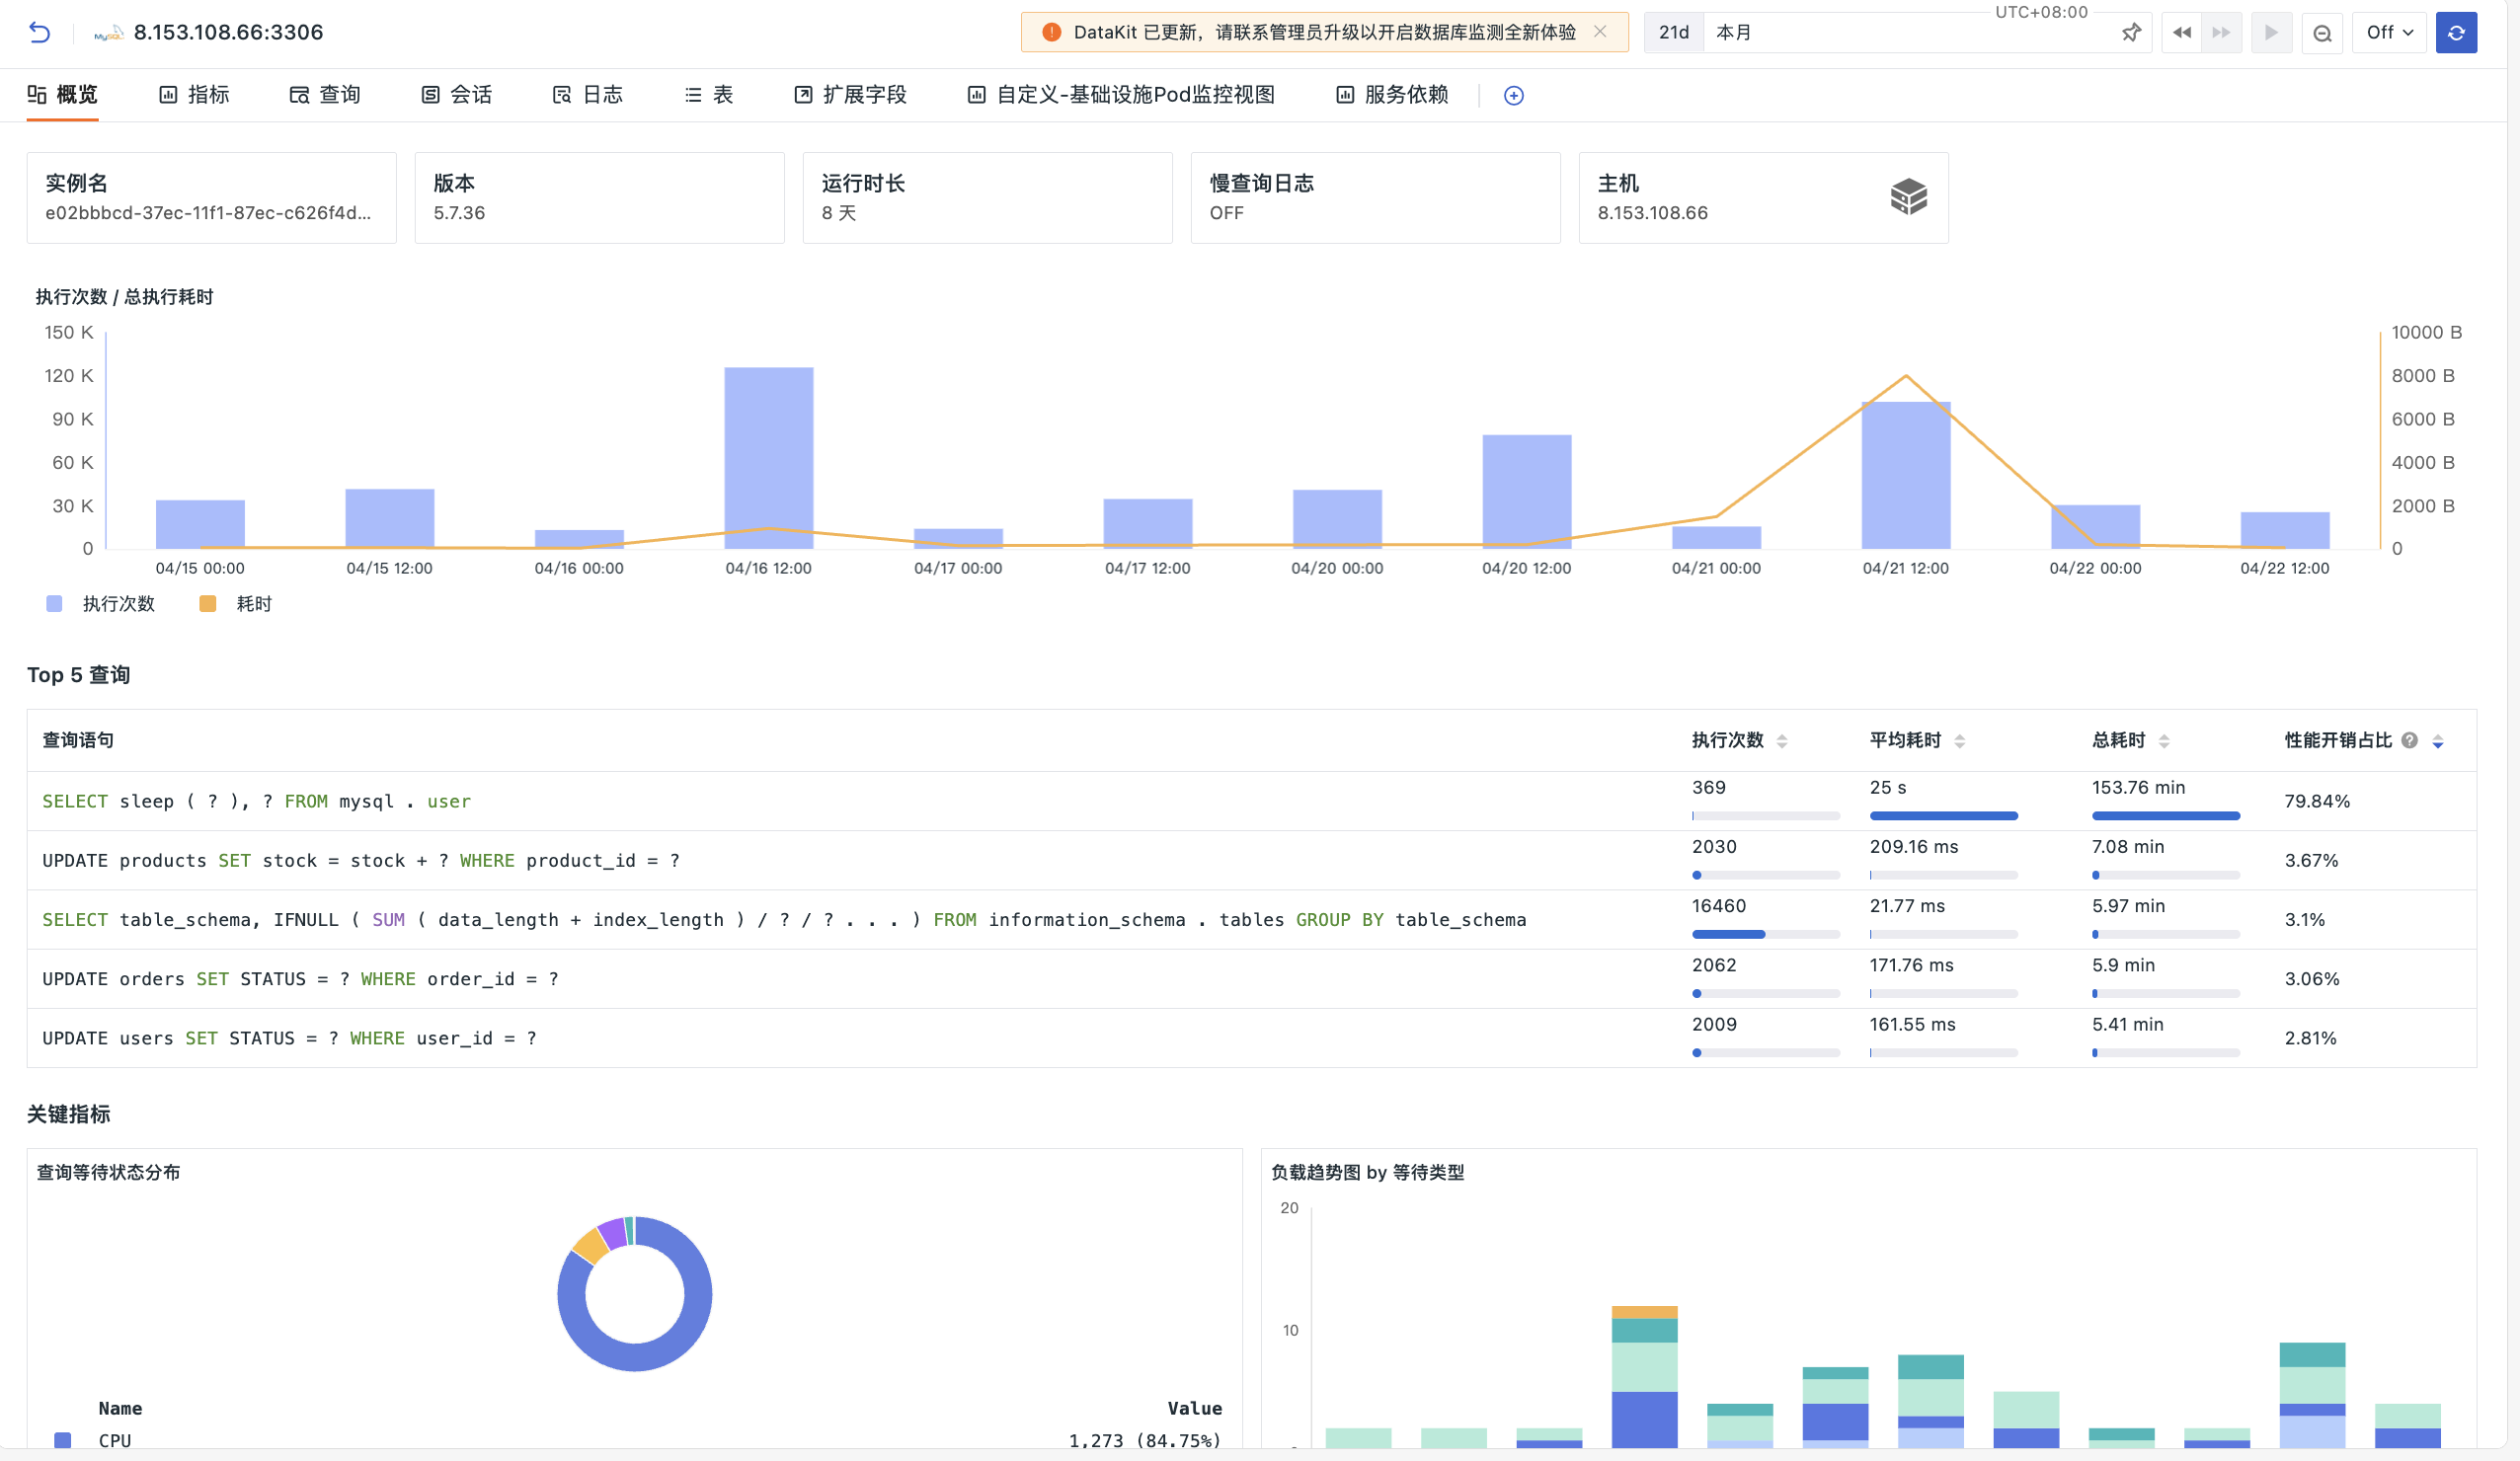
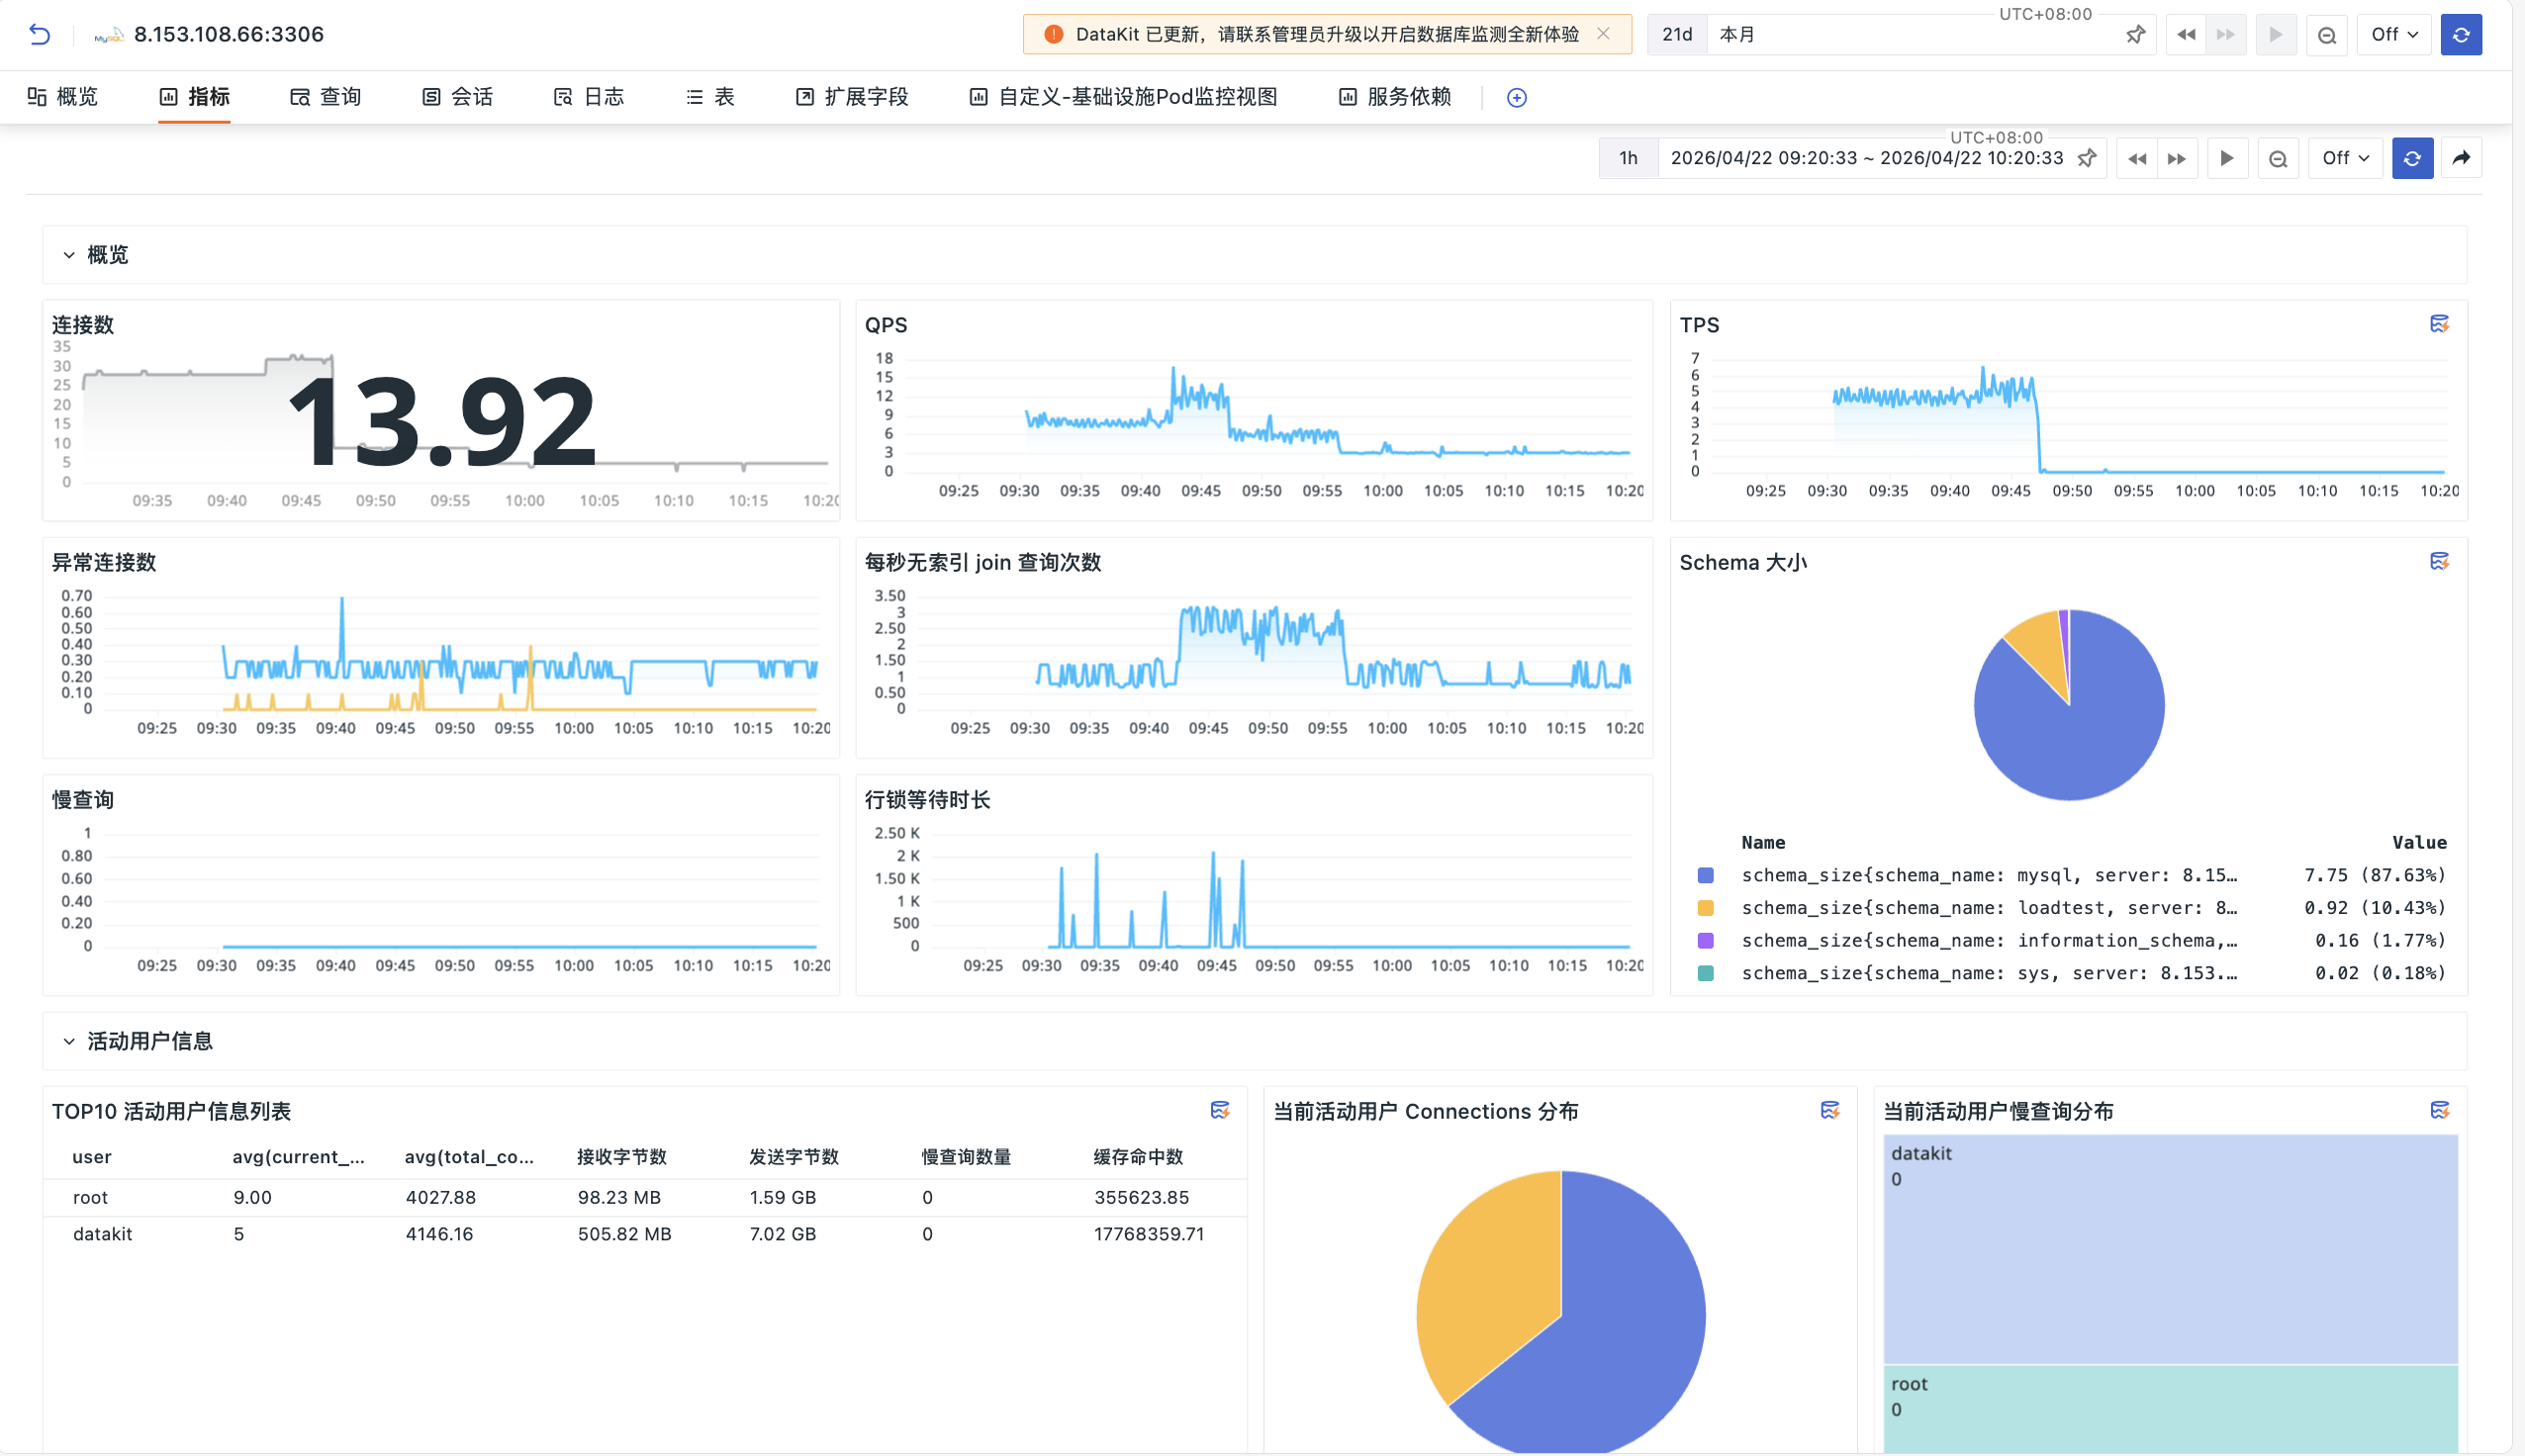
Compare database type, version, uptime, workload, QPS, connections, and contention across instances. Rankings and time-series views reveal which database deserves attention before the team opens individual queries.
View documentation
Many instances, one starting point for load, throughput, and contention
An application endpoint is slow. Find the queries and waits behind it
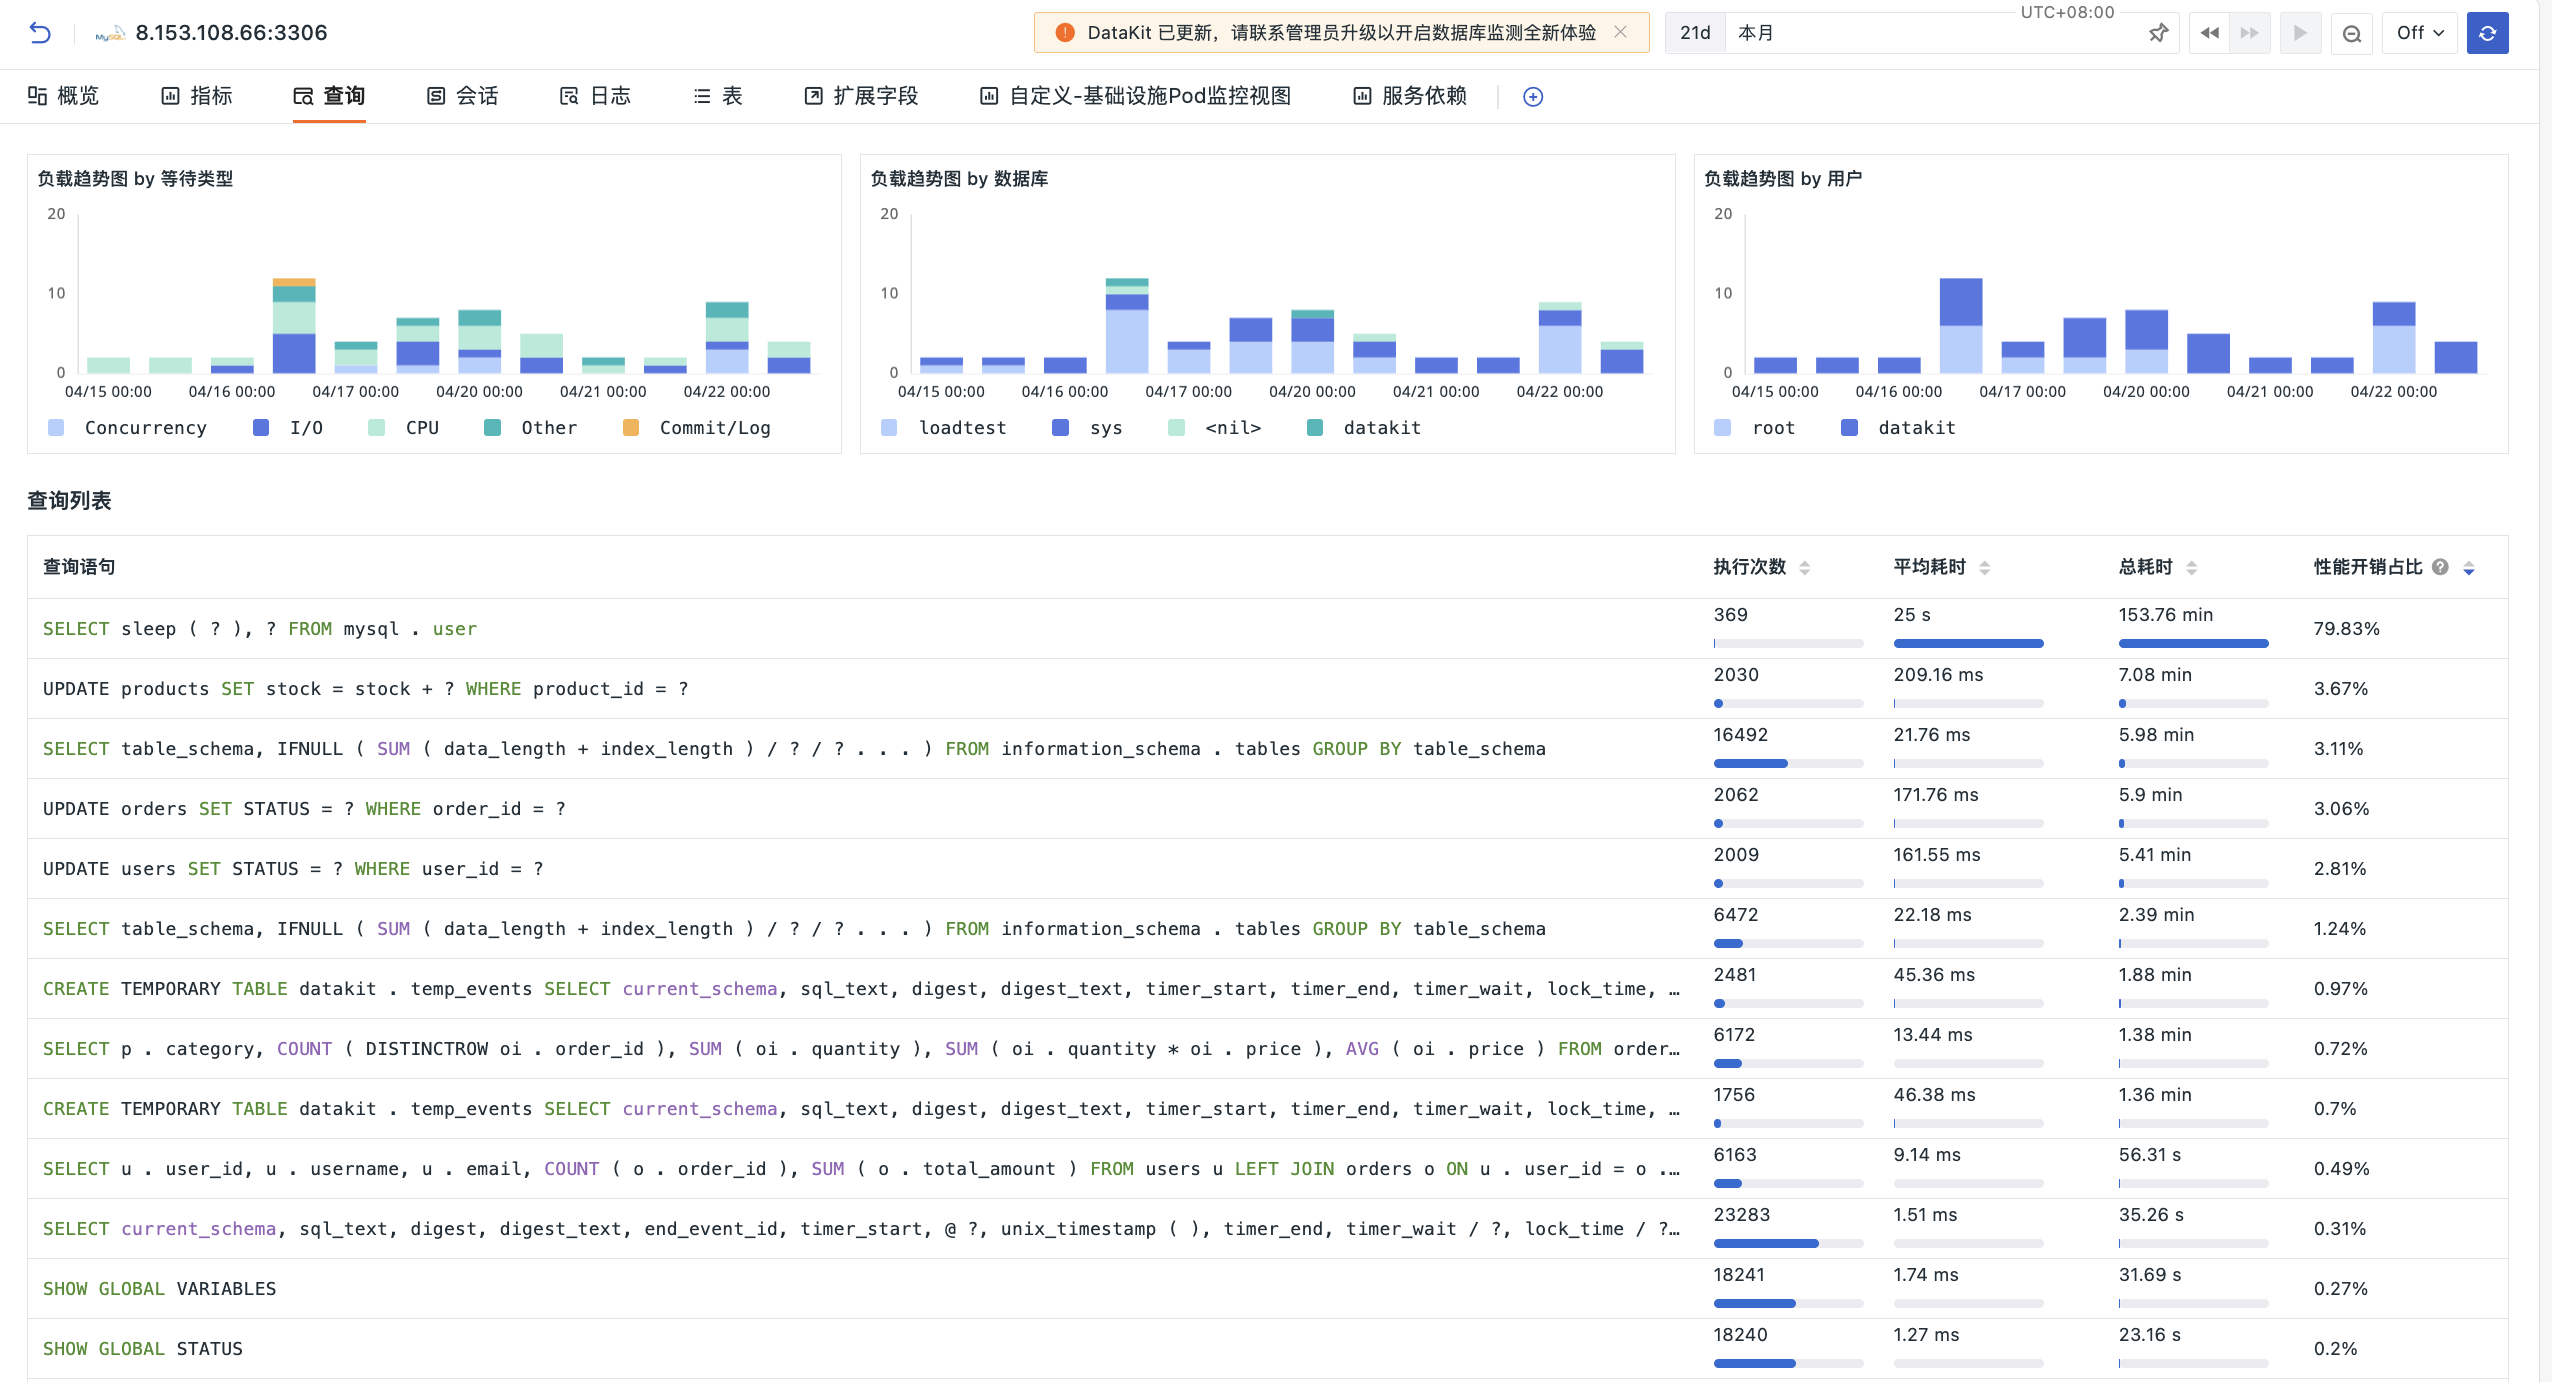
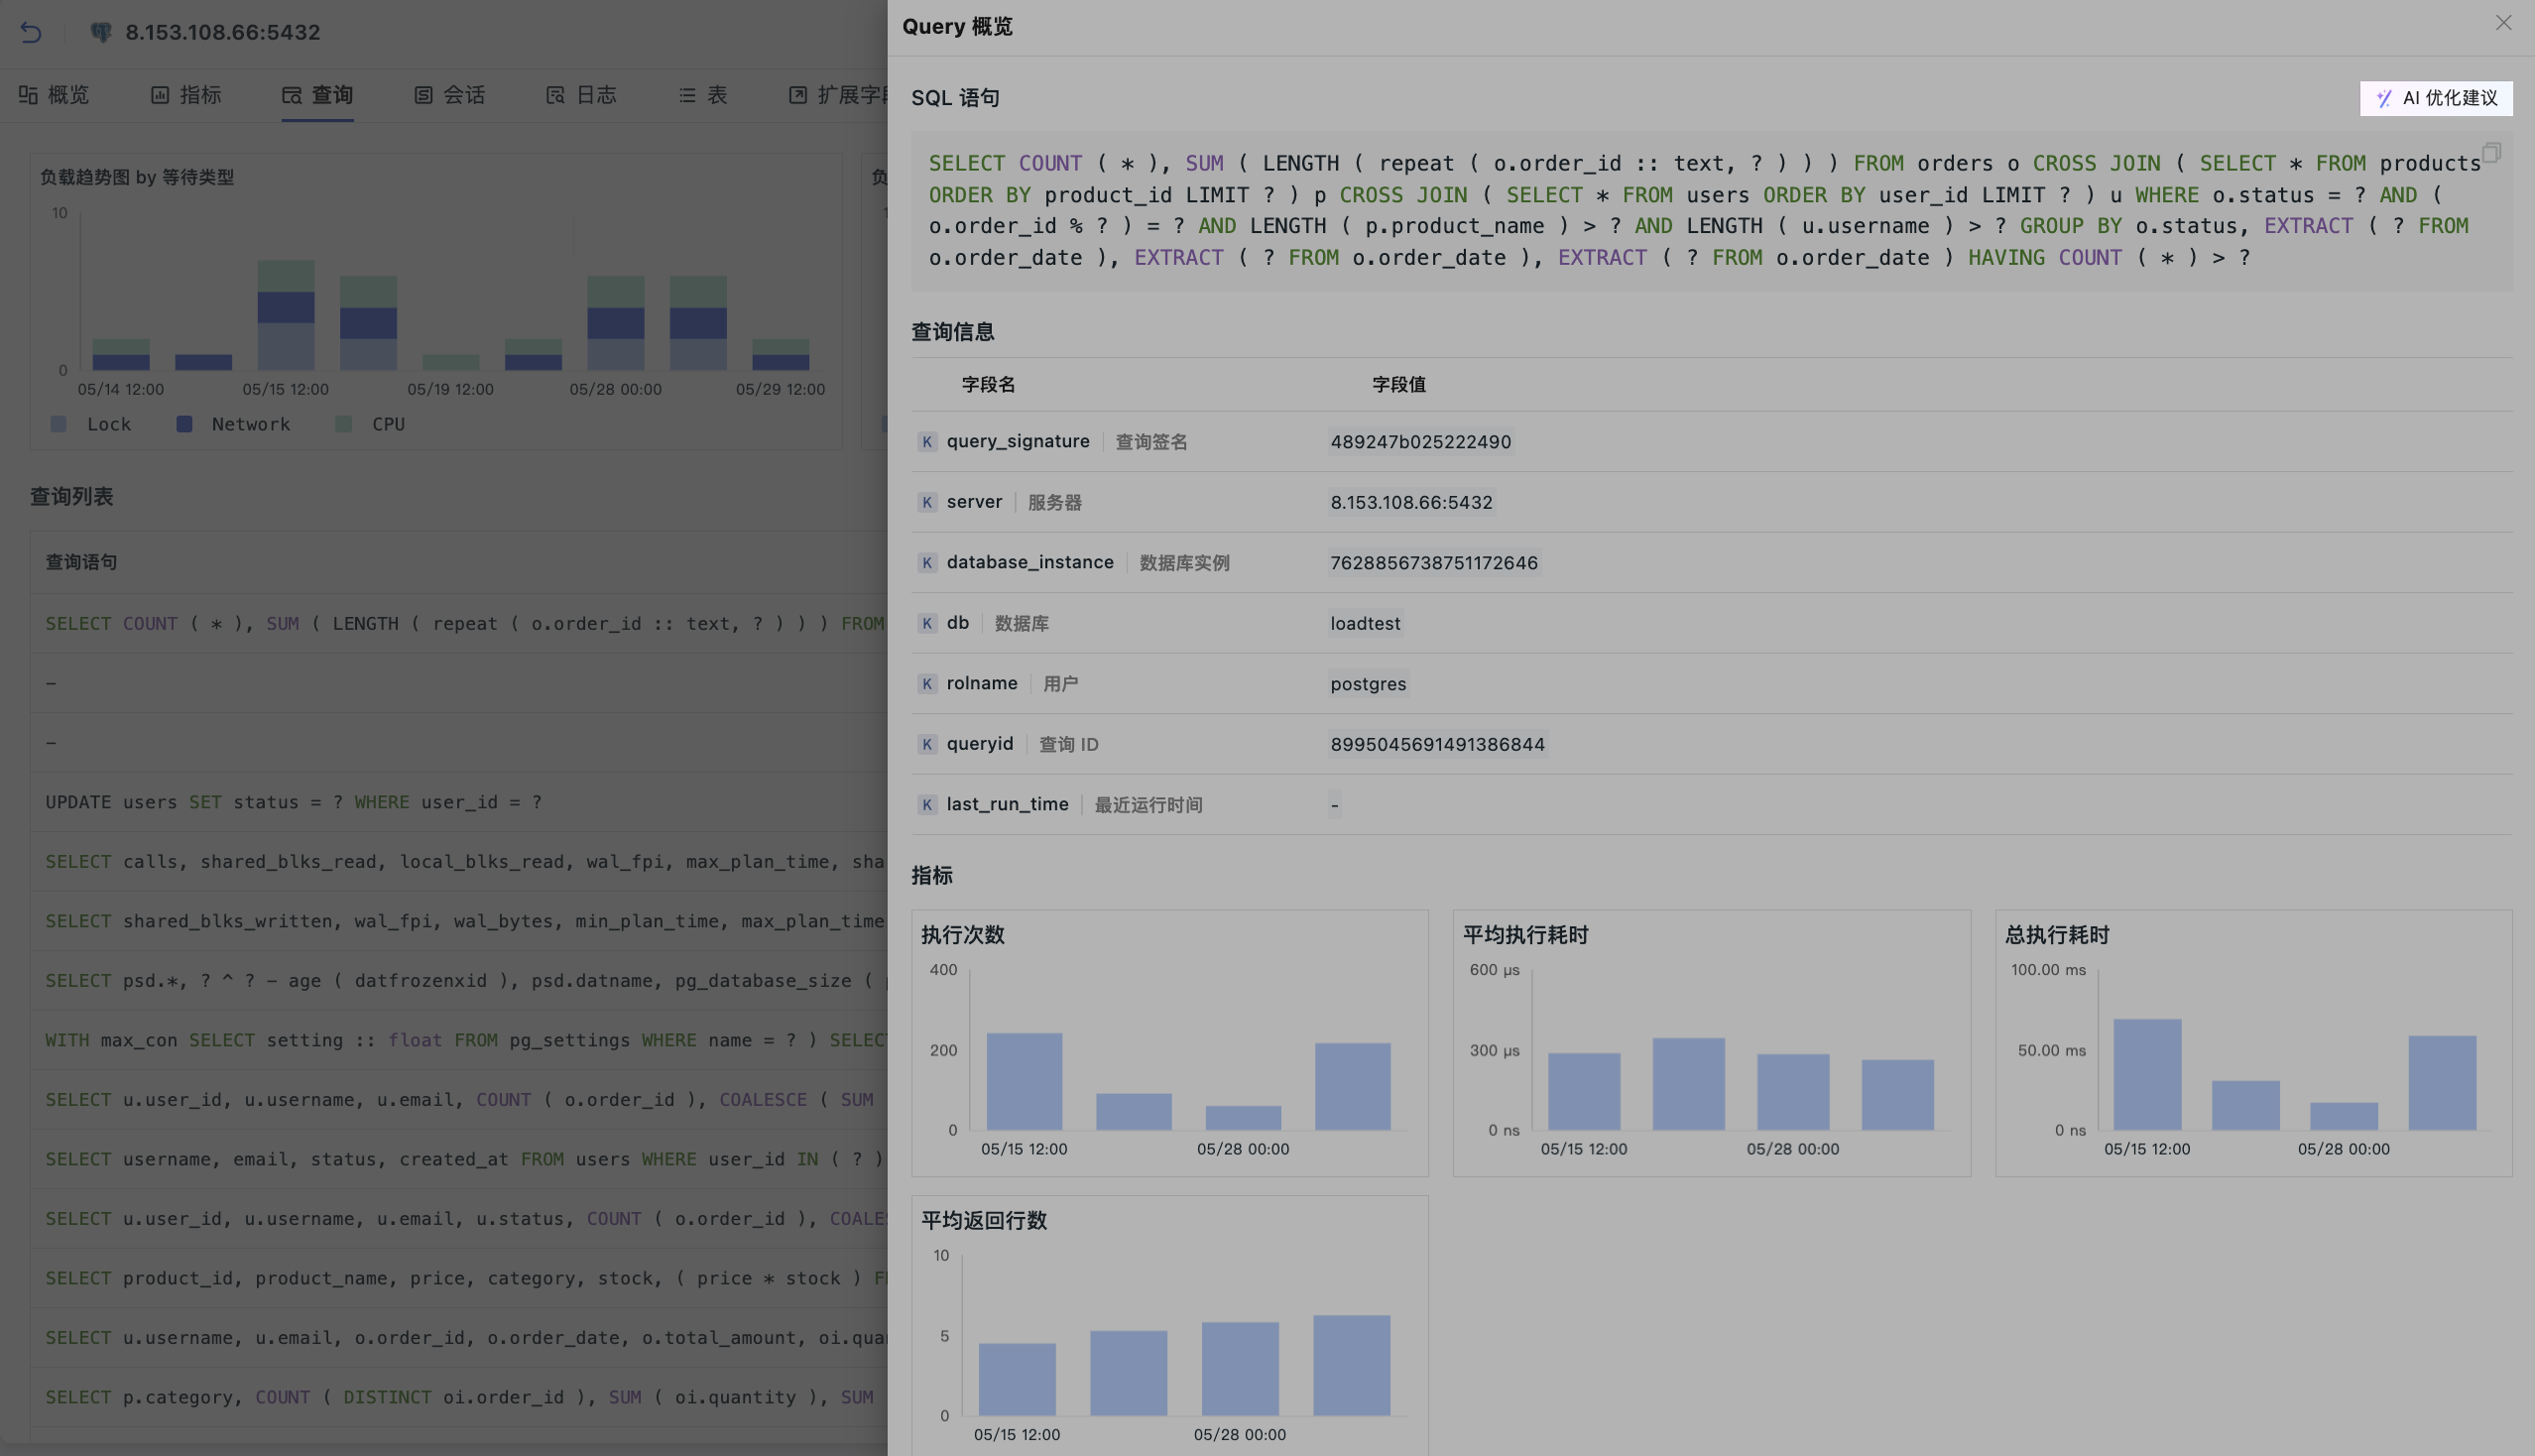
Rank Top Queries by executions, average latency, total time, and resource cost. Wait-event analysis shows whether time is spent on CPU, I/O, locks, or another dependency, while APM context identifies the affected service and request.
View documentation
Lock waits are rising. Identify the root blocker, not only the waiting session
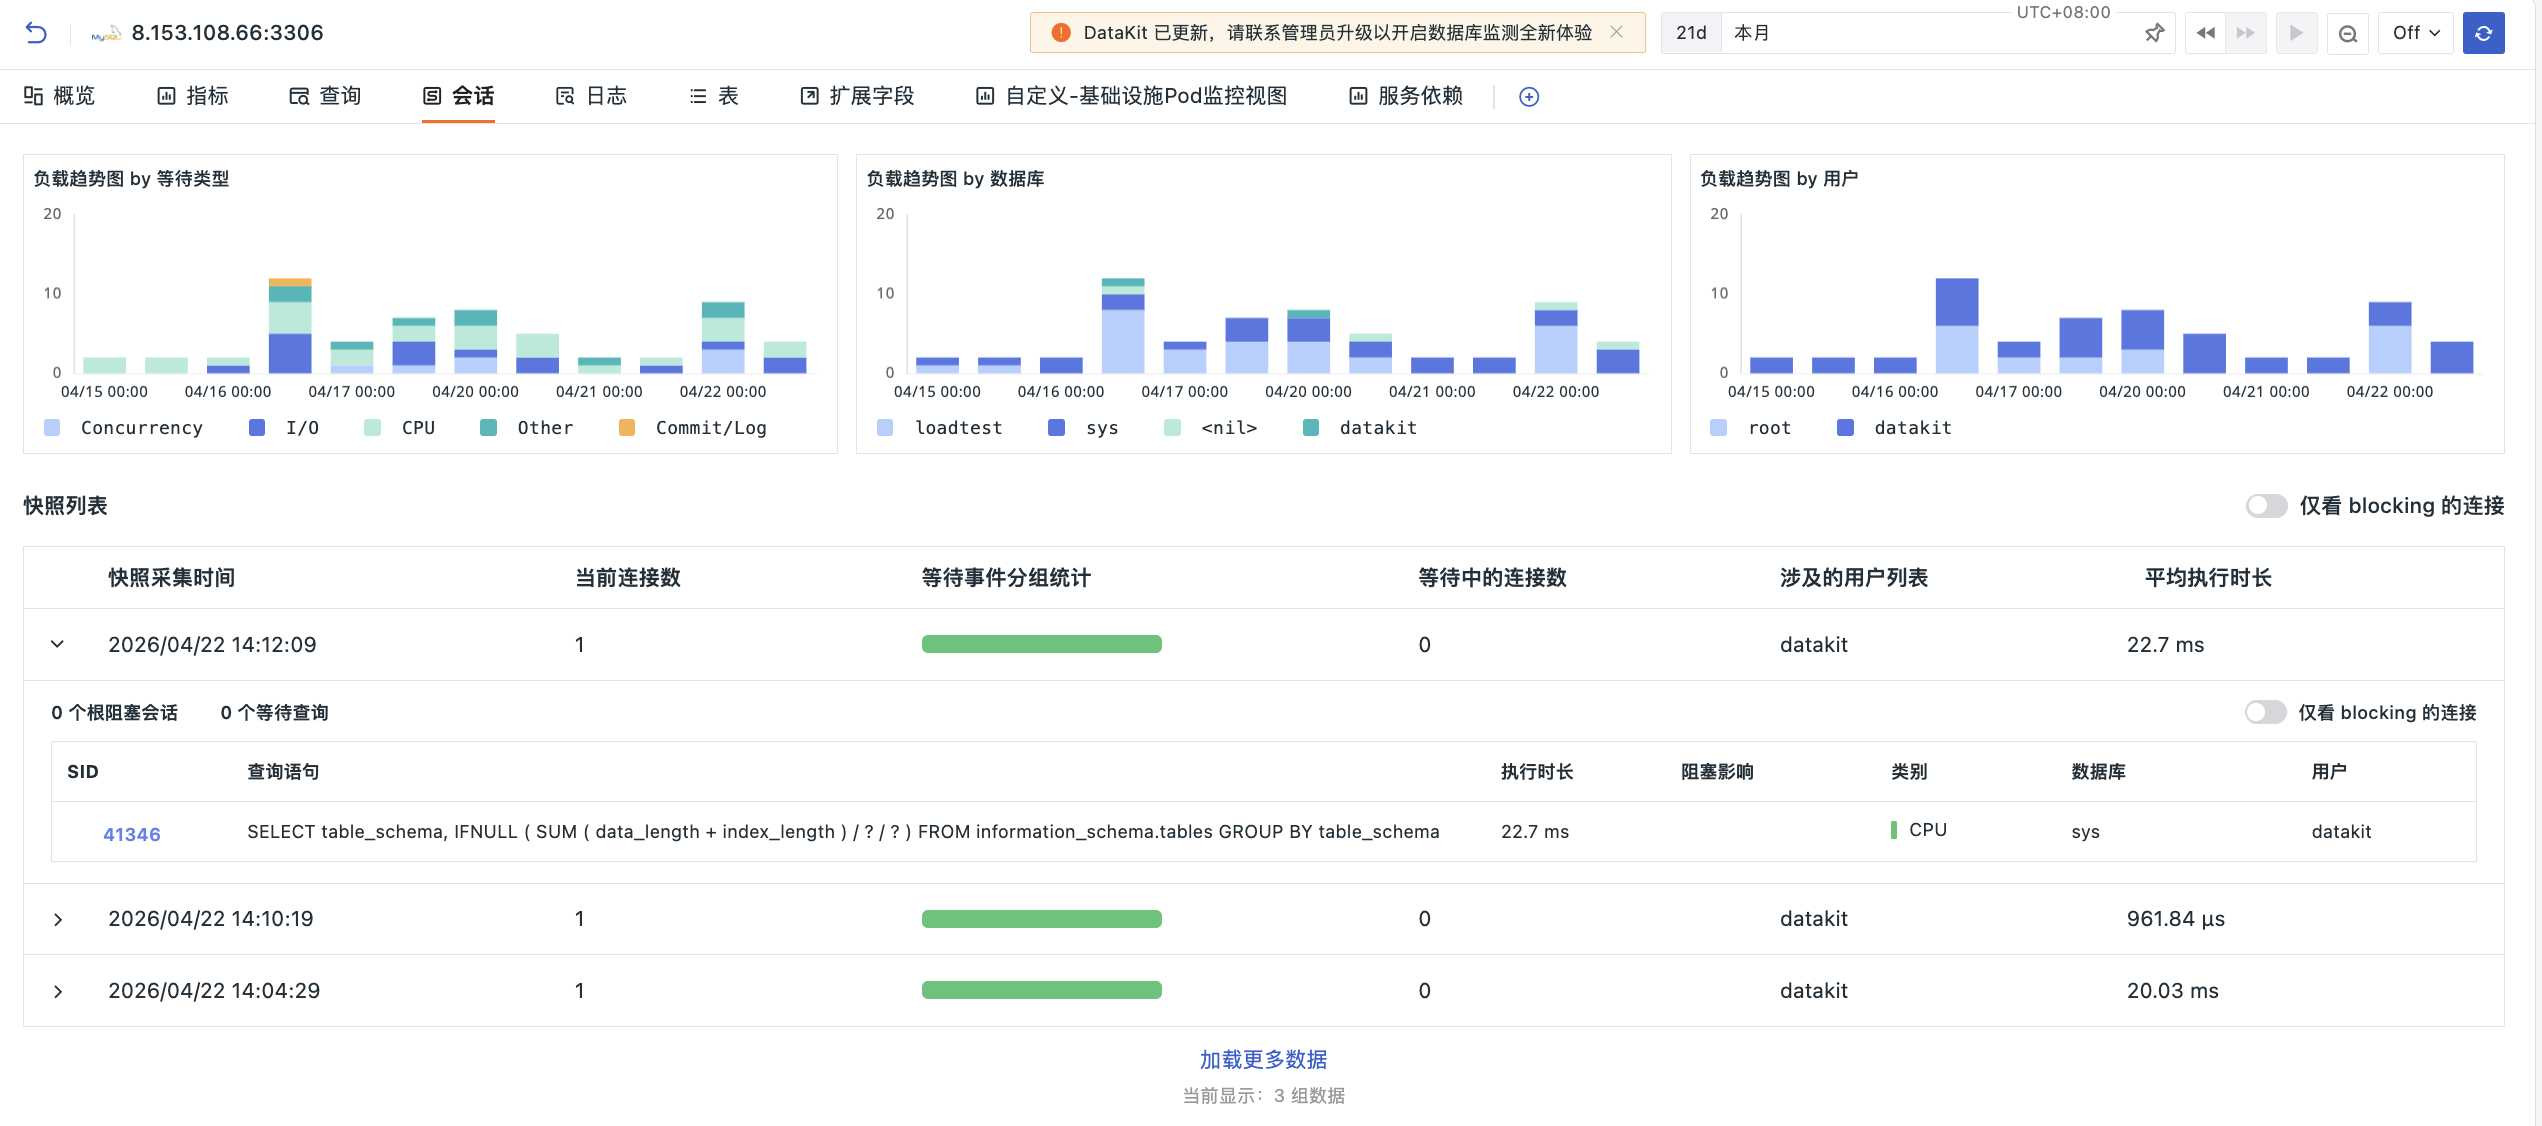
Use session snapshots to inspect active and blocked sessions, lock chains, wait duration, and query text. Follow the chain to the root blocking session so the team can act on the cause instead of terminating symptoms one by one.
View documentation
Lock waits are rising. Identify the root blocker, not only the waiting session
Query metrics are not enough. Add host, log, schema, and execution context
Correlate database behaviour with CPU, memory, disk, slow-query logs, table structure, and application traces. The combined evidence separates inefficient SQL from infrastructure pressure, connection-pool limits, and schema changes.
View documentation
Query tuning should be evidence-led, not dependent on one specialist
Open Obsy AI from the query view to analyse the SQL, execution evidence, performance trend, and surrounding metrics. Use the result as a reviewable optimisation proposal rather than a disconnected generic rewrite.
View documentation
Query tuning should be evidence-led, not dependent on one specialist

Frequently asked questions

Which databases can Guance Database Monitoring observe?

Guance provides DataKit integrations for MySQL, PostgreSQL, SQL Server, Oracle, MongoDB, and additional database scenarios documented in the integration catalogue. The exact query, session, and metric fields depend on the engine and collection method.

Can Database Monitoring identify slow queries?

Yes. Teams can rank queries by execution count, average and total latency, and performance cost, then inspect query samples, wait events, related sessions, and host or application context.

How does Guance investigate blocking and lock waits?

Session snapshots expose waiting and blocking sessions, lock relationships, wait duration, and query text. The investigation follows the chain to the root blocker so teams can distinguish a single long transaction from broader contention.

Can database evidence be correlated with APM, infrastructure, and logs?

Yes. Shared service, host, environment, trace, and time context lets teams move between database queries, application requests, resource metrics, and slow-query logs without rebuilding the investigation.

What does Obsy AI do in Database Monitoring?

Obsy AI can analyse the selected query together with its performance evidence and surrounding telemetry, then provide optimisation considerations for engineer review. It does not replace database change control or production validation.


Database monitoring guides and practices

Continue exploring database performance

Connect database monitoring to APM, infrastructure, logs, documentation, and pricing.

Get started > View documentation > View pricing >