Infrastructure Monitoring

Monitor every host, container, process, network, and cloud resource in context

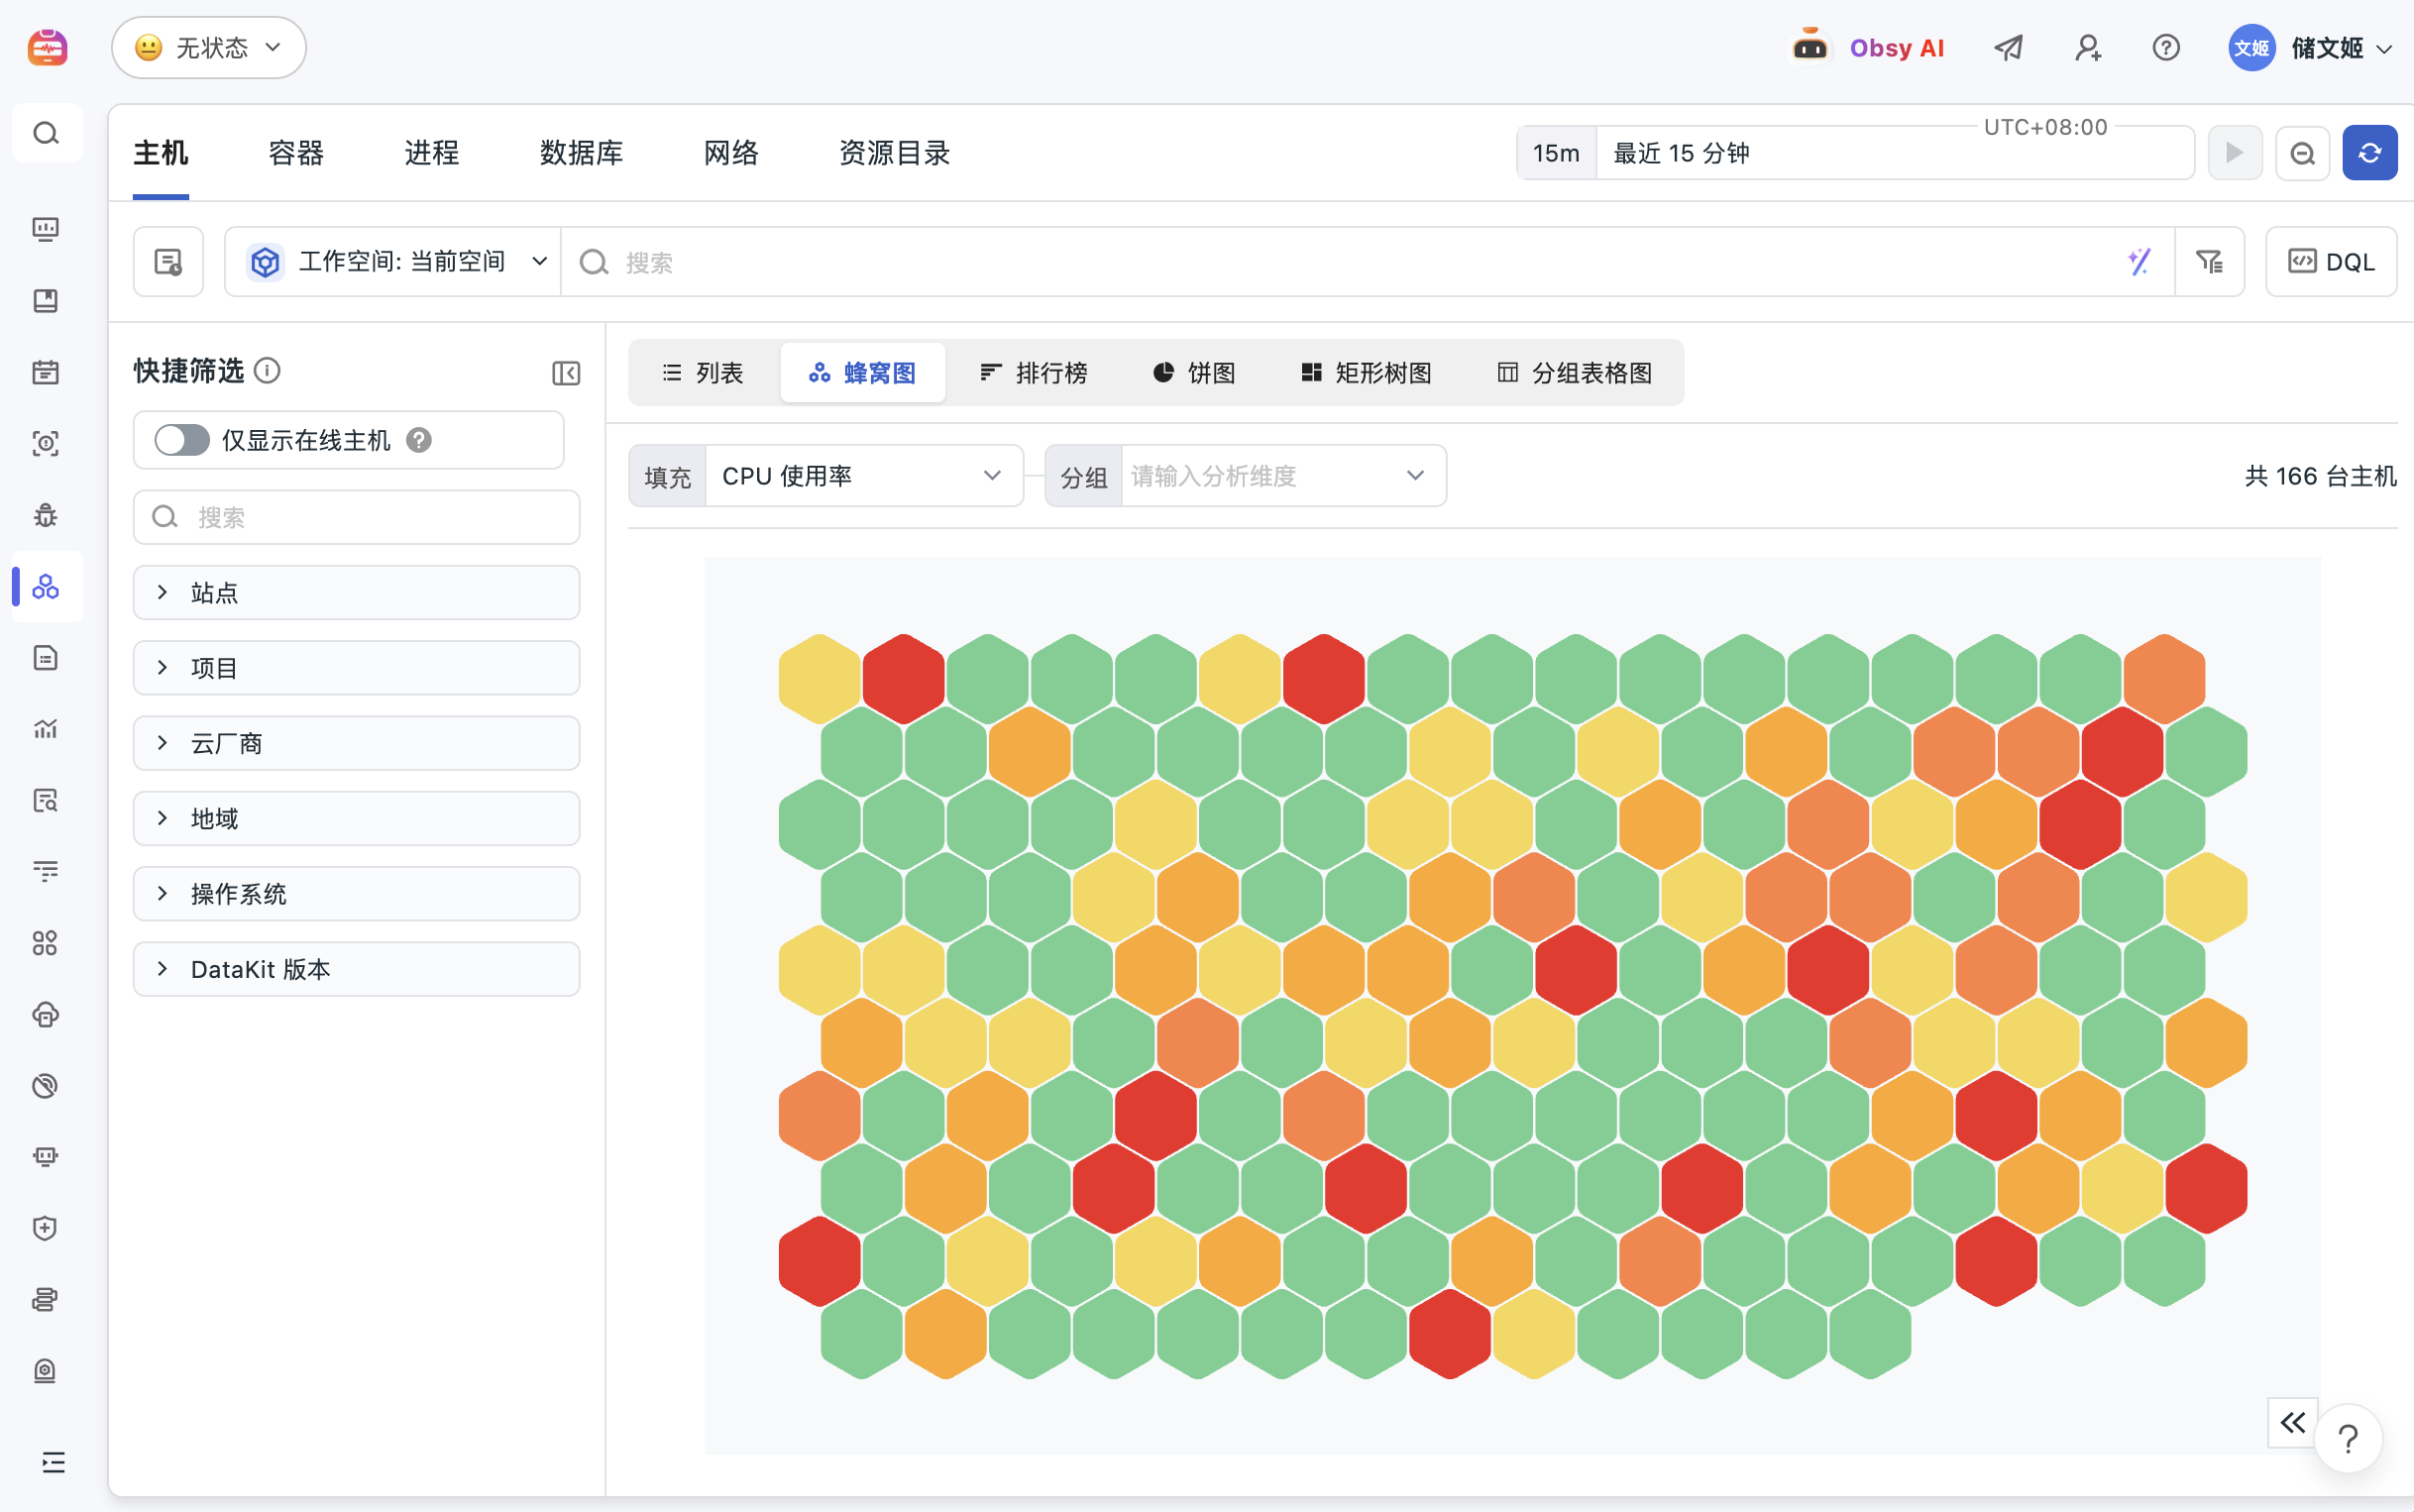
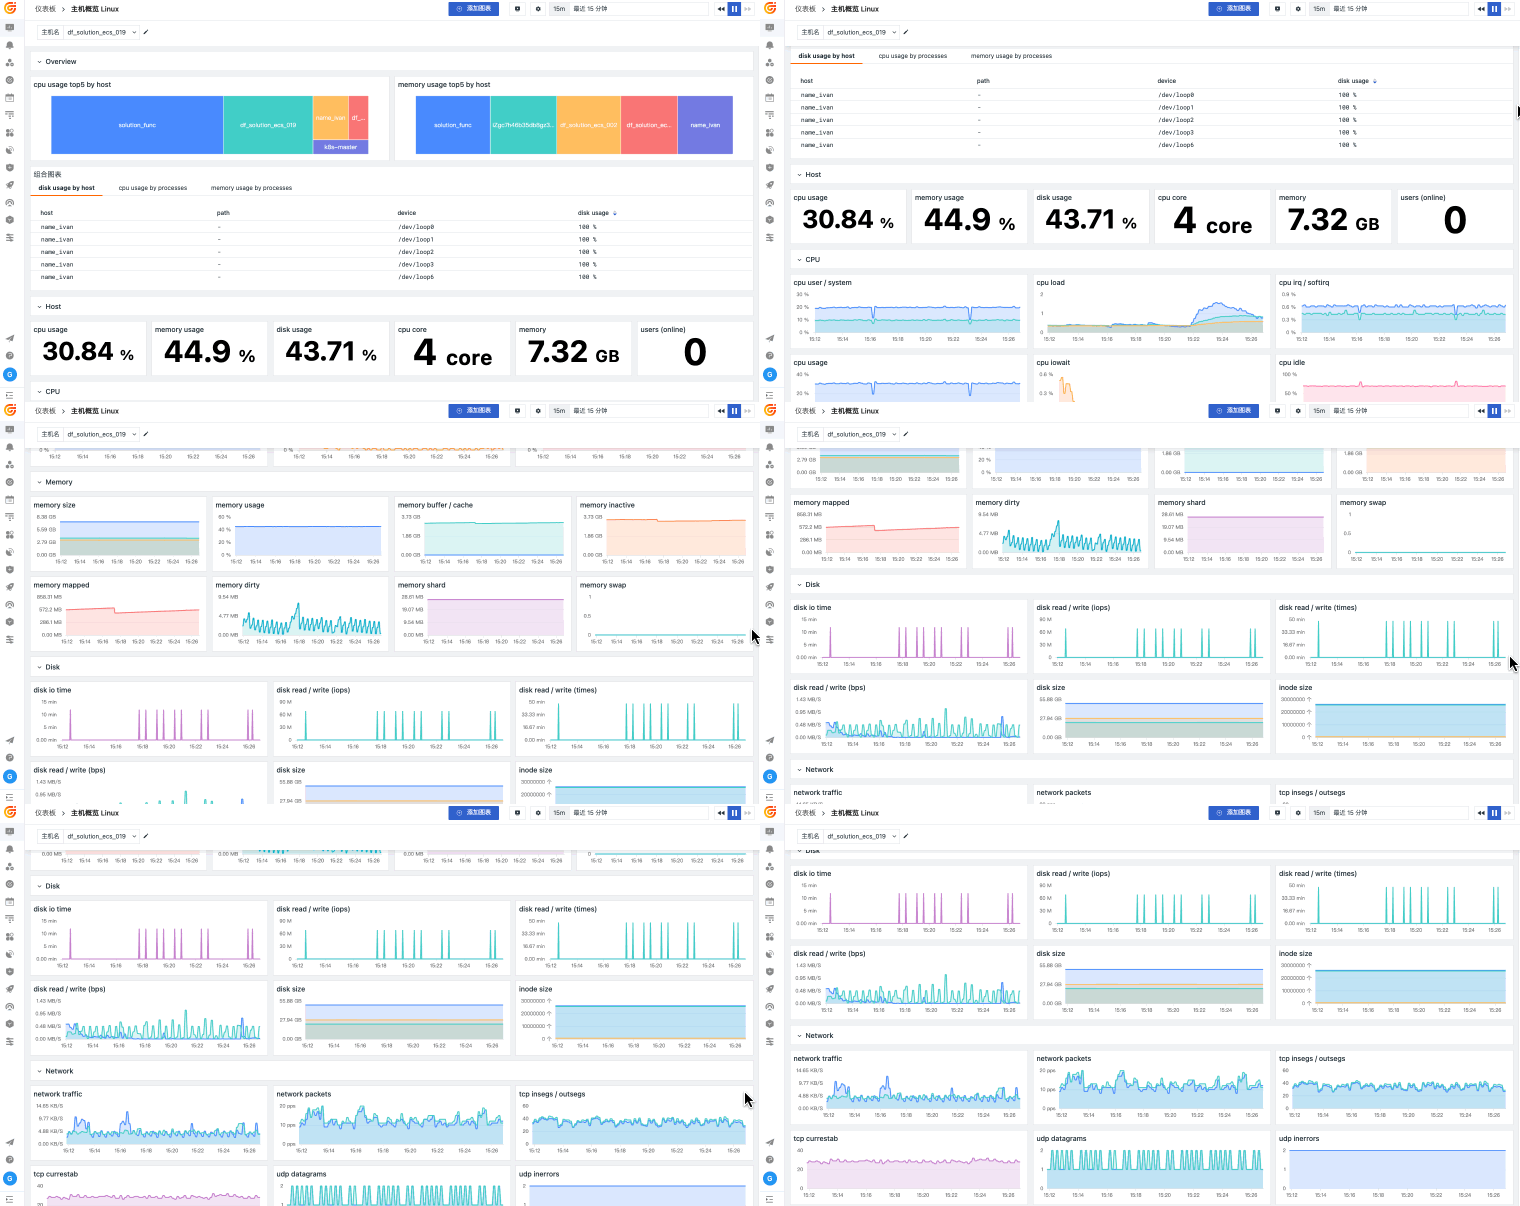
Guance Infrastructure Monitoring unifies resource inventory, performance metrics, topology, logs, traces, events, and alerts so operations, SRE, and platform teams can understand capacity, isolate impact, and resolve infrastructure issues without rebuilding context across tools.

Monitor every host, container, process, network, and cloud resource in context

What Infrastructure Monitoring helps you solve

Turn distributed resources into a connected, actionable infrastructure view

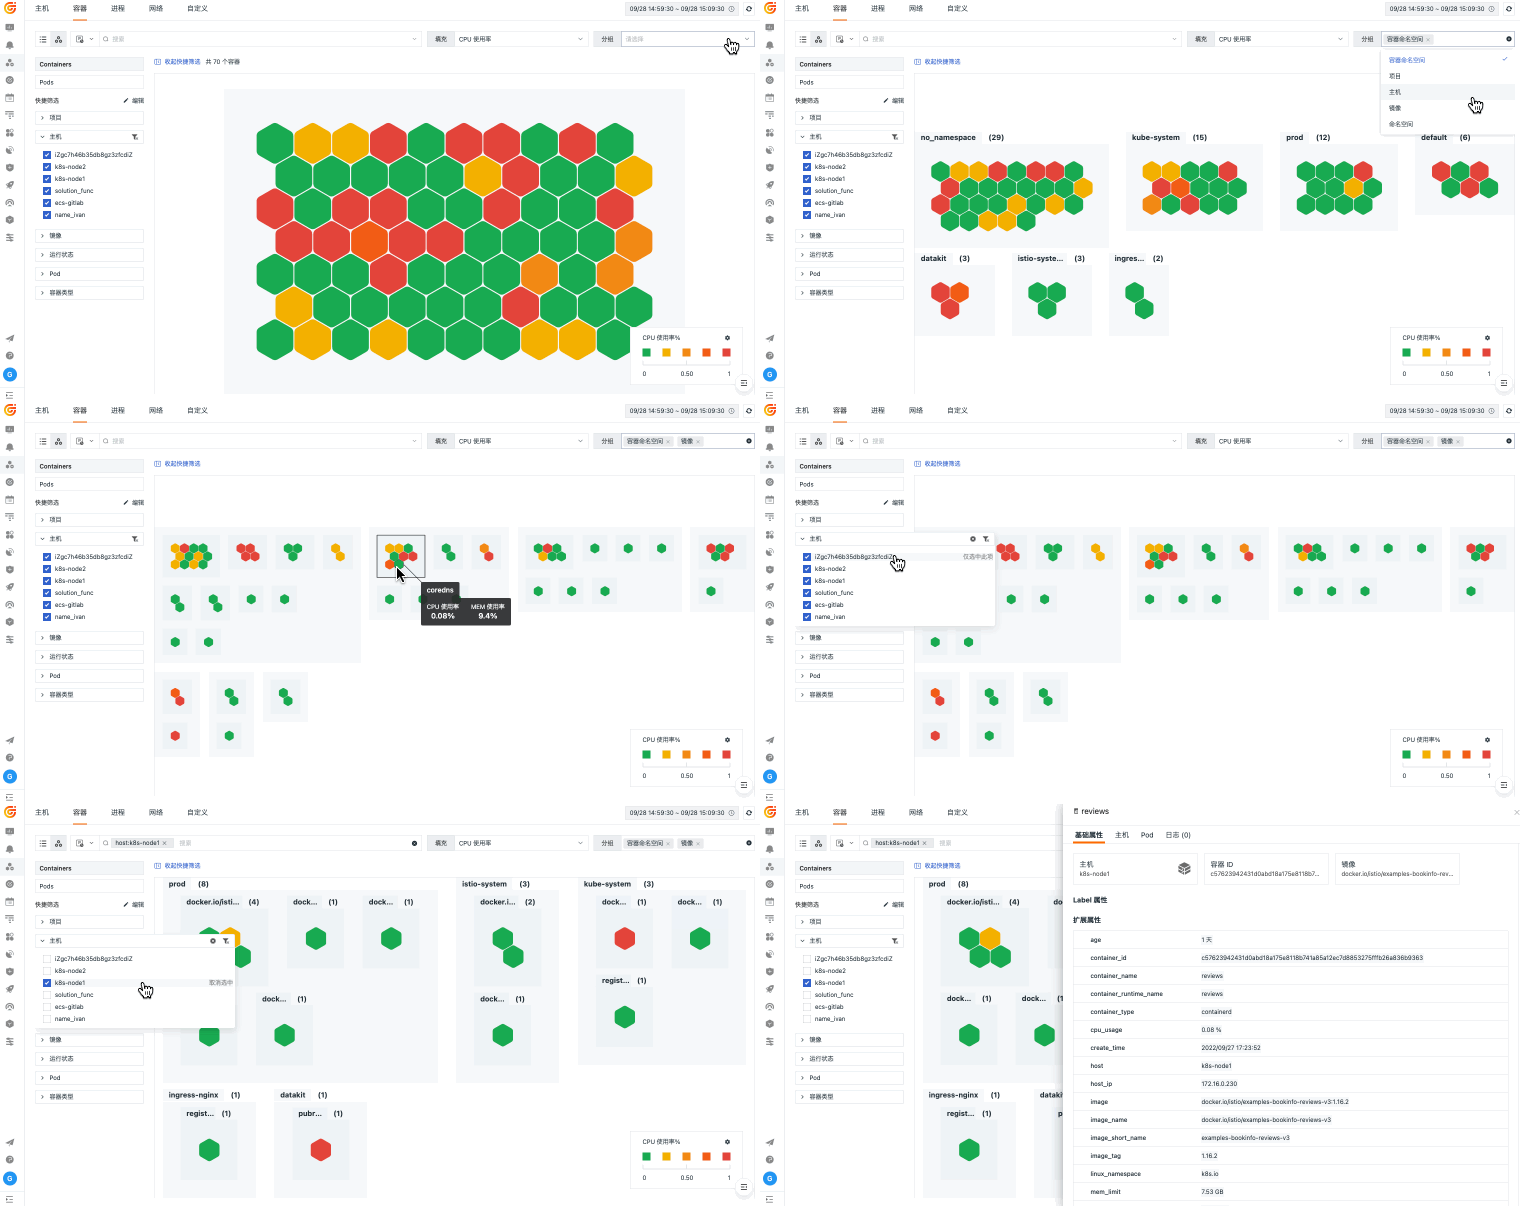
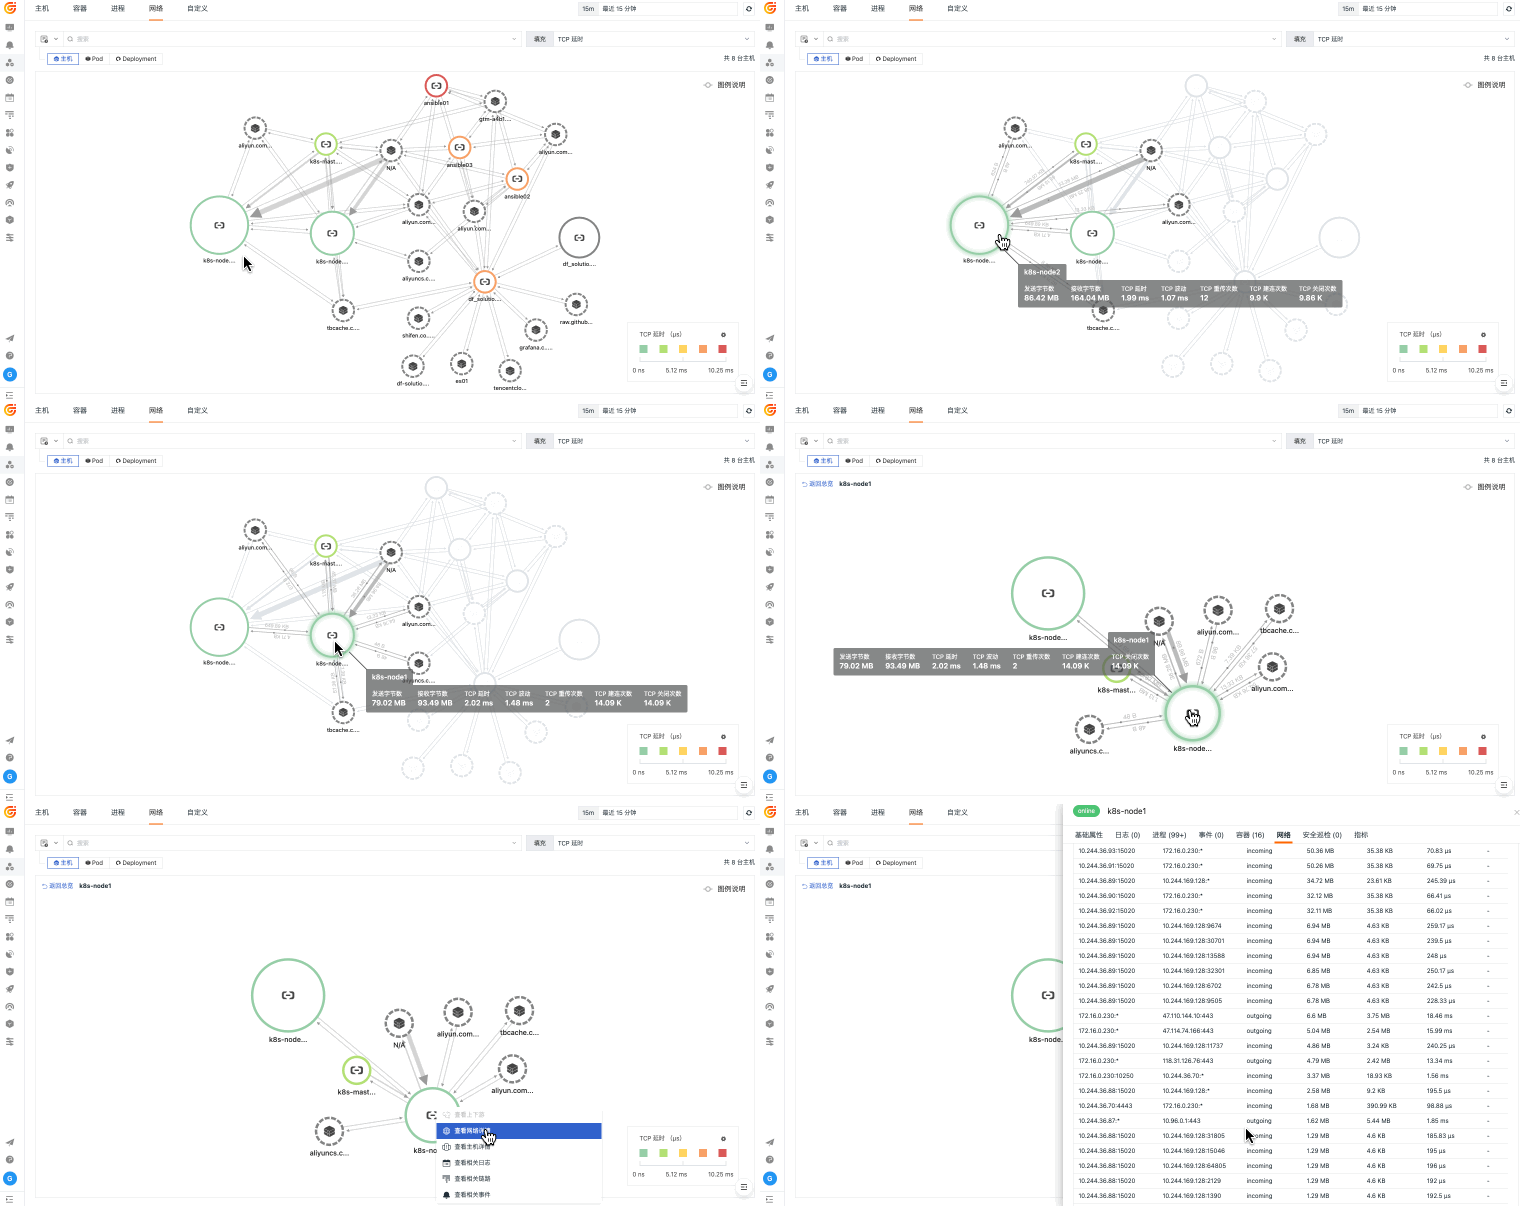
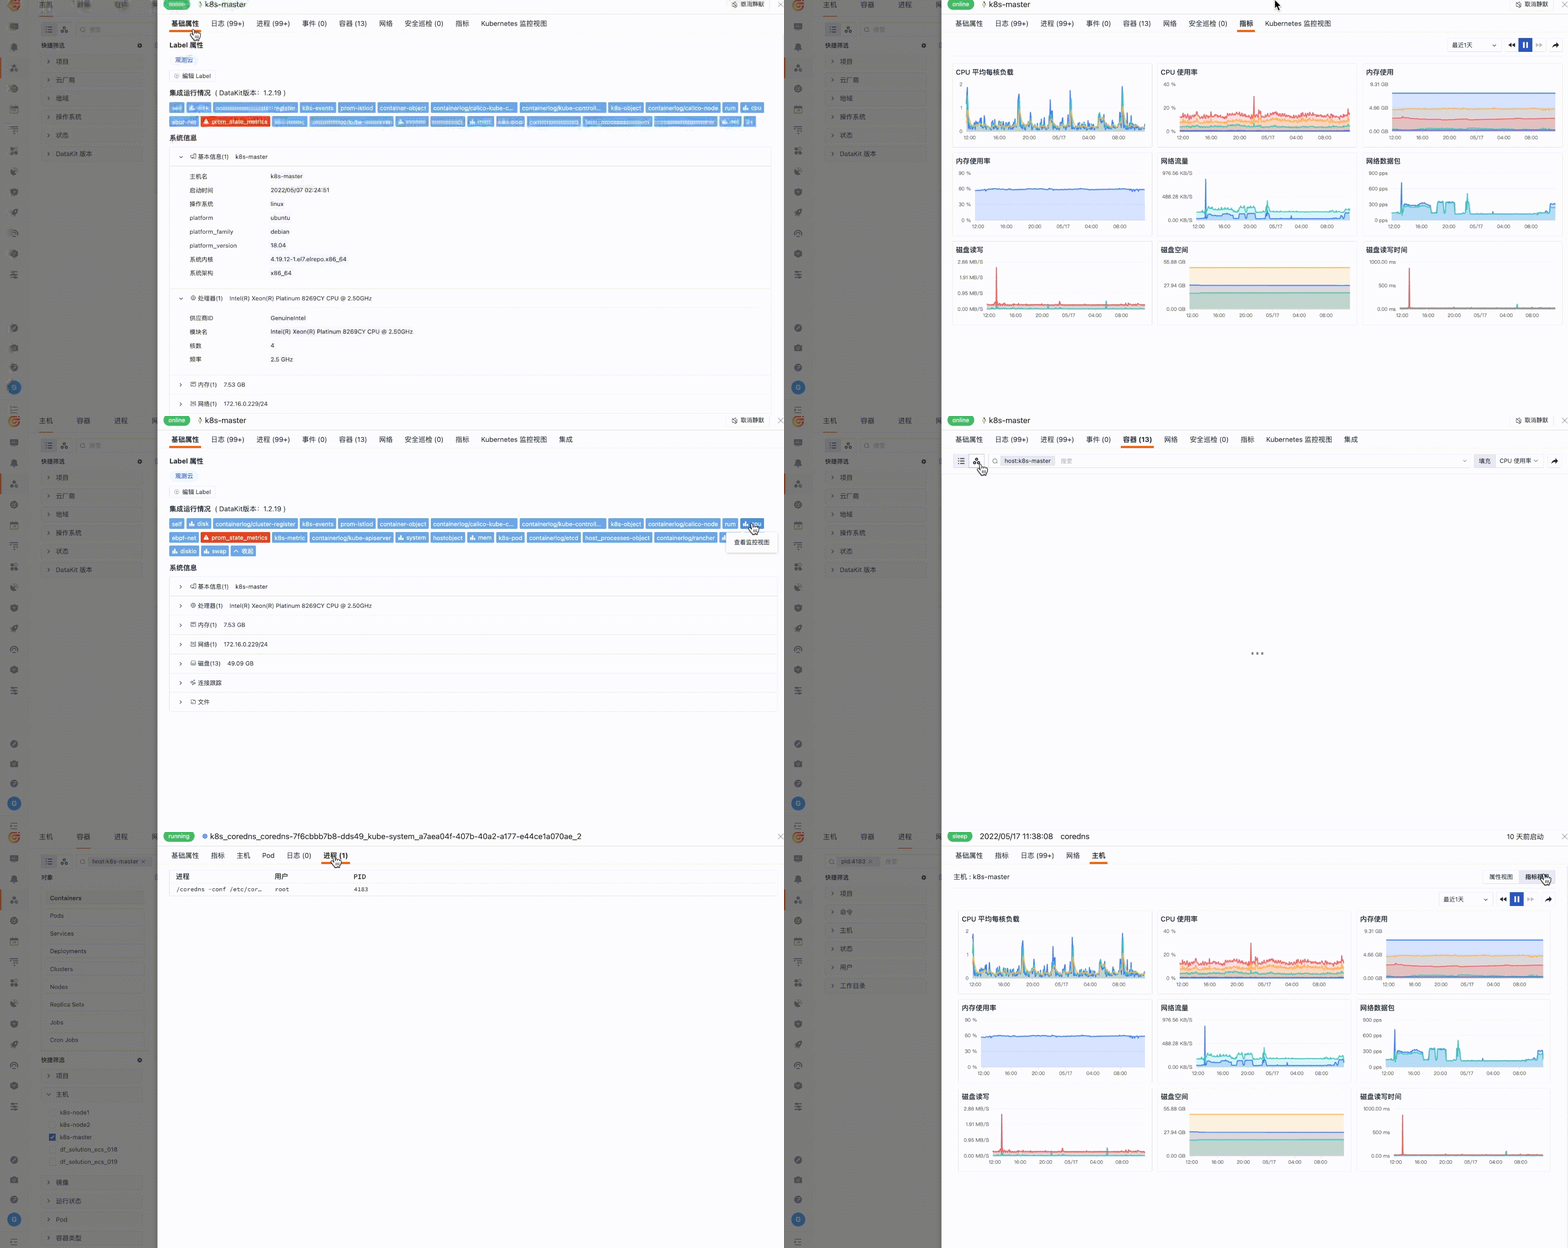
Guance uses DataKit, cloud integrations, and consistent tags to keep resource identity, performance, and dependencies connected. Teams can move from a fleet-wide anomaly to the affected host, container, process, or network path and verify the surrounding application impact.

A real investigation path

From a resource anomaly to the affected service and infrastructure boundary

Start with the abnormal resource group, determine whether pressure is sustained, and use topology plus application context to identify the actual scope of impact.

Identify where the anomaly is concentrated

EvidenceResource type, environment, region, service, ownership, and current health

ConclusionReduce the incident from the entire estate to a specific workload or fleet

Data path

DataKit and cloud integrations → Resource inventory and metrics → Topology → Logs, traces, events, and alerts

Best for

For operations, SRE, platform, and cloud teams responsible for hosts, containers, Kubernetes, networks, and hybrid infrastructure.

Requirements

Collection and tags must preserve resource identity. Use APM for request-level code paths and RUM for real user impact.

View setup guide
Do not stop at resource metrics. Add logs, traces, events, and alerts
Keep infrastructure identity and time context attached as you move between metrics, logs, application traces, events, and alerts. This helps teams distinguish resource pressure from application regressions, deployment changes, and downstream failures.
View documentation
Do not stop at resource metrics. Add logs, traces, events, and alerts

Frequently asked questions

What is infrastructure monitoring?

Infrastructure monitoring continuously measures the health, performance, capacity, and availability of hosts, containers, processes, networks, Kubernetes, and cloud resources. Guance also connects these signals to application and log context for investigation.

Which infrastructure metrics should teams monitor?

Common signals include CPU, memory, disk and filesystem usage, network throughput and errors, system load, process health, container resource consumption, and cloud service metrics. The useful set depends on the workload and its service objectives.

How does infrastructure monitoring speed up troubleshooting?

It shows where an anomaly occurs, which resources and services depend on it, and what changed at the same time. Teams can then pivot to related logs, traces, events, and alerts instead of manually aligning several tools.

Who uses Guance Infrastructure Monitoring?

Operations, SRE, platform, cloud, and development teams use it to manage hybrid and multi-cloud estates, Kubernetes and container platforms, and business-critical hosts and services.


Continue exploring infrastructure observability

Connect infrastructure monitoring to containers, cloud resources, hybrid environments, documentation, and pricing.

Get started > View documentation > View pricing >