Phone:400-882-3320


Token and request volume visualization monitoring
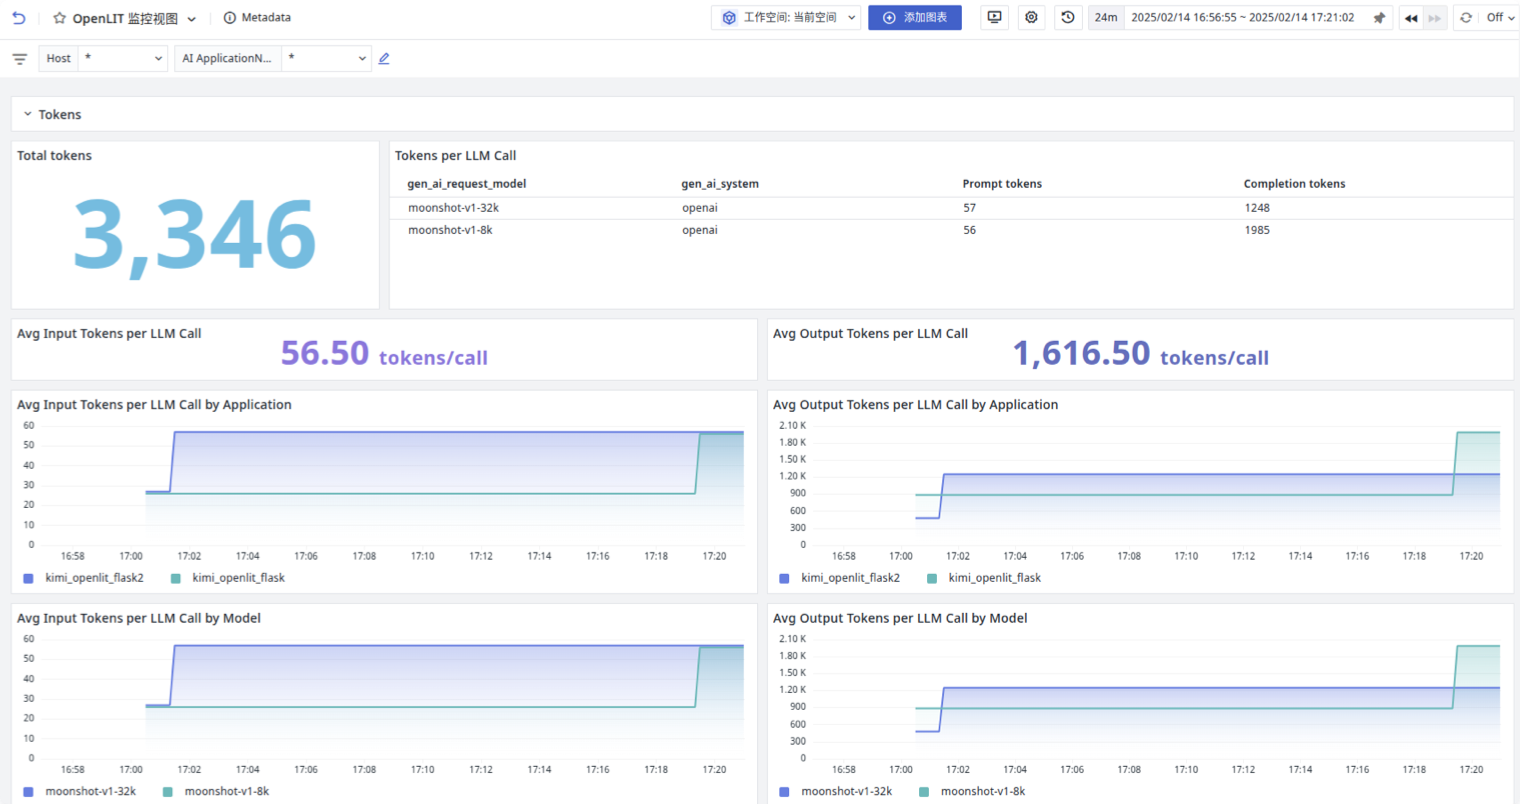
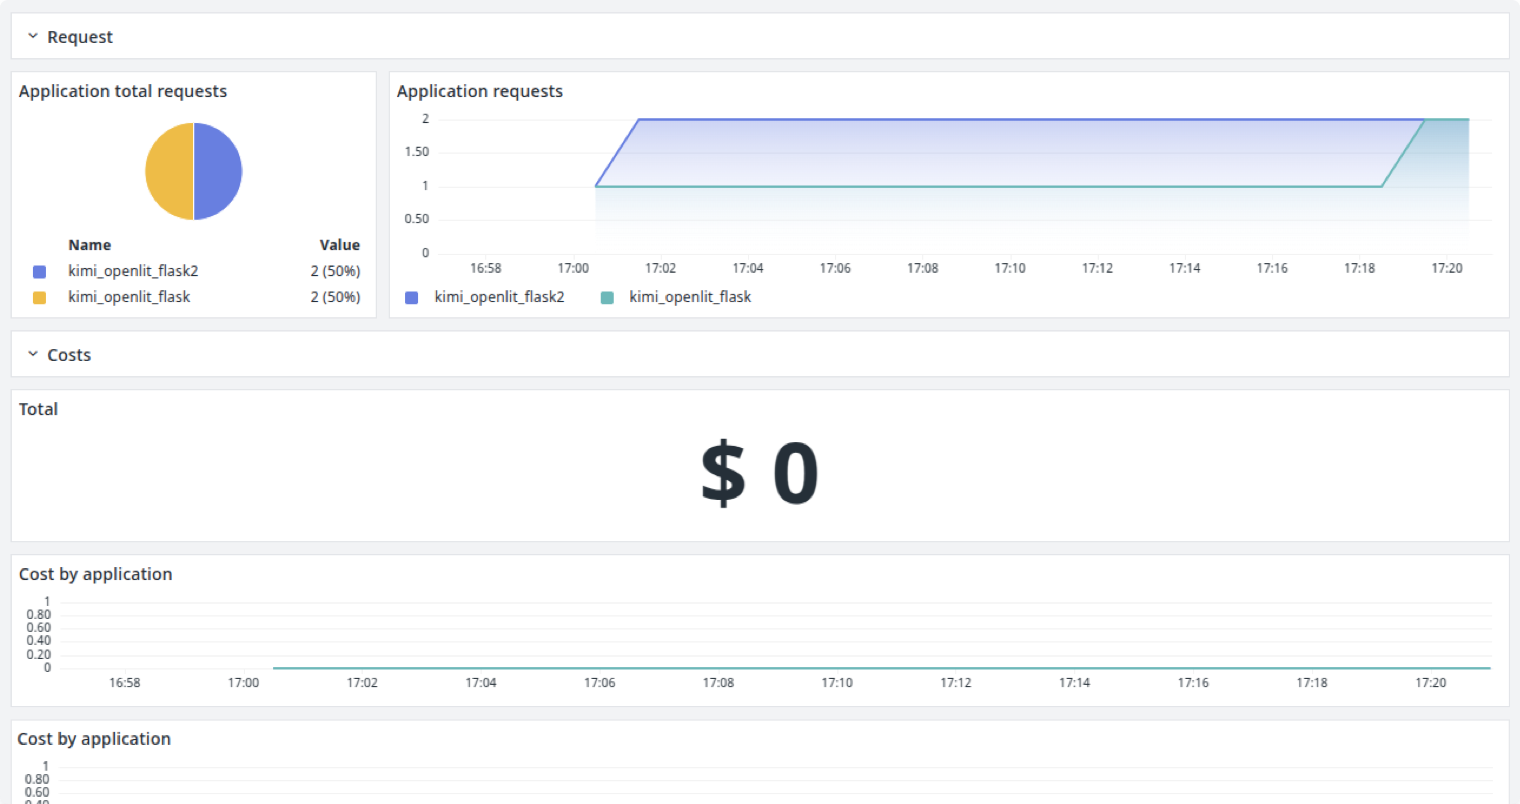
You will see a real-time updated dashboard clearly showing the total consumed Total Tokens and the ratio of Prompt Tokens to Completion Tokens, and break down average Input/Output Tokens by model and application dimension. With this panoramic monitoring, the team can immediately assess the cost and complexity of each call during development, avoiding sudden bill spikes caused by high consumption after launch; The system also supports setting thresholds for abnormal token fluctuations, triggering an alert immediately if a request exceeds the expected range, helping you stay on top of cost trends at any time.
Book a demo