GO 进行编译时插桩,实现零码注入
本文介绍如何通过编译时插桩技术,帮助 Go 开发者在不修改业务代码的情况下,快速实现对应用程序的全面监控和优化,提升开发效率和运维能力。

Go 编译时插桩
Go 语言的编译时插桩是一种在编译阶段自动注入监控代码的技术,目的是在不修改业务代码的情况下,实现对应用程序的监控和追踪。
基本原理
Go 编译时插桩的核心思想是通过在编译过程中对源代码进行分析和修改,将监控代码注入到目标函数中。具体步骤如下:
- 在编译流程中,通过抽象语法树(AST)分析源代码。
- 根据预定义的规则(如配置文件或插桩框架),找到需要监控的函数或方法。
- 在这些函数的入口和出口插入自定义的监控代码。
- 完成修改后的代码继续经过正常的编译流程,生成最终的可执行文件。
优势
- 零侵入性:无需修改业务代码,减少了对现有代码的干扰。
- 性能优化:由于插桩代码经过完整的编译流程,不会产生不可预料的错误,并且可以利用编译器的优化。
- 全面监控:可以实现与 Java 监控类似的全面监控能力,包括链路追踪、指标统计、日志关联等。
实践
当前主要是基于 Datadog 提供的工具 Orchestrion,用于在编译时对 Go 代码进行自动插桩。它通过与 Go 工具链交互,在源代码发送到编译器之前对其进行检查和修改。
要求:
- Go 版本 ≥ 1.18+
- Go Module 管理项目
创建 DEMO
1、创建目录
mkdir go-runtime-demo
cd go-runtime-demo
2、编写 main.go
package main

import "net/http"

func main() {
    http.HandleFunc("/", helloFunc)
    http.ListenAndServe("localhost:18080", nil)
}

func helloFunc(w http.ResponseWriter, r *http.Request) {
    w.Write([]byte("ok"))
}
3、初始化目录
go mod init http_service
go mod tidy
安装 Orchestrion
1、下载依赖
go install github.com/DataDog/orchestrion@latest
2、创建连接点
即在上面的 go-runtime-demo 目录下执行以下命令:
orchestrion pin
执行成功后在当前目录下生成orchestrion.tool.go 文件。
3、更新依赖
go mod tidy
编译运行
1、设置环境变量,由于 Datadog 默认端口为 8125,需要调整端口推送到观测云
export DD_SERVICE=go-runtime-demo
export DD_TRACE_AGENT_PORT=9529
2、使用 Orchestrion 编译&运行项目
在项目的根目录下,使用以下命令进行编译:
orchestrion go build .
orchestrion go run .
3、查看日志
输出以下日志则表示加载成功。
root@liurui:/home/liurui/code/go/go-runtime-demo# export DD_SERVICE=go-runtime-demo
root@liurui:/home/liurui/code/go/go-runtime-demo# export DD_TRACE_AGENT_PORT=9529
root@liurui:/home/liurui/code/go/go-runtime-demo# orchestrion go build .
root@liurui:/home/liurui/code/go/go-runtime-demo# orchestrion go run .
2025/02/17 14:02:42 Datadog Tracer v1.71.0 INFO: DATADOG TRACER CONFIGURATION {"date":"2025-02-17T14:02:42+08:00","os_name":"Linux Mint","os_version":"21.1 (Vera)","version":"v1.71.0","lang":"Go","lang_version":"go1.23.6","env":"","service":"http_service","agent_url":"http://localhost:9529/v0.4/traces","agent_error":"","debug":false,"analytics_enabled":false,"sample_rate":"NaN","sample_rate_limit":"disabled","trace_sampling_rules":null,"span_sampling_rules":null,"sampling_rules_error":"","service_mappings":null,"tags":{"runtime-id":"404bbb85-f951-4cdf-a5f5-436a275614f2"},"runtime_metrics_enabled":false,"runtime_metrics_v2_enabled":false,"profiler_code_hotspots_enabled":true,"profiler_endpoints_enabled":true,"dd_version":"","architecture":"amd64","global_service":"","lambda_mode":"false","appsec":false,"agent_features":....
观测云
登录观测云控制台,点击「应用性能监控」 -「链路」,查看链路信息。
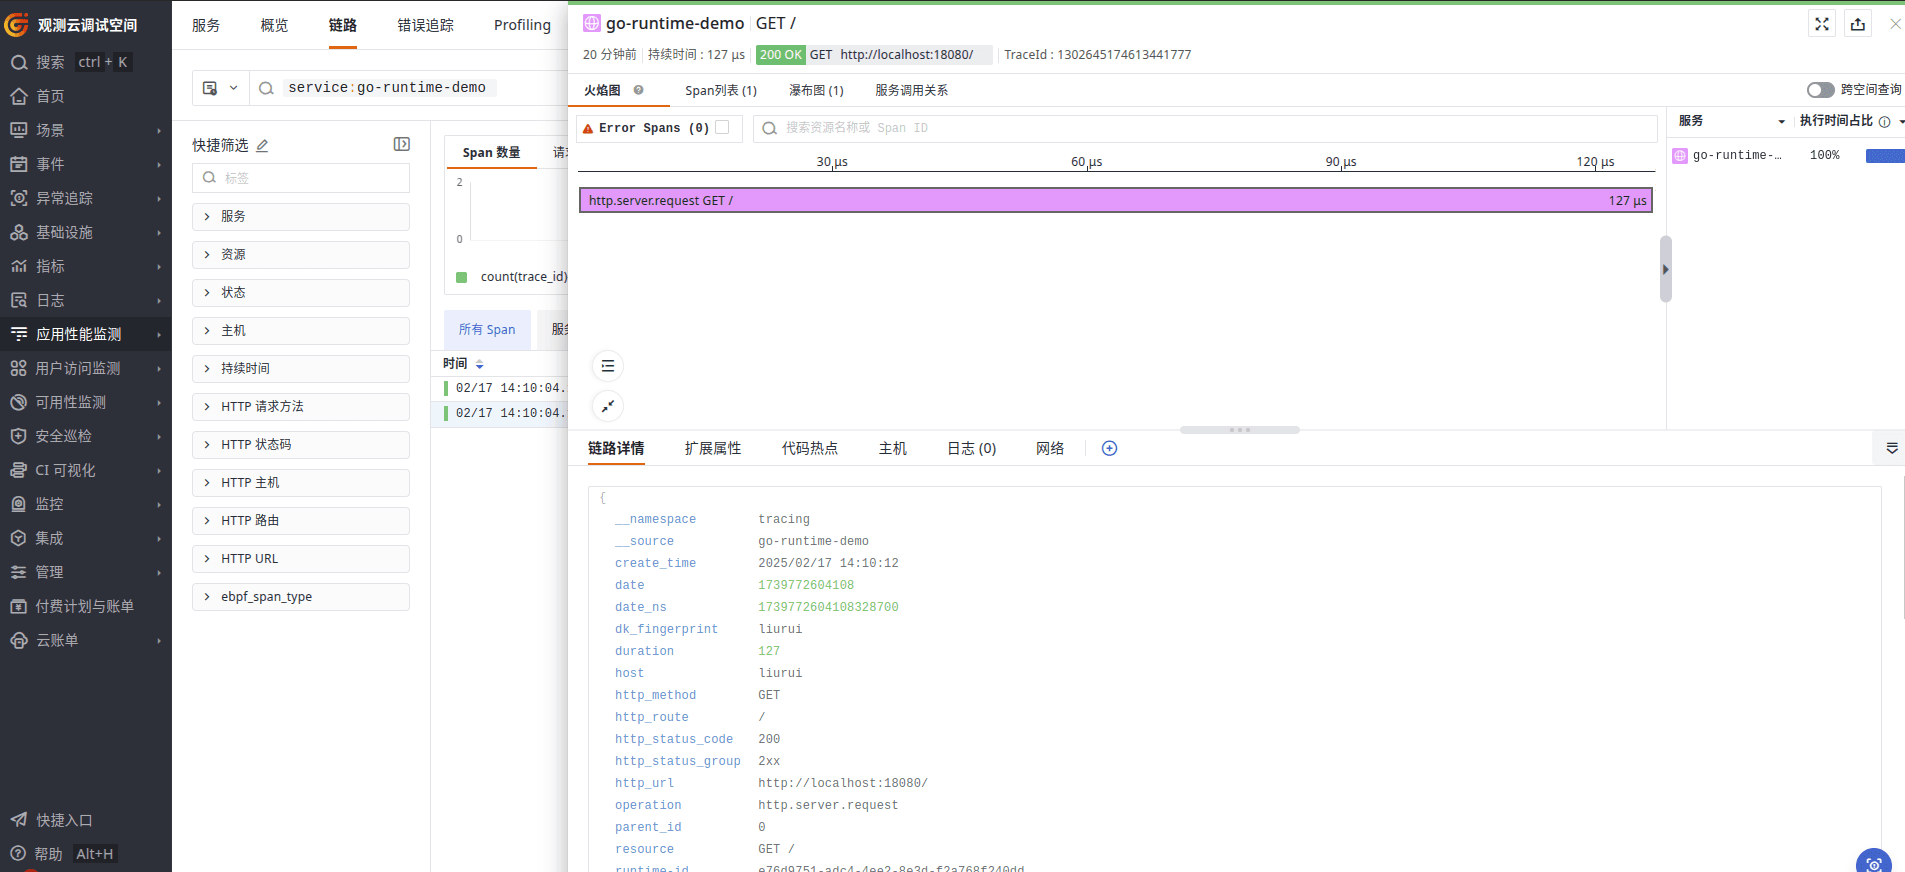
通过编译时插桩技术,Go 开发者可以在不修改业务代码的情况下,快速实现对应用程序的全面监控和优化,显著提升开发效率和运维能力。
Get a tailored plan
Contact us
Join the community

Scan with WeChat
to join the community
to join the community
Try Guance
Start online and pay only for what you use.
Get startedChoose a Guance plan