


Six Datadog alternatives for teams in Korea: costs, regions and migration
Compare six Datadog alternatives for Korea using actual observability workflows, regional availability, Korean support, billable usage and a reversible migration plan.
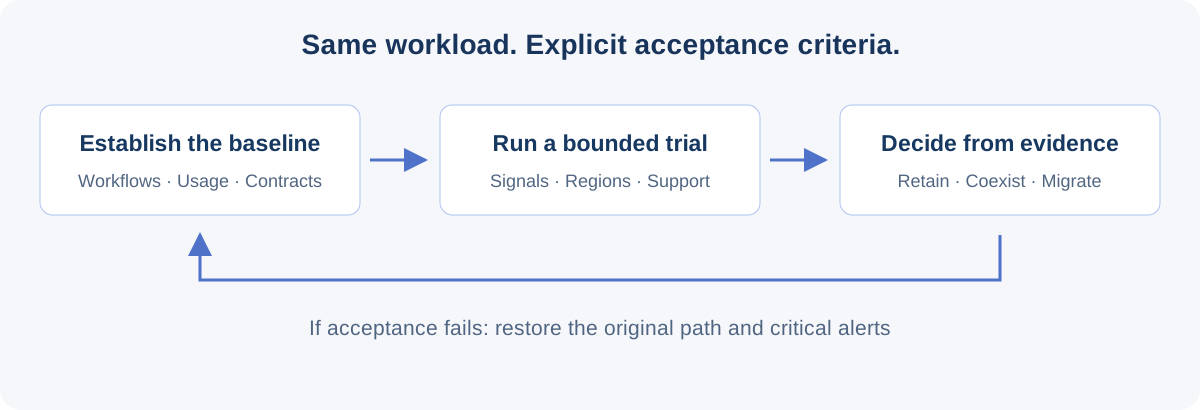
A Datadog alternative for a team in Korea has to survive more than a pricing comparison. It must support the investigations the team already runs, offer an acceptable data path, and provide help in the language and hours that matter during an incident. A cheaper-looking unit price does not answer those questions.
This guide compares six candidates: Dynatrace, Elastic Observability, Grafana Cloud, Guance, New Relic and Splunk Observability Cloud, listed alphabetically. They are candidates for evaluation, not a ranked list. Each has a documented observability scope, an OpenTelemetry path, and deployment or regional conditions worth checking. Their product boundaries differ substantially.
Guance publishes this article and is one of the candidates. Official documentation was reviewed on 27 October 2026. We have not run a shared production benchmark, inspected customer contracts, or completed the proposed proof of concept. The comparison separates documented facts from editorial evaluation criteria and questions that need customer-specific evidence.
When keeping Datadog is the sensible outcome
Datadog covers infrastructure, APM, logs, digital experience, synthetic testing, security and other operational workflows. A team with reliable dashboards, monitors, SLOs, integrations and established on-call habits should count those assets before considering replacement. Its OpenTelemetry options also mean that standardizing collection does not, on its own, require changing the backend.
Keeping Datadog may be preferable when the required features already work, retention and access satisfy audits, the effective contract is competitive, or the team cannot staff a migration. Narrowing indexed data or changing collection policy may solve a cost problem without replacing the platform. A proof of concept is allowed to conclude “stay.”
Before building a shortlist, ask which billing meter is driving the decision; which dashboards, alerts, SLOs and history must survive; where data and support artifacts may be processed; whether Korean-language support and KST coverage are mandatory; and which SDKs, Agents and OpenTelemetry components are already deployed. Include privacy, retention, performance and migration staffing in those requirements.
An evaluation plan, not an observed migration result.
Six candidates and their important boundaries
| Candidate | Why evaluate it | Regional or deployment boundary | What the proof of concept must establish |
|---|---|---|---|
| Dynatrace | Automated discovery and dependency analysis for a broad application estate | SaaS and on-premises options have different terms; APAC storage regions are not synthetic test locations | Coverage of required modules, supported environments and investigation quality |
| Elastic Observability | Search-driven log and application analysis, including a Seoul Hosted option | AWS Seoul is listed for Elastic Cloud Hosted; Hosted is not Serverless, and self-managed operations remain your responsibility | Indexing, mappings, retention, regional features and migration work |
| Grafana Cloud | Managed metrics, logs, traces and profiles with an OpenTelemetry collection path | APAC regions include Tokyo and Singapore; an existing stack's region cannot simply be changed | Attribute conversion, cardinality, dashboards, alerting and any new-stack migration |
| Guance | Different signal meters, DataKit ingestion and SaaS or private deployment evaluation | Public sites include Singapore, Jakarta and Hong Kong; a Korean public SaaS site is not documented | Exact site, features, collection semantics, Korean support and actual billable quantities |
| New Relic | A broad SaaS platform and a different data/user/consumption model | US, EU and Japan conditions differ; Japan requires the relevant Japan-entity purchase conditions | Regional feature limits, operational-data paths and contract suitability |
| Splunk Observability Cloud | OpenTelemetry collection and established Splunk operational workflows | A SaaS observability backend with APAC realms; Splunk Platform log products are separate | The log integration, licenses and data paths required for the full investigation |
Dynatrace: distinguish storage regions from test locations
Dynatrace documents SaaS monitoring environments and on-premises deployment options. Its APAC storage list includes Sydney, Singapore, Mumbai and Tokyo; some regions require contacting sales. A Seoul synthetic execution location is not proof that the observability backend stores data in Korea. Environment documentation, data controls
OpenTelemetry ingestion can use supported direct OTLP and Collector paths. Evaluate the actual language/runtime mix, discovery and dependency model, modules available in the chosen deployment, and operating responsibilities. Product descriptions of causal analysis do not demonstrate that the tool has identified the cause of your incidents.
Elastic: Seoul Hosted availability is a specific product fact
Elastic Observability spans logs, metrics, APM and digital experience, with profiling capabilities in its portfolio. Elastic Cloud Hosted regions list AWS Seoul, aws-ap-northeast-2. Do not carry that fact over to every Serverless offering or assume every feature is available in every region.
Its OpenTelemetry options are relevant to teams that want a search-oriented platform. Compare the selected Hosted, Serverless or self-managed model, including mappings, storage, scaling and operational staffing. A regional move or data-model change can require new deployments and reindexing; query compatibility and historical data need their own plan.
Grafana Cloud: managed services are different from assembling the OSS stack
Grafana Cloud provides managed metrics, logs, traces, profiles and visualization. It is not just an installed copy of the Grafana UI. Its platform builds on technologies such as Mimir, Loki and Tempo, but the Cloud operating model differs from running those systems yourself. Cloud overview
The regional list includes AWS Tokyo and Singapore, and Google Cloud Singapore. An existing stack cannot have its region changed in place; a different region requires another stack and a migration plan. Use the OTLP guidance and Alloy where appropriate, then test label and attribute conversion, cardinality, sampling, dashboards and alert rules against real requirements.
Guance: examine the whole data path and operating model
Guance documents infrastructure, metrics, logs, APM, RUM and availability monitoring, alongside additional product areas. Product scope and the chosen modules should define the comparison—not an assumption that every Datadog workflow has an equivalent.
Its commercial sites include AP1 on AWS Singapore, AP2 on Alibaba Cloud Singapore, ID1 on Tencent Cloud Jakarta, and CN6 on Alibaba Cloud Hong Kong. A public Seoul or Korea SaaS site is not listed in the reviewed documentation. Sites are independent: accounts and data do not automatically transfer or become shared.
DataKit OpenTelemetry and tracing inputs include supported OTLP and DDTrace routes. The private deployment plan needs a separate review of commercial availability, modules, resource sizing, usage reporting, network access, upgrades and incident ownership. Korean UI availability or a ticket system does not establish Korean-language technical support, KST escalation or a response SLA.
New Relic: Japan is no longer simply a Preview caveat
New Relic offers APM, infrastructure, logs, browser/mobile monitoring, synthetics, network capabilities and alerting. Its data-region documentation includes US, EU and Japan conditions. Current Japan availability should not be described as only Preview, but purchase through the appropriate Japan entity and regional feature or legacy API limits still matter.
Selected-region customer data does not mean that every processing or support operation occurs only there. Data-location documentation distinguishes customer data from Systems Operations Data, which is handled in the US across regions. A Japan OTLP endpoint establishes neither Korean hosting nor identical functionality across regions. Test the OTLP path, user model and workflows under the actual purchasing and regional conditions.
Splunk: keep Observability Cloud and log products distinct
Splunk Observability Cloud is a SaaS backend for infrastructure, APM, RUM and synthetics. APAC realms include Singapore, Tokyo and Sydney. It can observe cloud and on-premises workloads, but that does not make the backend self-hosted. Service description
Its OpenTelemetry distribution provides a collection path. A full log investigation may additionally involve Splunk Platform and Log Observer Connect, with separate ingestion, licensing and configuration. Check the product overview before counting “logs” as an included, equivalent capability.
Compare an investigation, not a row of checkmarks
For infrastructure, compare entity identity, labels and topology. For APM, compare retained traces, errors, dependencies and profiles under the same sampling policy. For logs, include parsing, indexing, archiving, rehydration, search and access. For RUM, include sessions, consent, replay and retention; for synthetics, locations, scripts and private probes. Security rules, response procedures and AI assistance need explicit input, permission, false-positive and explanation checks.
OpenTelemetry standardizes telemetry interfaces and data paths; it does not make backend semantics or products identical. Supported Collector pipelines can send selected signals to multiple exporters, but an endpoint change alone is a cutover, not automatic dual writing. Queues, retries, dropped data, network egress and overlapping instrumentation must be measured. OpenTelemetry, Collector
Dashboards, notebooks, monitors, escalation rules, SLO history, RBAC, log pipelines, archives, RUM scripts, synthetic tests, incident records and proprietary analysis do not automatically migrate with an OTLP payload.
Korea-specific data and deployment questions
Datadog's site list identifies AP1 as Japan and AP2 as Australia. Neither name means a Korean site or a Korean contract price. Guance's AP1 and AP2 refer to different providers in Singapore. Site codes cannot be compared without their vendor and location.
For every candidate, document primary storage, processing, backups, disaster recovery, support-data access, subprocessors and cross-border paths. Ask about regional feature availability, latency from the actual Korean network, encryption and keys, retention/deletion, exports and exit terms. A location on a map does not prove compliance with Korean requirements; the applicable contract, data-processing terms and security review must cover the actual use case.
Datadog BYOC Logs places supported log processing and storage in the customer's cloud while retaining a Datadog UI/control path and query-result flow. It is a customer-side deployment option with a defined scope, not a self-hosted edition of the whole platform. Guance private deployment has a different platform scope and operational contract. Compare those boundaries before making either a positive or negative deployment claim.
Use actual billable quantities, not raw volume alone
The Datadog pricing guide for Korea owns the numeric scenarios. A useful comparison begins with the same workload and investigation requirements, then measures how each product bills it.
Record log GB and event sizes, Datadog Standard/Flex indexing scope, and any Guance large-event splitting into billable records. Include metric cardinality and the actual series/data-point model, trace sampling and indexed spans, RUM sessions, replay, synthetics, retention, support, commitments, discounts, tax and migration labor. The same raw input does not imply the same billable quantity. Guance's billing documentation must be read for the enabled account model rather than reduced to a single “pay by data” claim.
A lower quoted ingestion price can be outweighed by required retention, additional products, user access or operations. None of the reviewed public sources establishes a universally cheaper candidate for the entire scoped platform.
Korean-language support has concrete operating hours
Datadog's Korean support documentation lists Korean support on weekdays excluding holidays, 09:00–17:00 KST; chat windows are 10:00–11:30 and 13:00–16:00 KST. Check the actual support plan, severity definitions and escalation terms. An initial response target is not a restoration guarantee.
Guance's ticket service and workspace language settings do not establish Korean technical staffing or KST coverage. For each vendor, obtain the language, channel, timezone, holiday calendar, severity-based response and update frequency, night/weekend escalation, access locations, implementation responsibility, post-incident support and any applicable service credits in writing.
Treat migration as an inventory of operational assets
| Asset | Keep during evaluation | Rebuild or verify | Retire only deliberately |
|---|---|---|---|
| Collection | Existing known-good path | Selected new exporters, attributes, sampling and duplicate prevention | Redundant Agents after acceptance |
| Dashboards | Audit and rollback views | Minimum incident views and equivalent queries | Unused panels |
| Monitors and SLOs | Critical alerts and rollback route | Routing, thresholds, error budgets and history | Redundant rules with owner approval |
| Logs and archives | Required historical access | Parsers, indexes, rehydration and exports | Unneeded data under retention policy |
| Roles | Essential existing access | Least privilege and audit continuity | Duplicate accounts |
| Integrations | Required downstream systems | Replacements, secrets and missing features | Unused connections |
Set stop conditions for data loss, slower investigation, missed alerts, access defects, billable-volume spikes or failed support escalation. The existing Datadog alerts must remain recoverable. A one-service DDTrace canary can test a receiver path; it cannot prove automatic migration of this inventory.
A proposed 30-day proof of concept
This plan has not been executed. It provides no measured recovery time, overhead, savings or feature-equivalence result. Record exact versions, environment and owners, baseline signal volumes, privacy controls, acceptance thresholds, rollback steps and redacted evidence before starting.
Use representative incidents: a slow SQL query in a Java/Spring service; Pod restarts and CPU saturation; a downstream timeout; a JavaScript error correlated with a backend request; and a release that changes latency or errors. Also compare log billing, OpenTelemetry/DDTrace field mapping, Collector resource use and queue/retry/drop counters, Korean-network connectivity to candidate sites, and a support escalation rehearsal. Capture identical time windows, queries, identities, raw counts and missing evidence.
Classify results as verified equivalent, acceptable difference, blocker or unknown. A test that was never run remains unknown, not a pass.
- Establish the existing investigation, usage and contract baseline.
- Select representative services and only the signals needed for the trial.
- Configure a supported, bounded parallel collection path where appropriate.
- Have the same engineers answer the same incident questions.
- Compare missing features, billable quantities and operational work.
- Resolve regional, security and support requirements in writing.
- Exercise acceptance and rollback, then decide on partial adoption, coexistence, an extended trial or staying with Datadog.
A practical schedule allocates the first week to baseline and setup, the next two to collection and investigation, and the final week to costs, support and rollback. It is not a promise that every organization can finish in 30 days.
Make the decision conditional
Dynatrace may fit broad automated discovery needs; Elastic may fit search-led operations and a specifically required Seoul Hosted deployment; Grafana Cloud may fit a managed open-source-oriented telemetry stack. Guance merits a scoped trial when its meters, ingestion routes or private deployment match the requirements. New Relic requires a fit with the actual regional purchase and feature conditions, while Splunk requires a clear boundary between Observability Cloud and the log platform.
If a required Korean hosting or contract condition is absent from a candidate's documentation, resolve it with that candidate before proceeding. Do not infer that every vendor lacks a Korean option—Elastic Hosted's Seoul entry is one documented counterexample. Coexistence can be useful, but it adds ownership, duplicate costs and an eventual exit decision.
Public documentation still cannot establish complete workflow parity, production query latency and concurrency, data completeness, collection overhead, AI results, every module in a chosen site, automatic asset/history migration, legal suitability, measured regional latency, customer discounts or Guance Korean support. Keep these as explicit acceptance items. There is no basis here for claims that all Datadog customers dislike its prices, that it has no public pricing or customer-side options, or that Guance is universally cheaper or a seamless replacement.
Primary references
- Datadog product scope, Sites, Korean support, BYOC Logs features
- Dynatrace environments, data controls, OpenTelemetry
- Elastic Observability, Hosted regions
- Grafana regions, OTLP
- Guance sites, Deployment Plan, DDTrace
- New Relic regions, Japan announcement, data locations
- Splunk service description, OpenTelemetry vendor requirements
Contact us
Join the community

to join the community
Try Guance
Start online and pay only for what you use.
Get startedChoose a Guance plan