Log Monitoring and Analytics

Search, analyse, and correlate every log without losing operational context

Guance centralises application, host, container, cloud, security, and custom logs, then adds field parsing, patterns, visual analysis, alerts, and correlation with traces, infrastructure, and events for faster troubleshooting.

Search, analyse, and correlate every log without losing operational context

What Log Monitoring helps you solve

Turn distributed logs into searchable evidence, alerts, and root-cause context

Guance gives development, operations, SRE, and security teams a shared workflow for searching logs, discovering patterns, extracting fields, and following an abnormal record into the trace, resource, or event that explains it.

A real investigation path

From millions of records to the error pattern, request, and resource that matter

Centralise the logs, use patterns and fields to narrow the anomaly, and then follow the matching evidence into traces and infrastructure context.

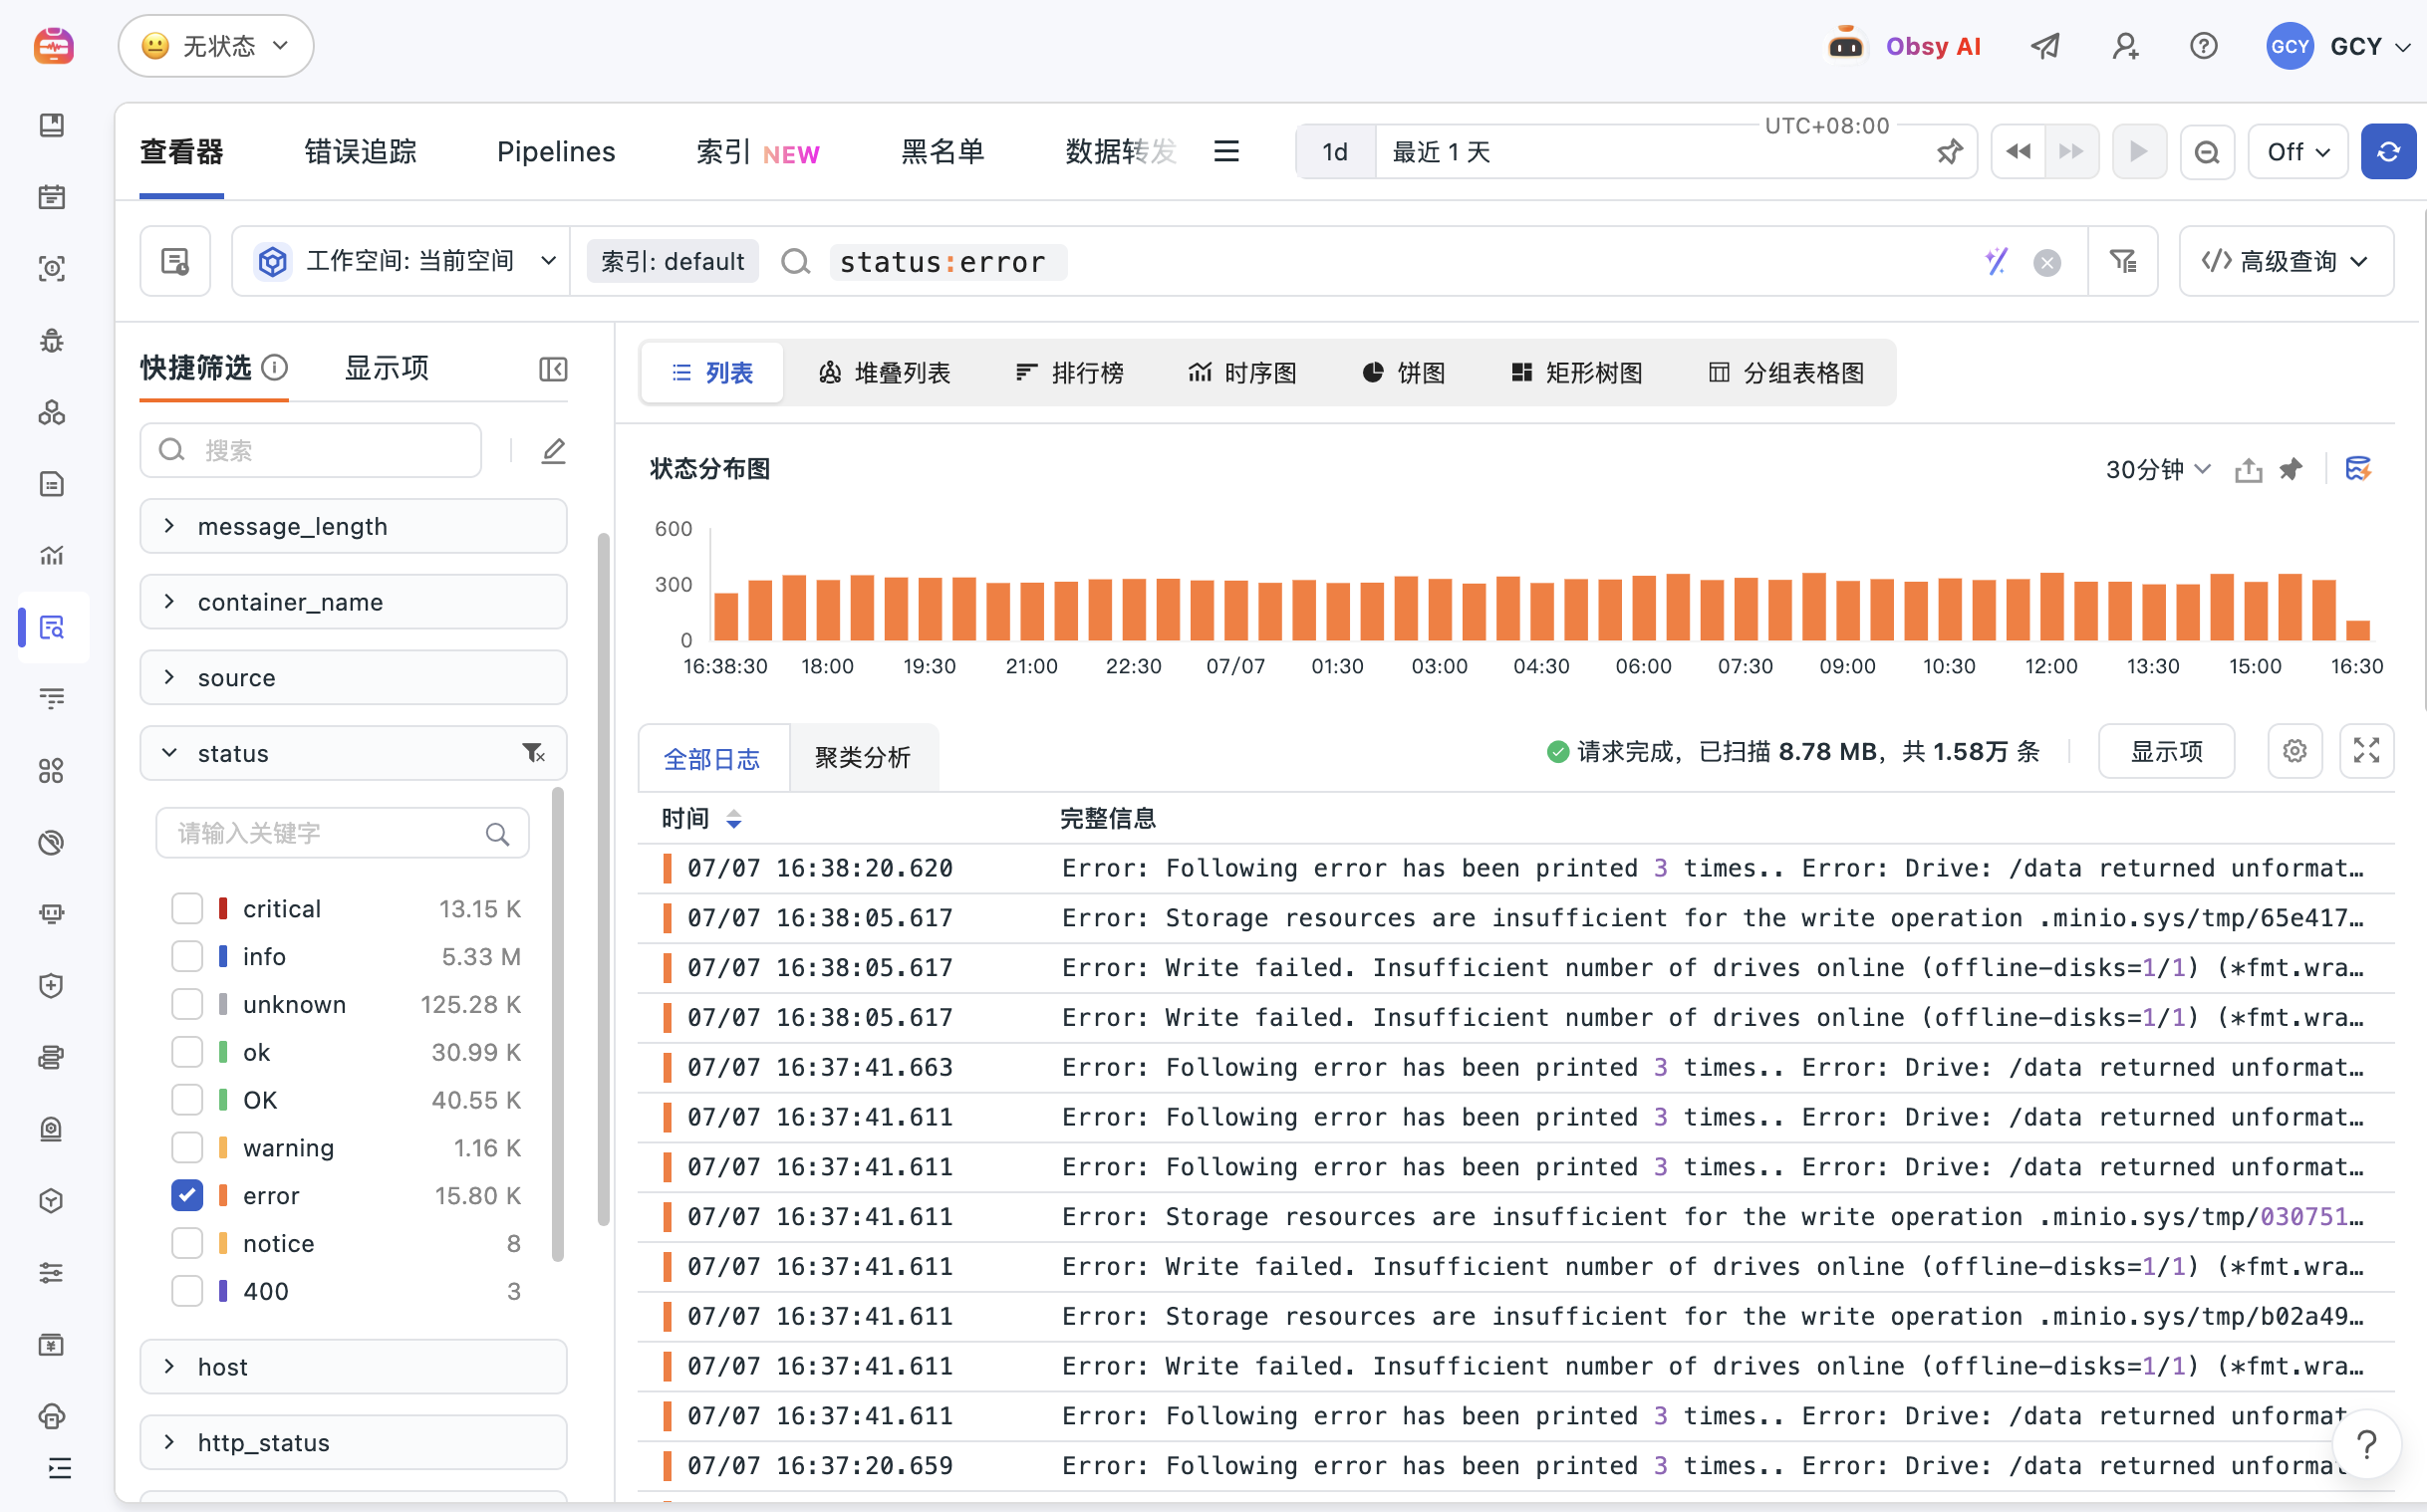
Search distributed logs through one query entry point

EvidenceSource, service, environment, host, container, severity, and message

ConclusionCreate a consistent time window and scope for the investigation

Data path

Applications, hosts, containers, cloud, and security sources → Pipeline → Log search and patterns → Traces, resources, events, and alerts

Best for

For development, operations, SRE, security, and platform teams investigating distributed applications and infrastructure.

Requirements

Collection and parsing determine which fields are available. Retention, indexing, access, and masking should be governed through log management policies.

View setup guide
Unstructured messages slow every investigation. Extract fields once
Pipeline processing parses business and technical identifiers such as order IDs, endpoints, error codes, user IDs, and status values. Structured fields make logs easier to filter, aggregate, correlate, and reuse in alerts.
View documentation
Unstructured messages slow every investigation. Extract fields once
A useful query should not be rebuilt during every incident
Save important searches and thresholds as log monitors. Route alerts with the matching records, dimensions, service, environment, and supporting links already attached for the responding team.
View documentation

Frequently asked questions

What is the difference between log monitoring and log management?

Log monitoring focuses on searching, analysing, correlating, and alerting on log activity. Log management governs collection, parsing, retention, indexing, access, masking, forwarding, and cost across the log lifecycle. Most teams need both.

What should a log analytics platform provide?

It should centralise logs, support fast search and filtering, extract structured fields, reveal patterns and distributions, correlate records with other telemetry, and turn useful queries into alerts and repeatable investigations.

Which data can Guance correlate with logs?

Logs can be connected to APM traces, services, hosts, containers, Kubernetes resources, metrics, network data, events, and alerts when shared identifiers and tags are collected.

How does a log query become an alert?

Save a validated query and define its evaluation window, threshold, grouping dimensions, severity, and notification route. Matching records then provide the evidence for each triggered monitor.

When is log parsing useful?

Parsing is useful when important values are embedded in free-form messages, when sources use inconsistent formats, or when teams need reliable fields for filtering, aggregation, correlation, masking, and alerting.


Continue exploring logs and observability

Connect log monitoring to APM, Pipeline processing, log management, documentation, and pricing.

Get started > View documentation > View pricing >