User Behavior Analytics

Find the friction behind drop-off and conversion changes

Guance User Behavior Analytics connects real navigation paths, click heatmaps, funnels, user segments, business events, Session Replay, and RUM performance. Product, operations, and engineering teams can see where users abandon a journey and whether slow pages, errors, or confusing interactions contributed.

Find the friction behind drop-off and conversion changes

What User Behavior Analytics helps you solve

Explain a conversion change with journey, interaction, and performance evidence

A funnel shows where users leave, but not always why. Guance connects paths, clicks, segments, replay, frontend performance, errors, and business events so teams can test whether the friction comes from product design, page behavior, or system performance.

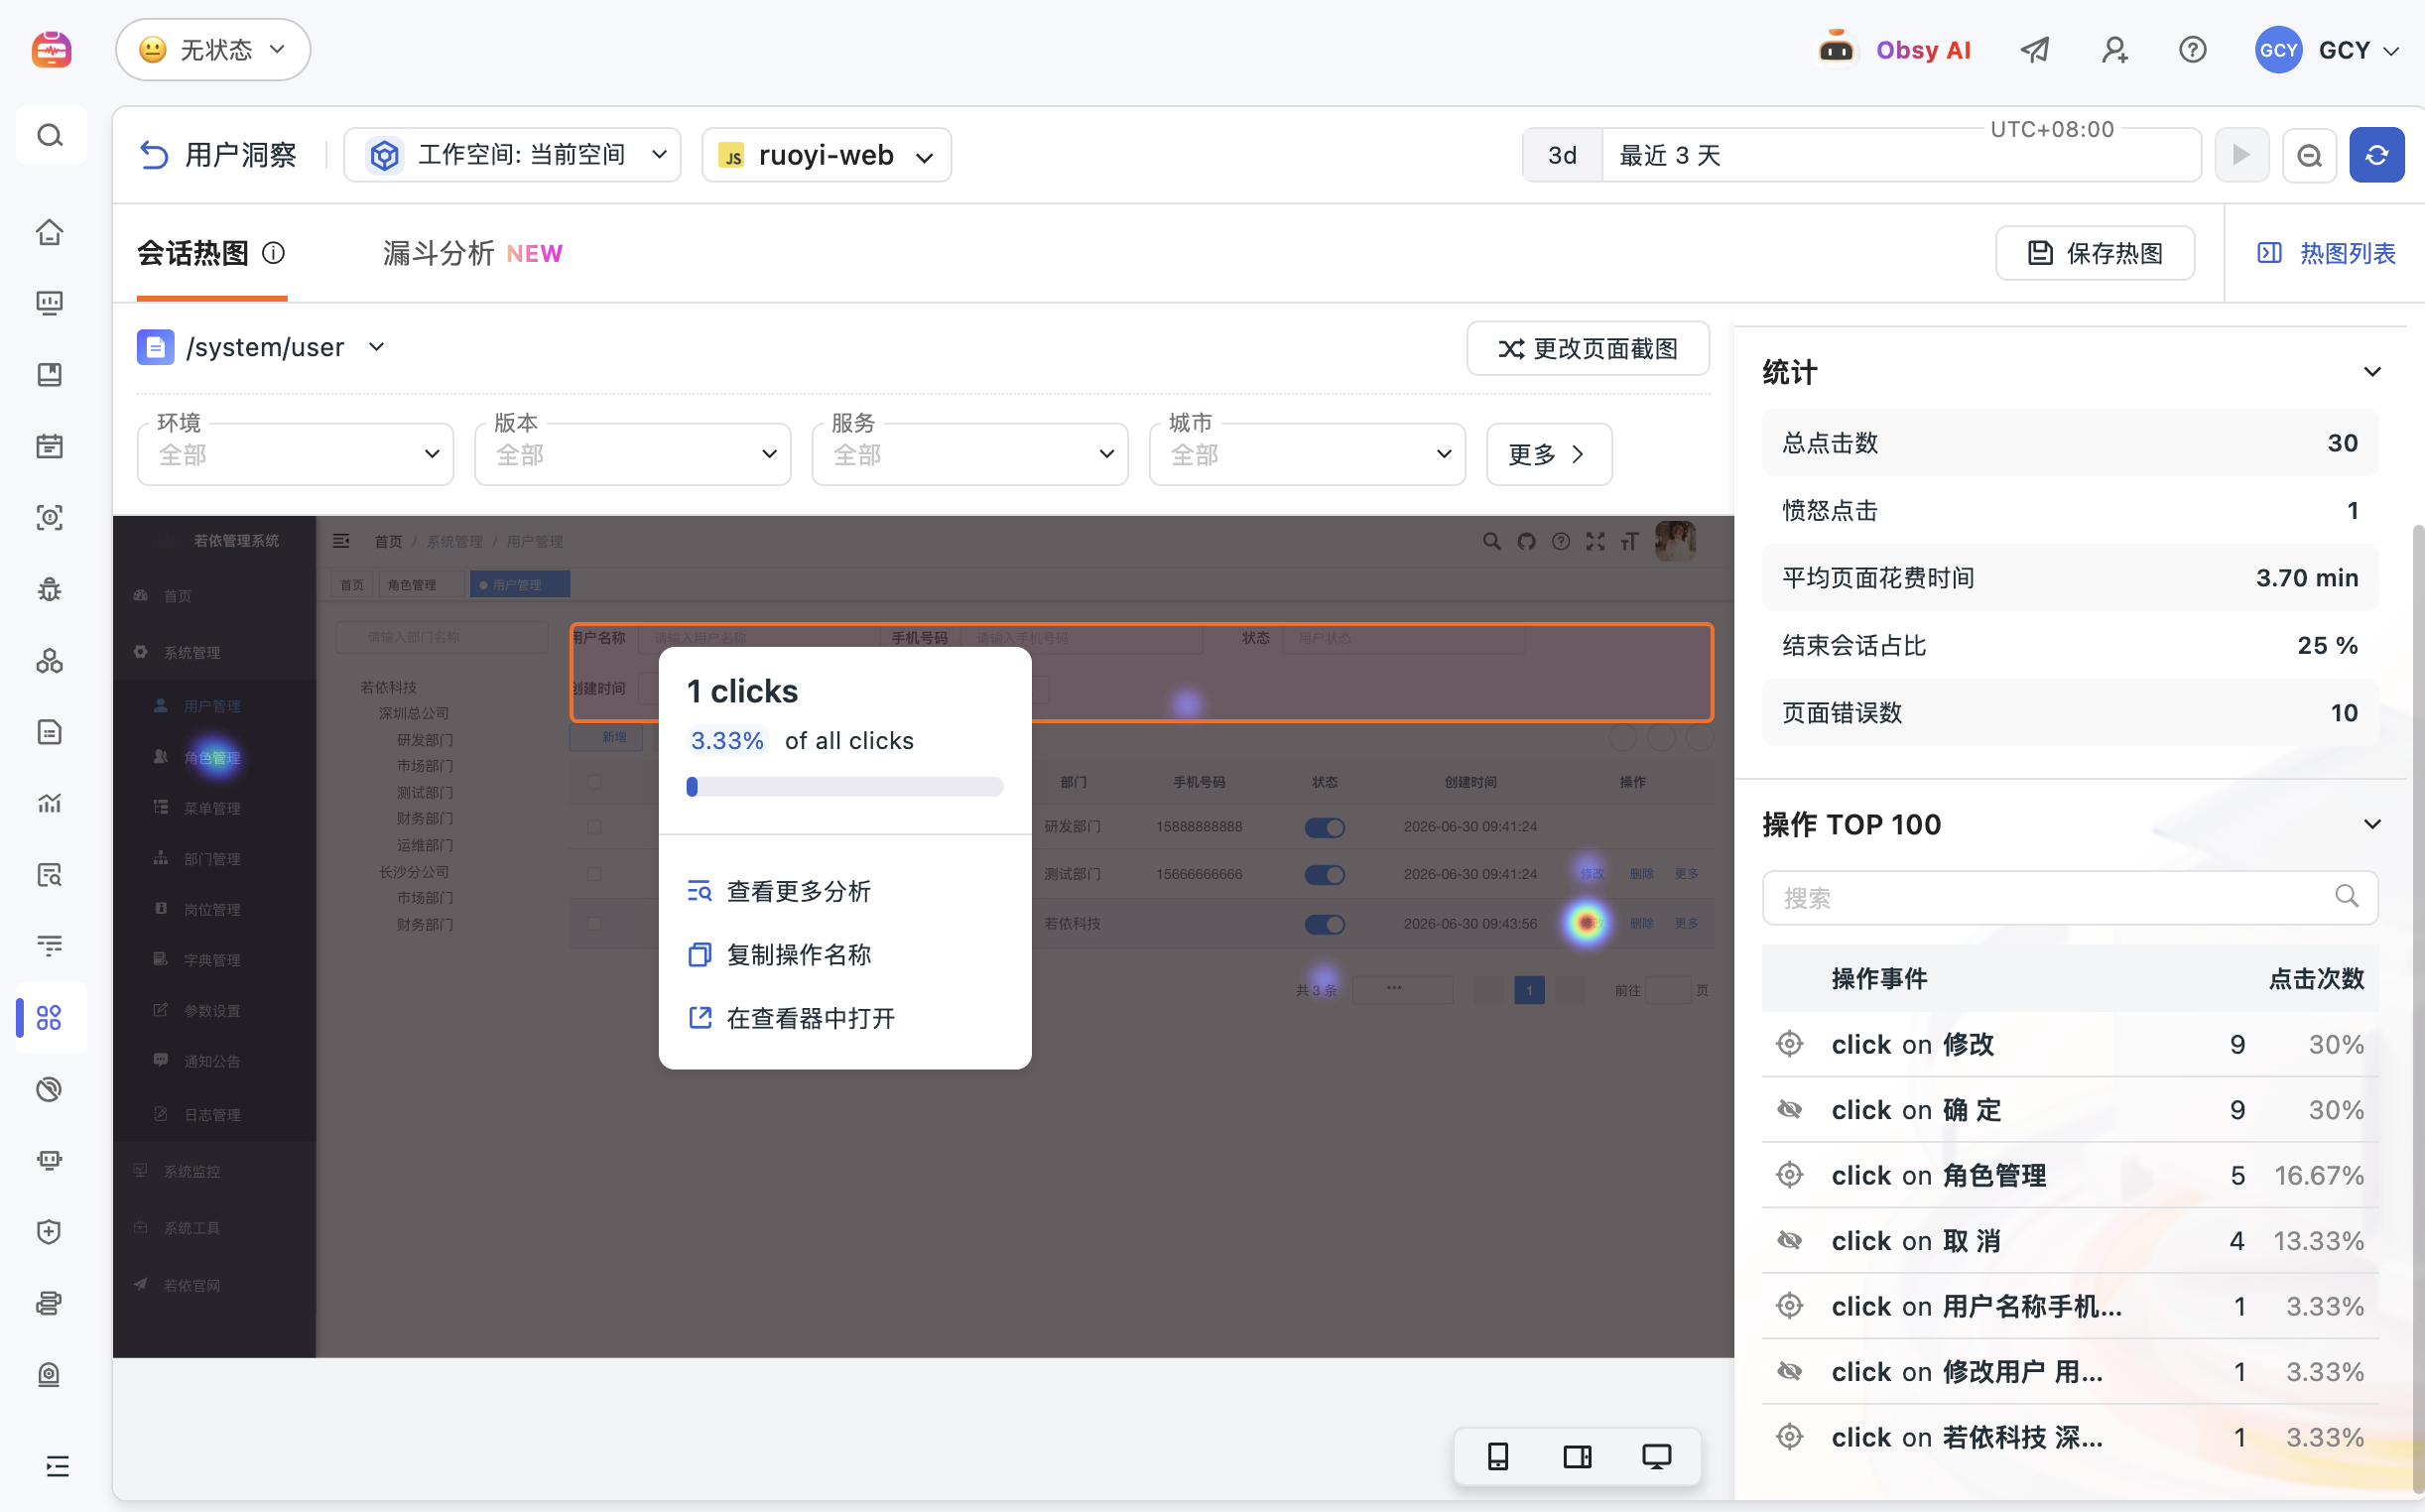
Are users seeing and selecting the primary action? Validate it with heatmaps
Visualise click location, frequency, and distribution to evaluate calls to action, forms, navigation, and important content. Heatmaps can expose dead clicks, misleading controls, and layout problems that are difficult to infer from page-view totals alone.
View documentation
Are users seeing and selecting the primary action? Validate it with heatmaps
Find the step where registration, checkout, or payment loses users
Define a multi-step funnel and compare completion by device, region, version, channel, or user attribute. Move from the drop-off step into performance, error, and replay evidence to test whether experience quality contributed.
View documentation
Connect what users did with what the system was doing
Compare behavior with browser or mobile RUM, Session Replay, APM, and logs. Teams can see whether the page was slow, a request failed, JavaScript errored, or a backend service became unhealthy when a key journey stopped progressing.
View documentation
Connect what users did with what the system was doing

Frequently asked questions

What is User Behavior Analytics?

User Behavior Analytics examines navigation paths, clicks, funnels, segments, and business events across websites and apps. It helps teams find journey drop-off, interaction friction, and product-improvement opportunities.

How does User Behavior Analytics differ from RUM?

RUM focuses on the performance, errors, requests, and context of real sessions. User Behavior Analytics focuses on paths, actions, segments, and conversion. Together they show whether a technical experience problem affected a business outcome.

What can a click heatmap reveal?

A heatmap shows where and how often users click. It can help validate calls to action and reveal dead clicks, misleading controls, attention gaps, and device-specific layout problems.

Which journeys work well as conversion funnels?

Common funnels include registration, login, checkout, payment, form submission, entitlement activation, and renewal. The useful steps should correspond to explicit user or business events.


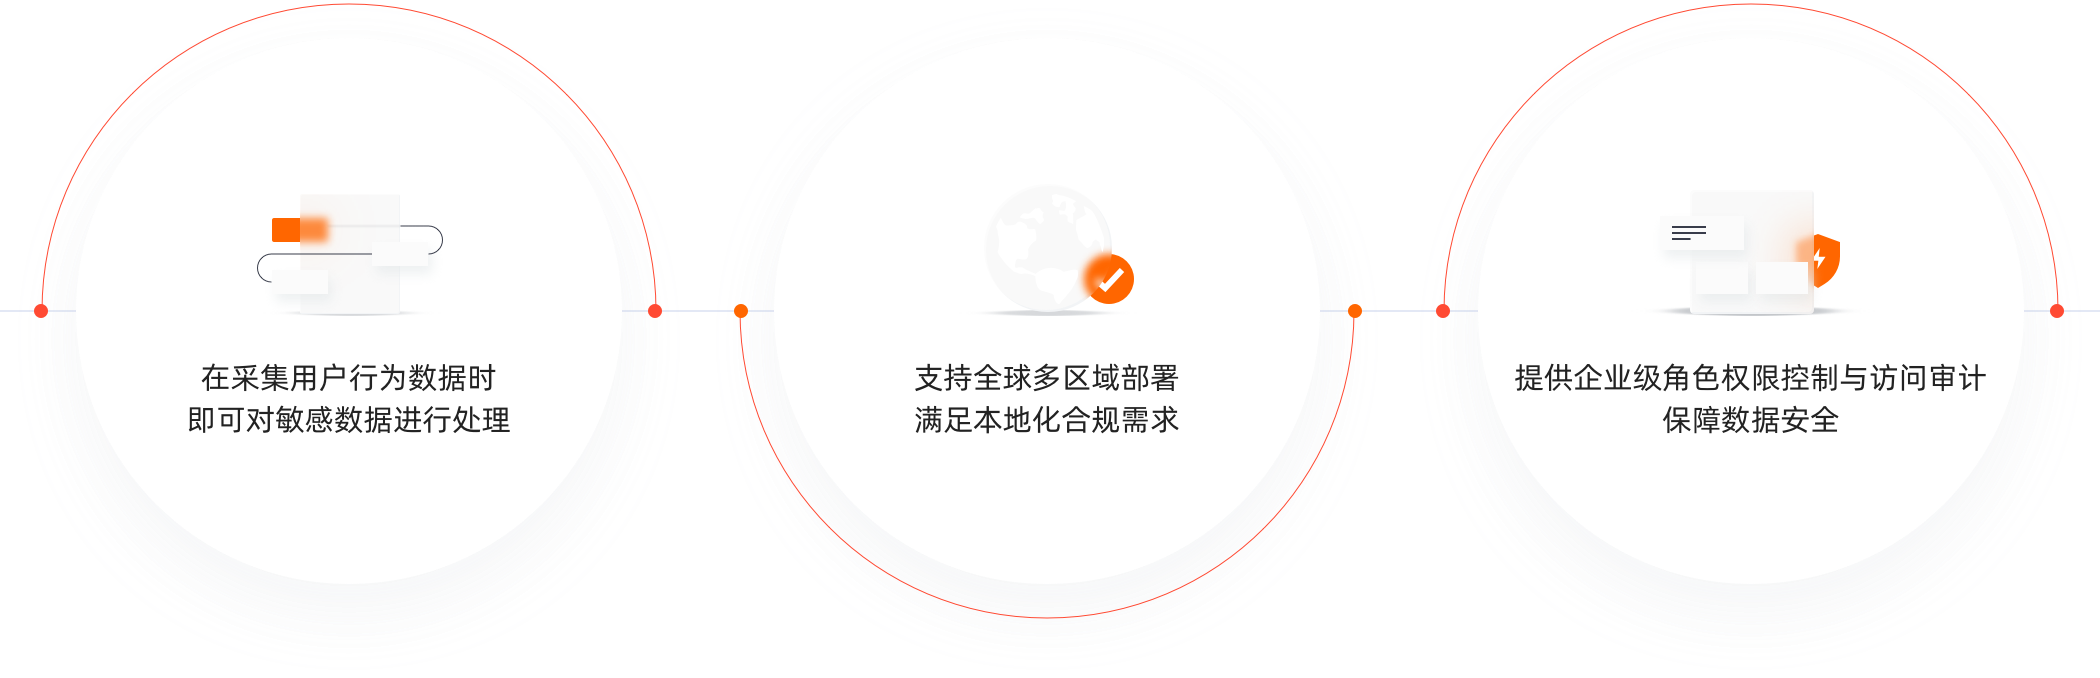
Reliable, secure, and compliant

Visit the Trust Center
观测云稳定可靠与安全合规能力

Related reading

Connect product behavior to experience quality and technical evidence

Explore RUM, Session Replay, dashboards, digital experience, documentation, and pricing.

Get started > View documentation > View pricing >