Phone:400-882-3320


Trust in 'Guance' across all industries
Not only does it deliver a comprehensive visibility solution,
It also delivers a sustainable and evolving business management methodology and a team of experts who understand technology and business.
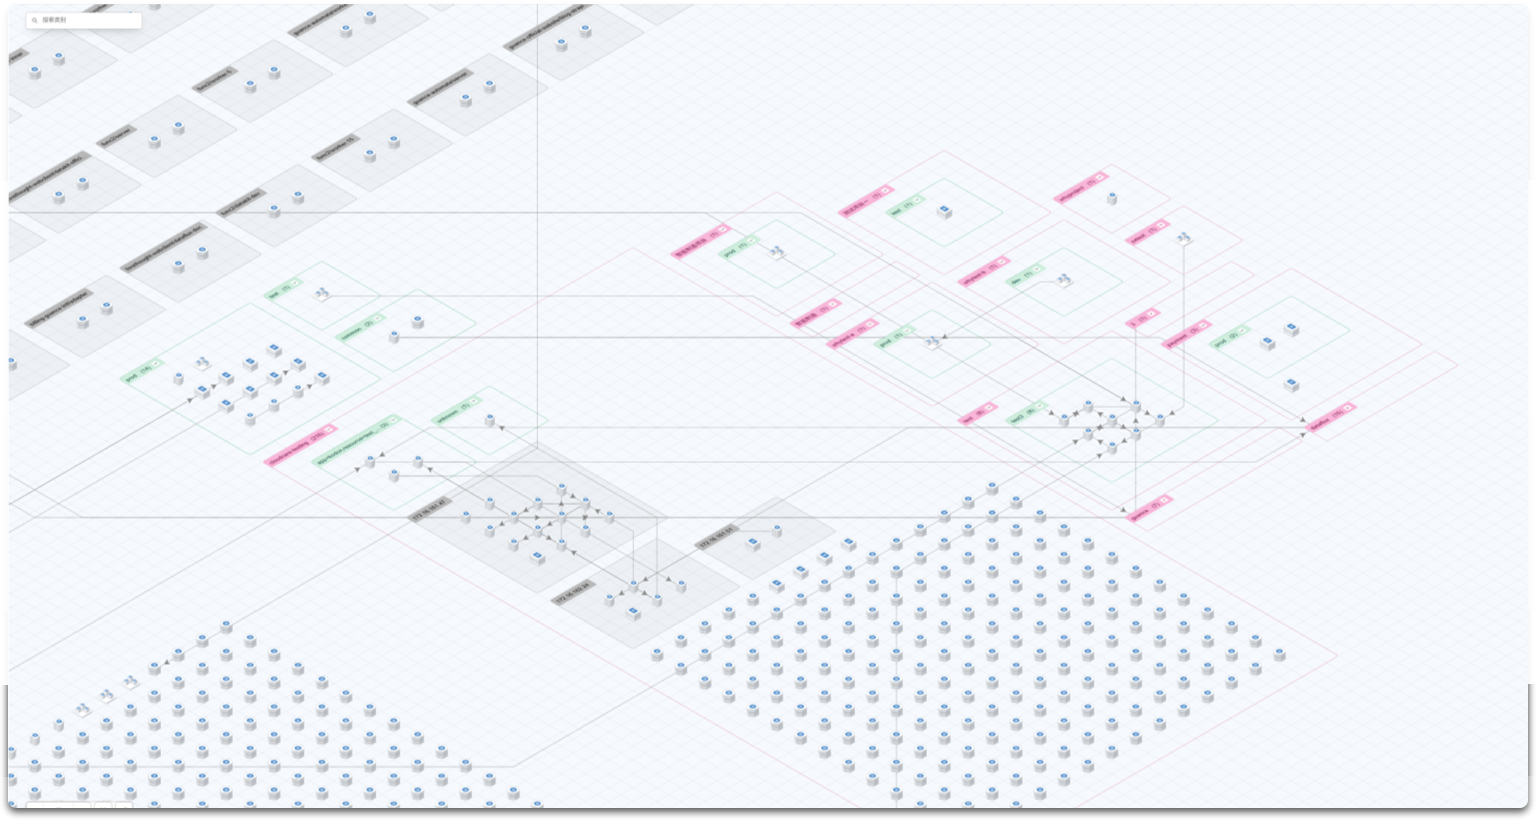
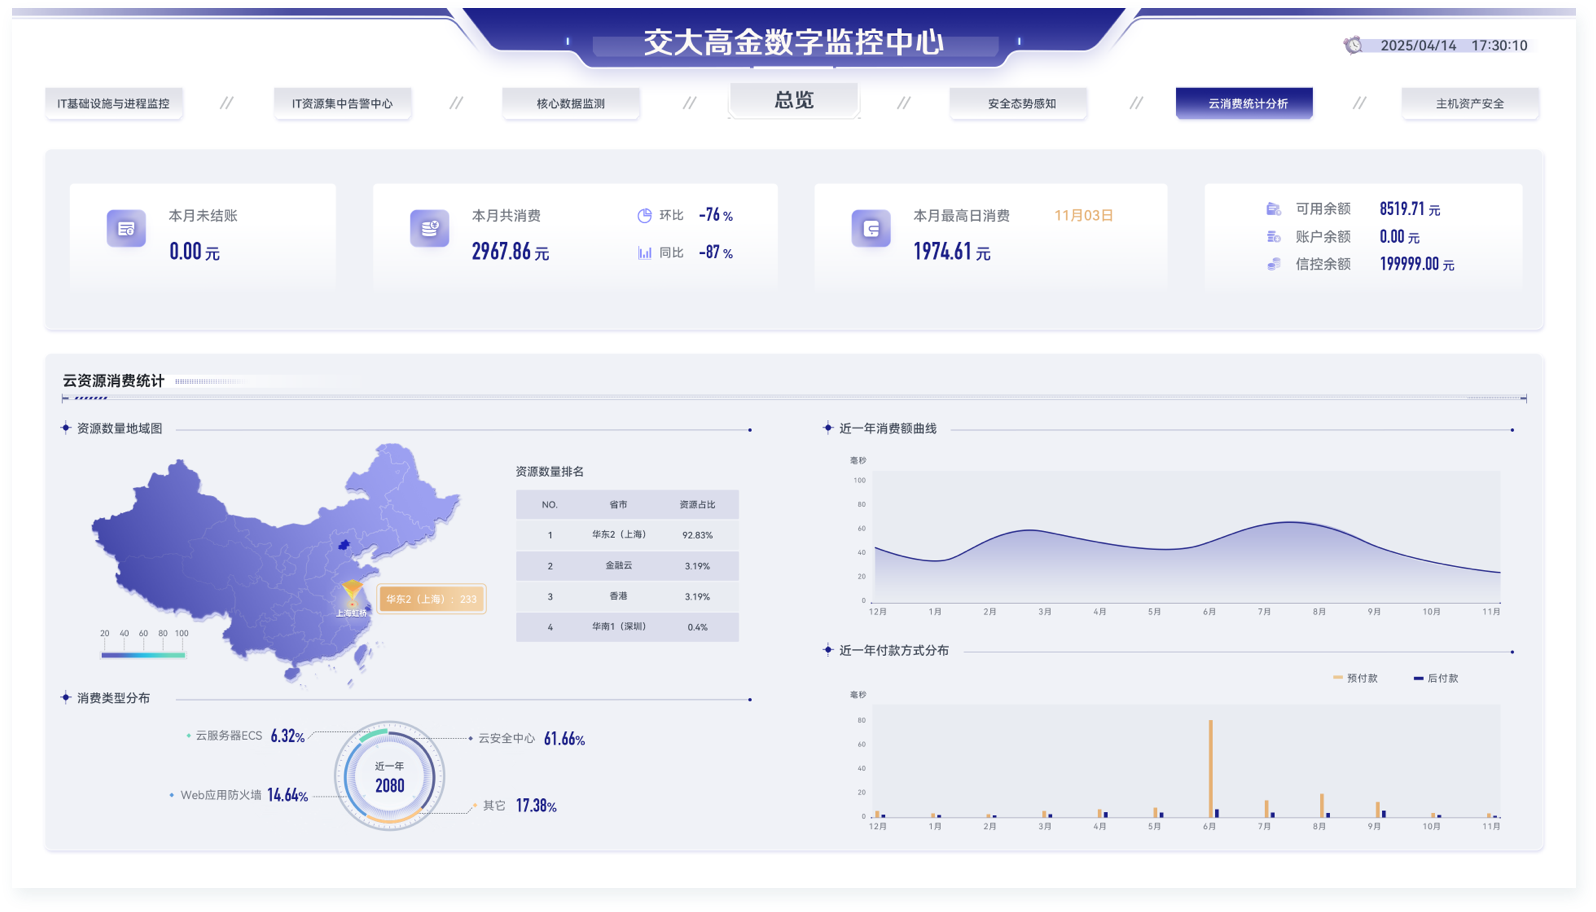
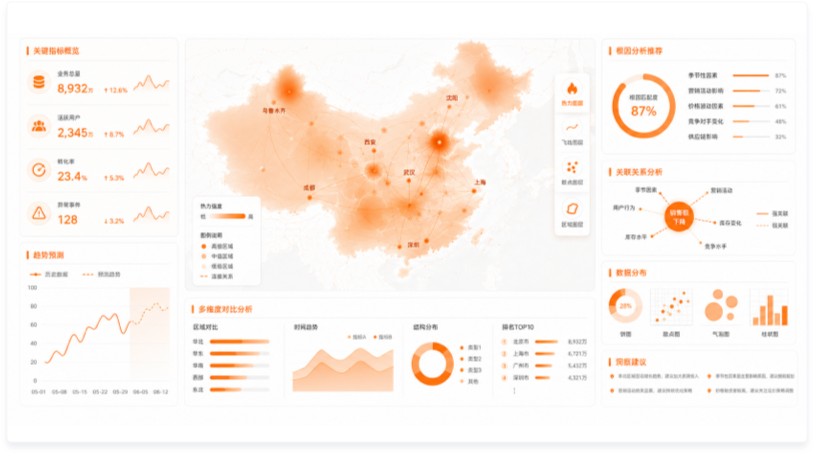
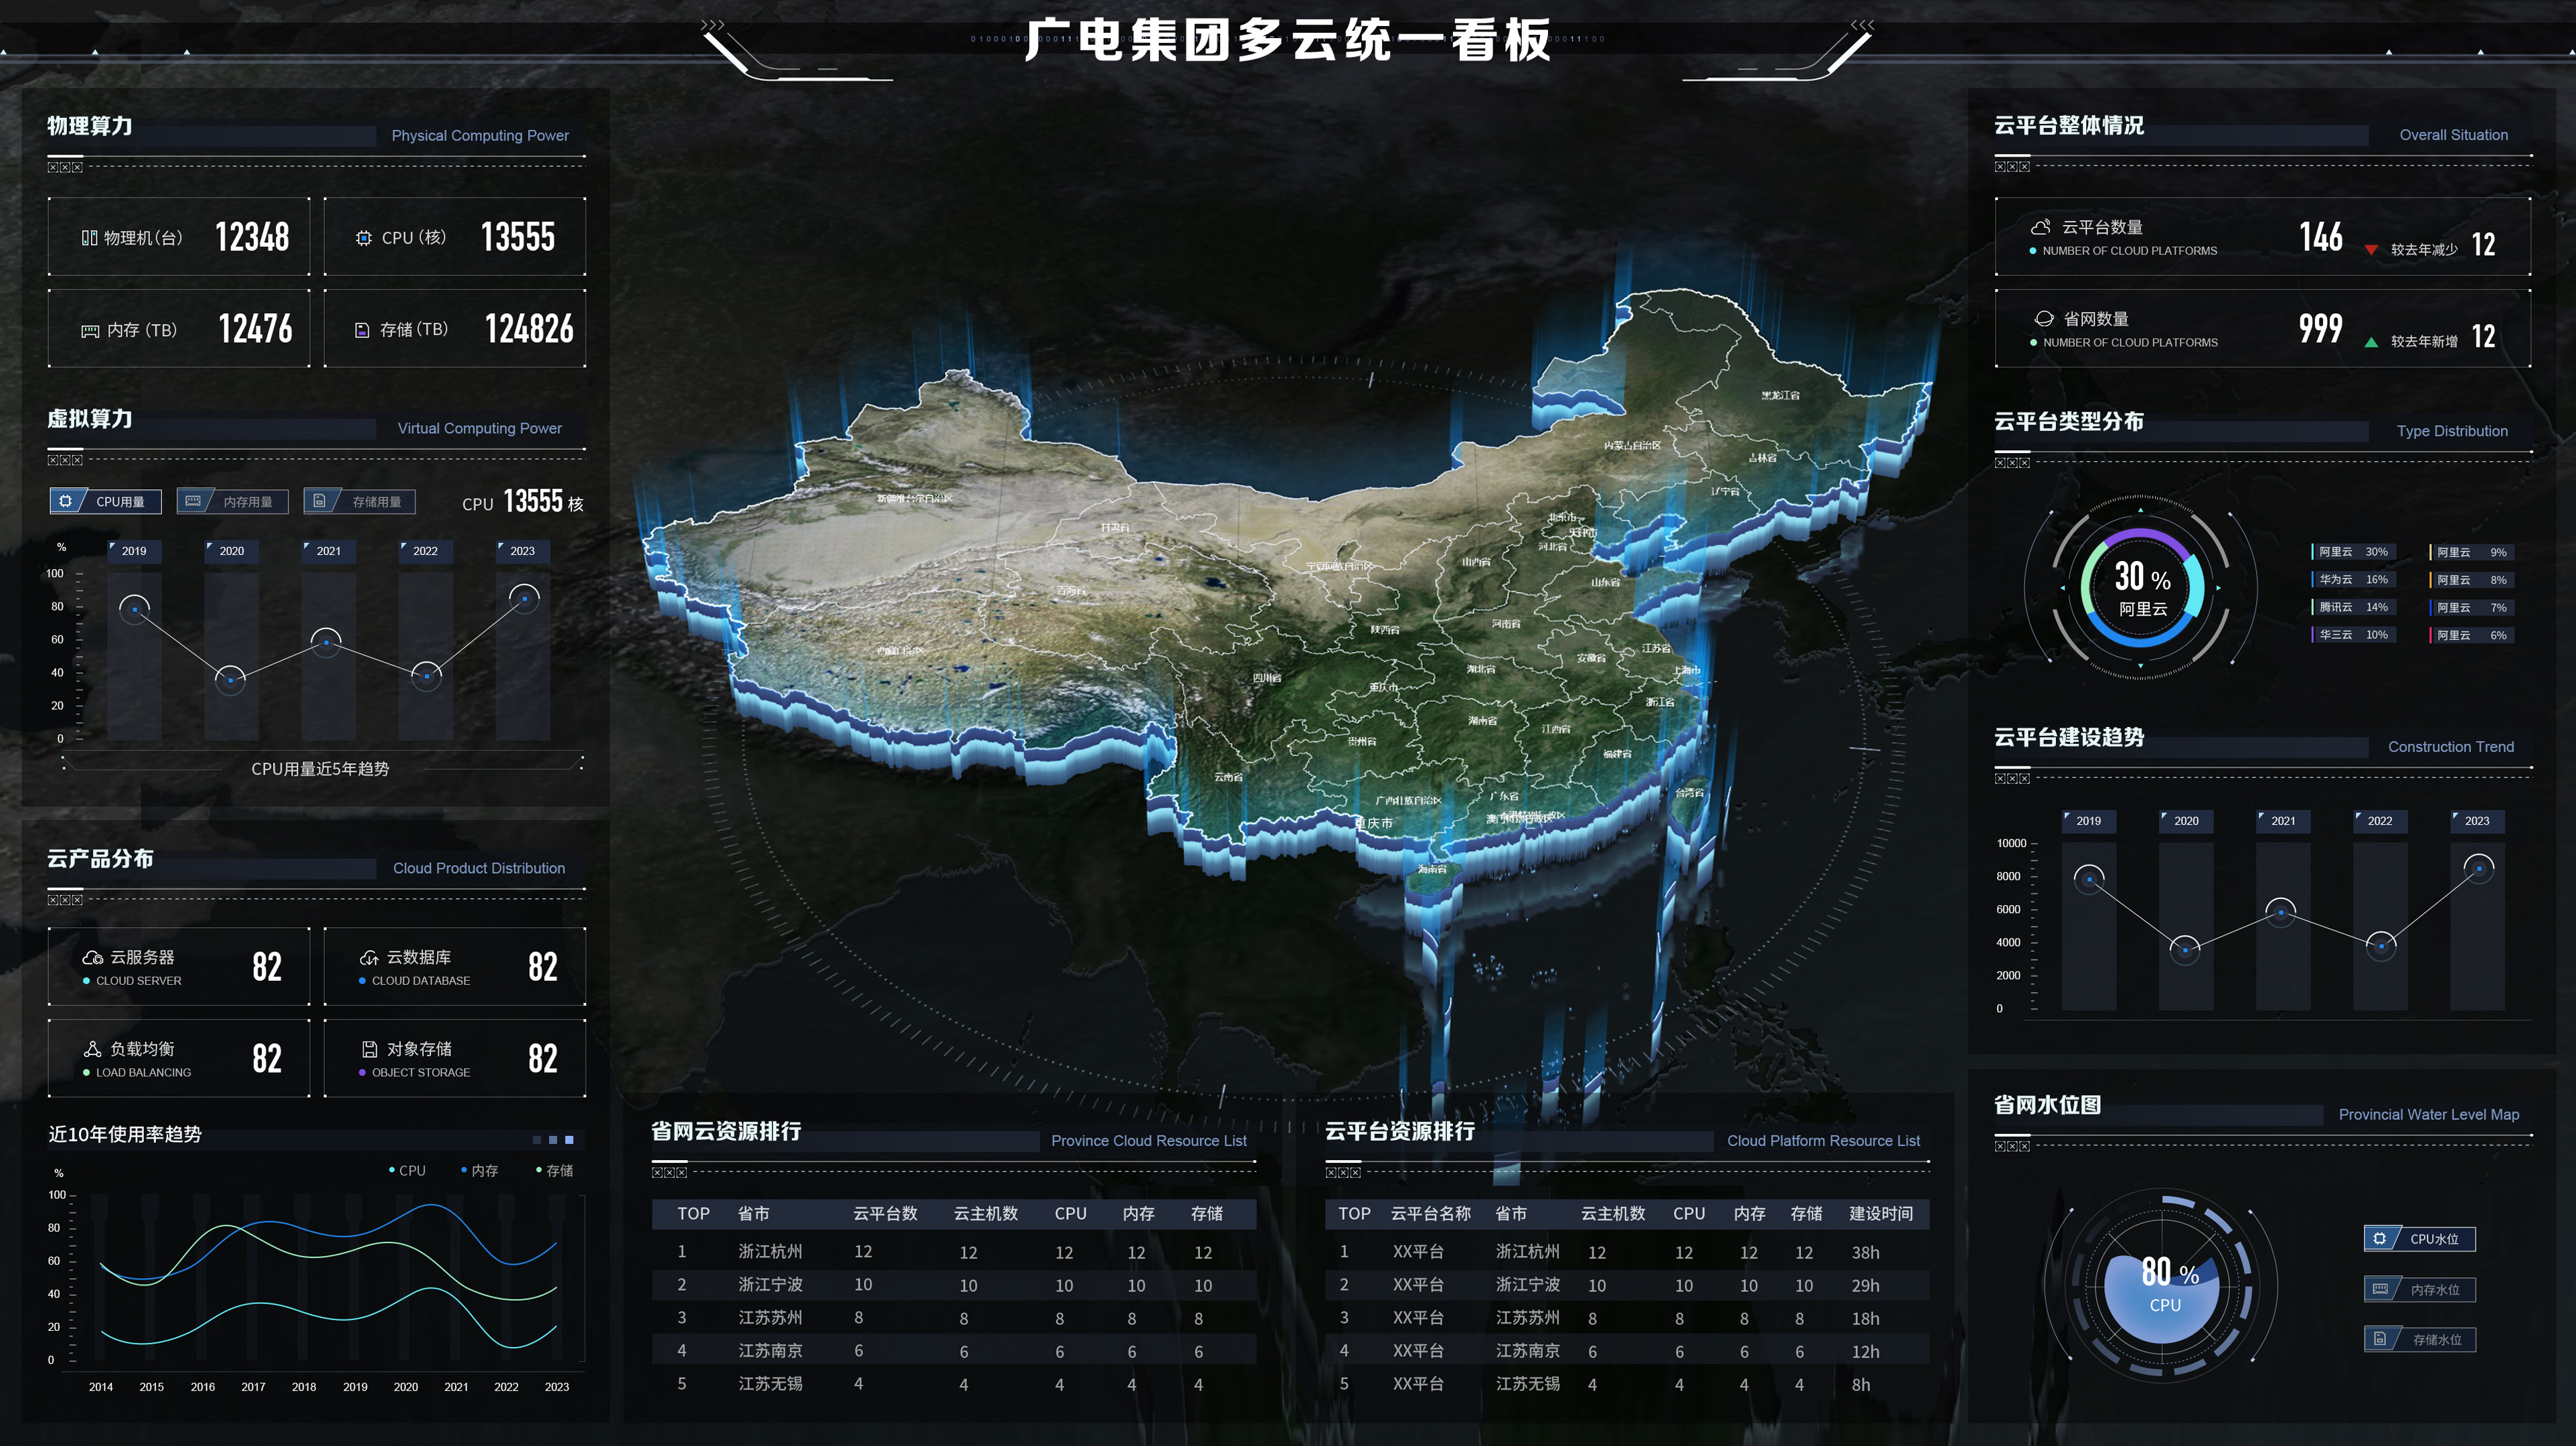
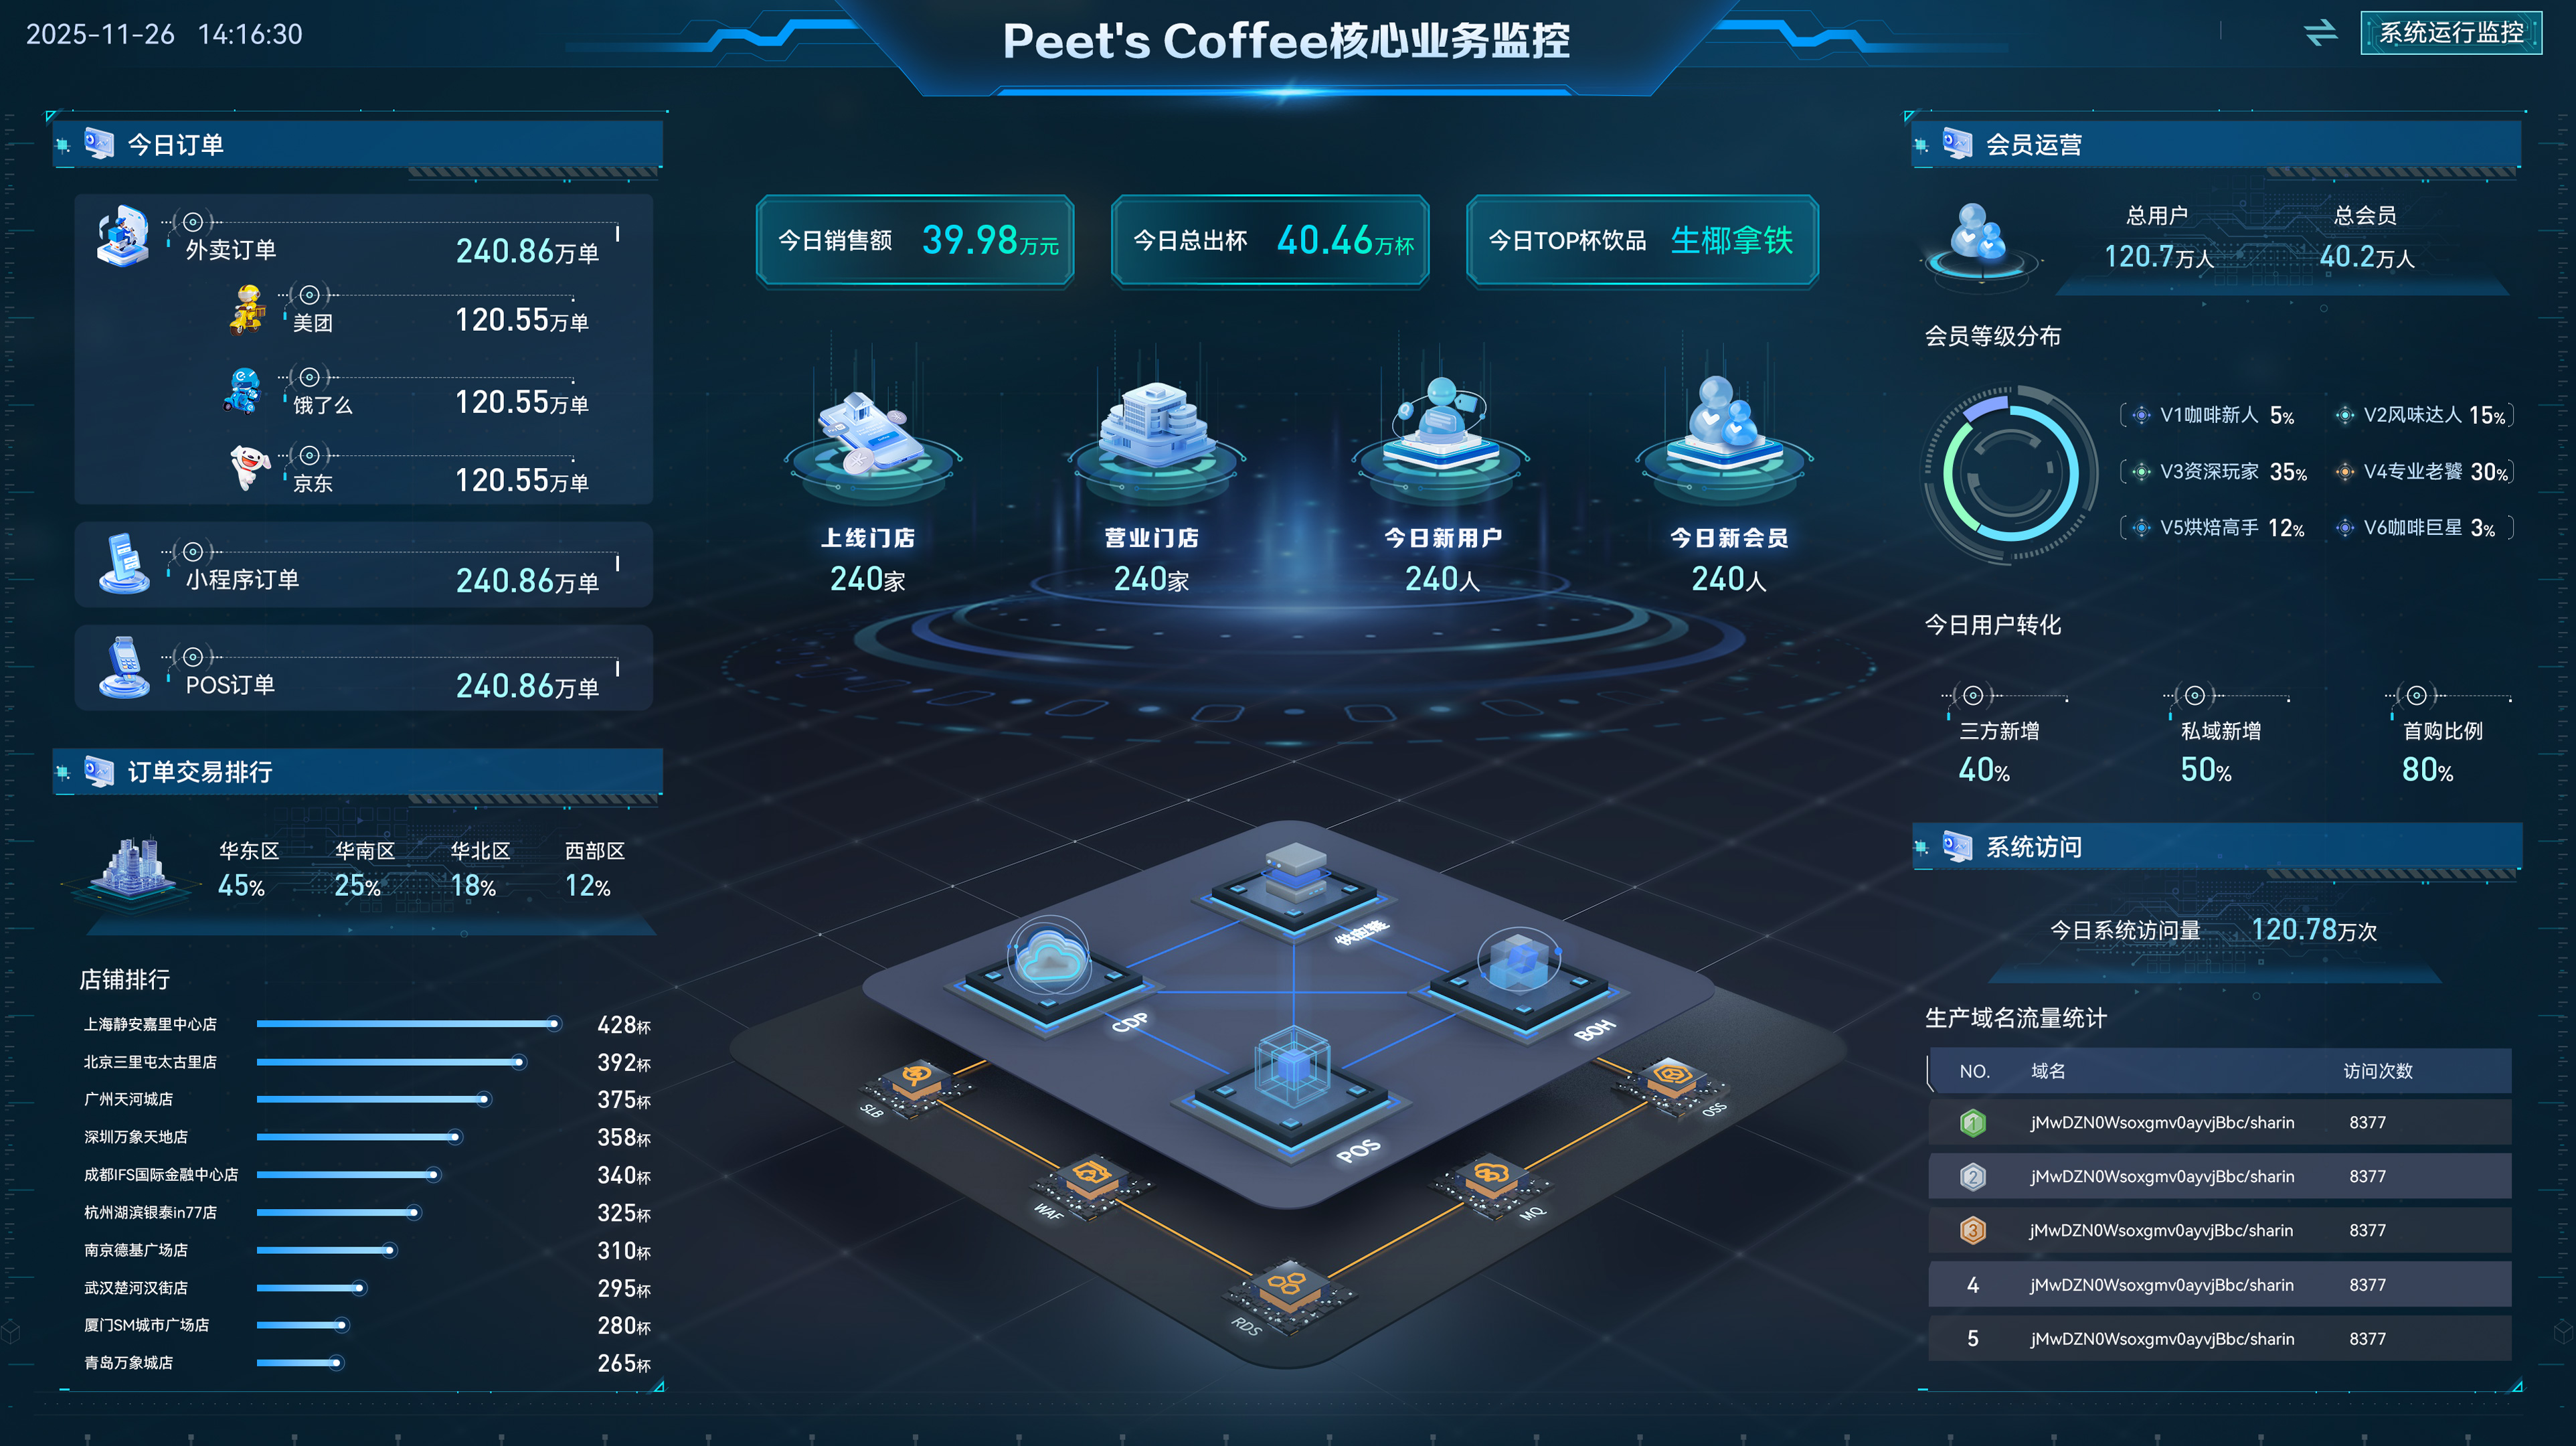
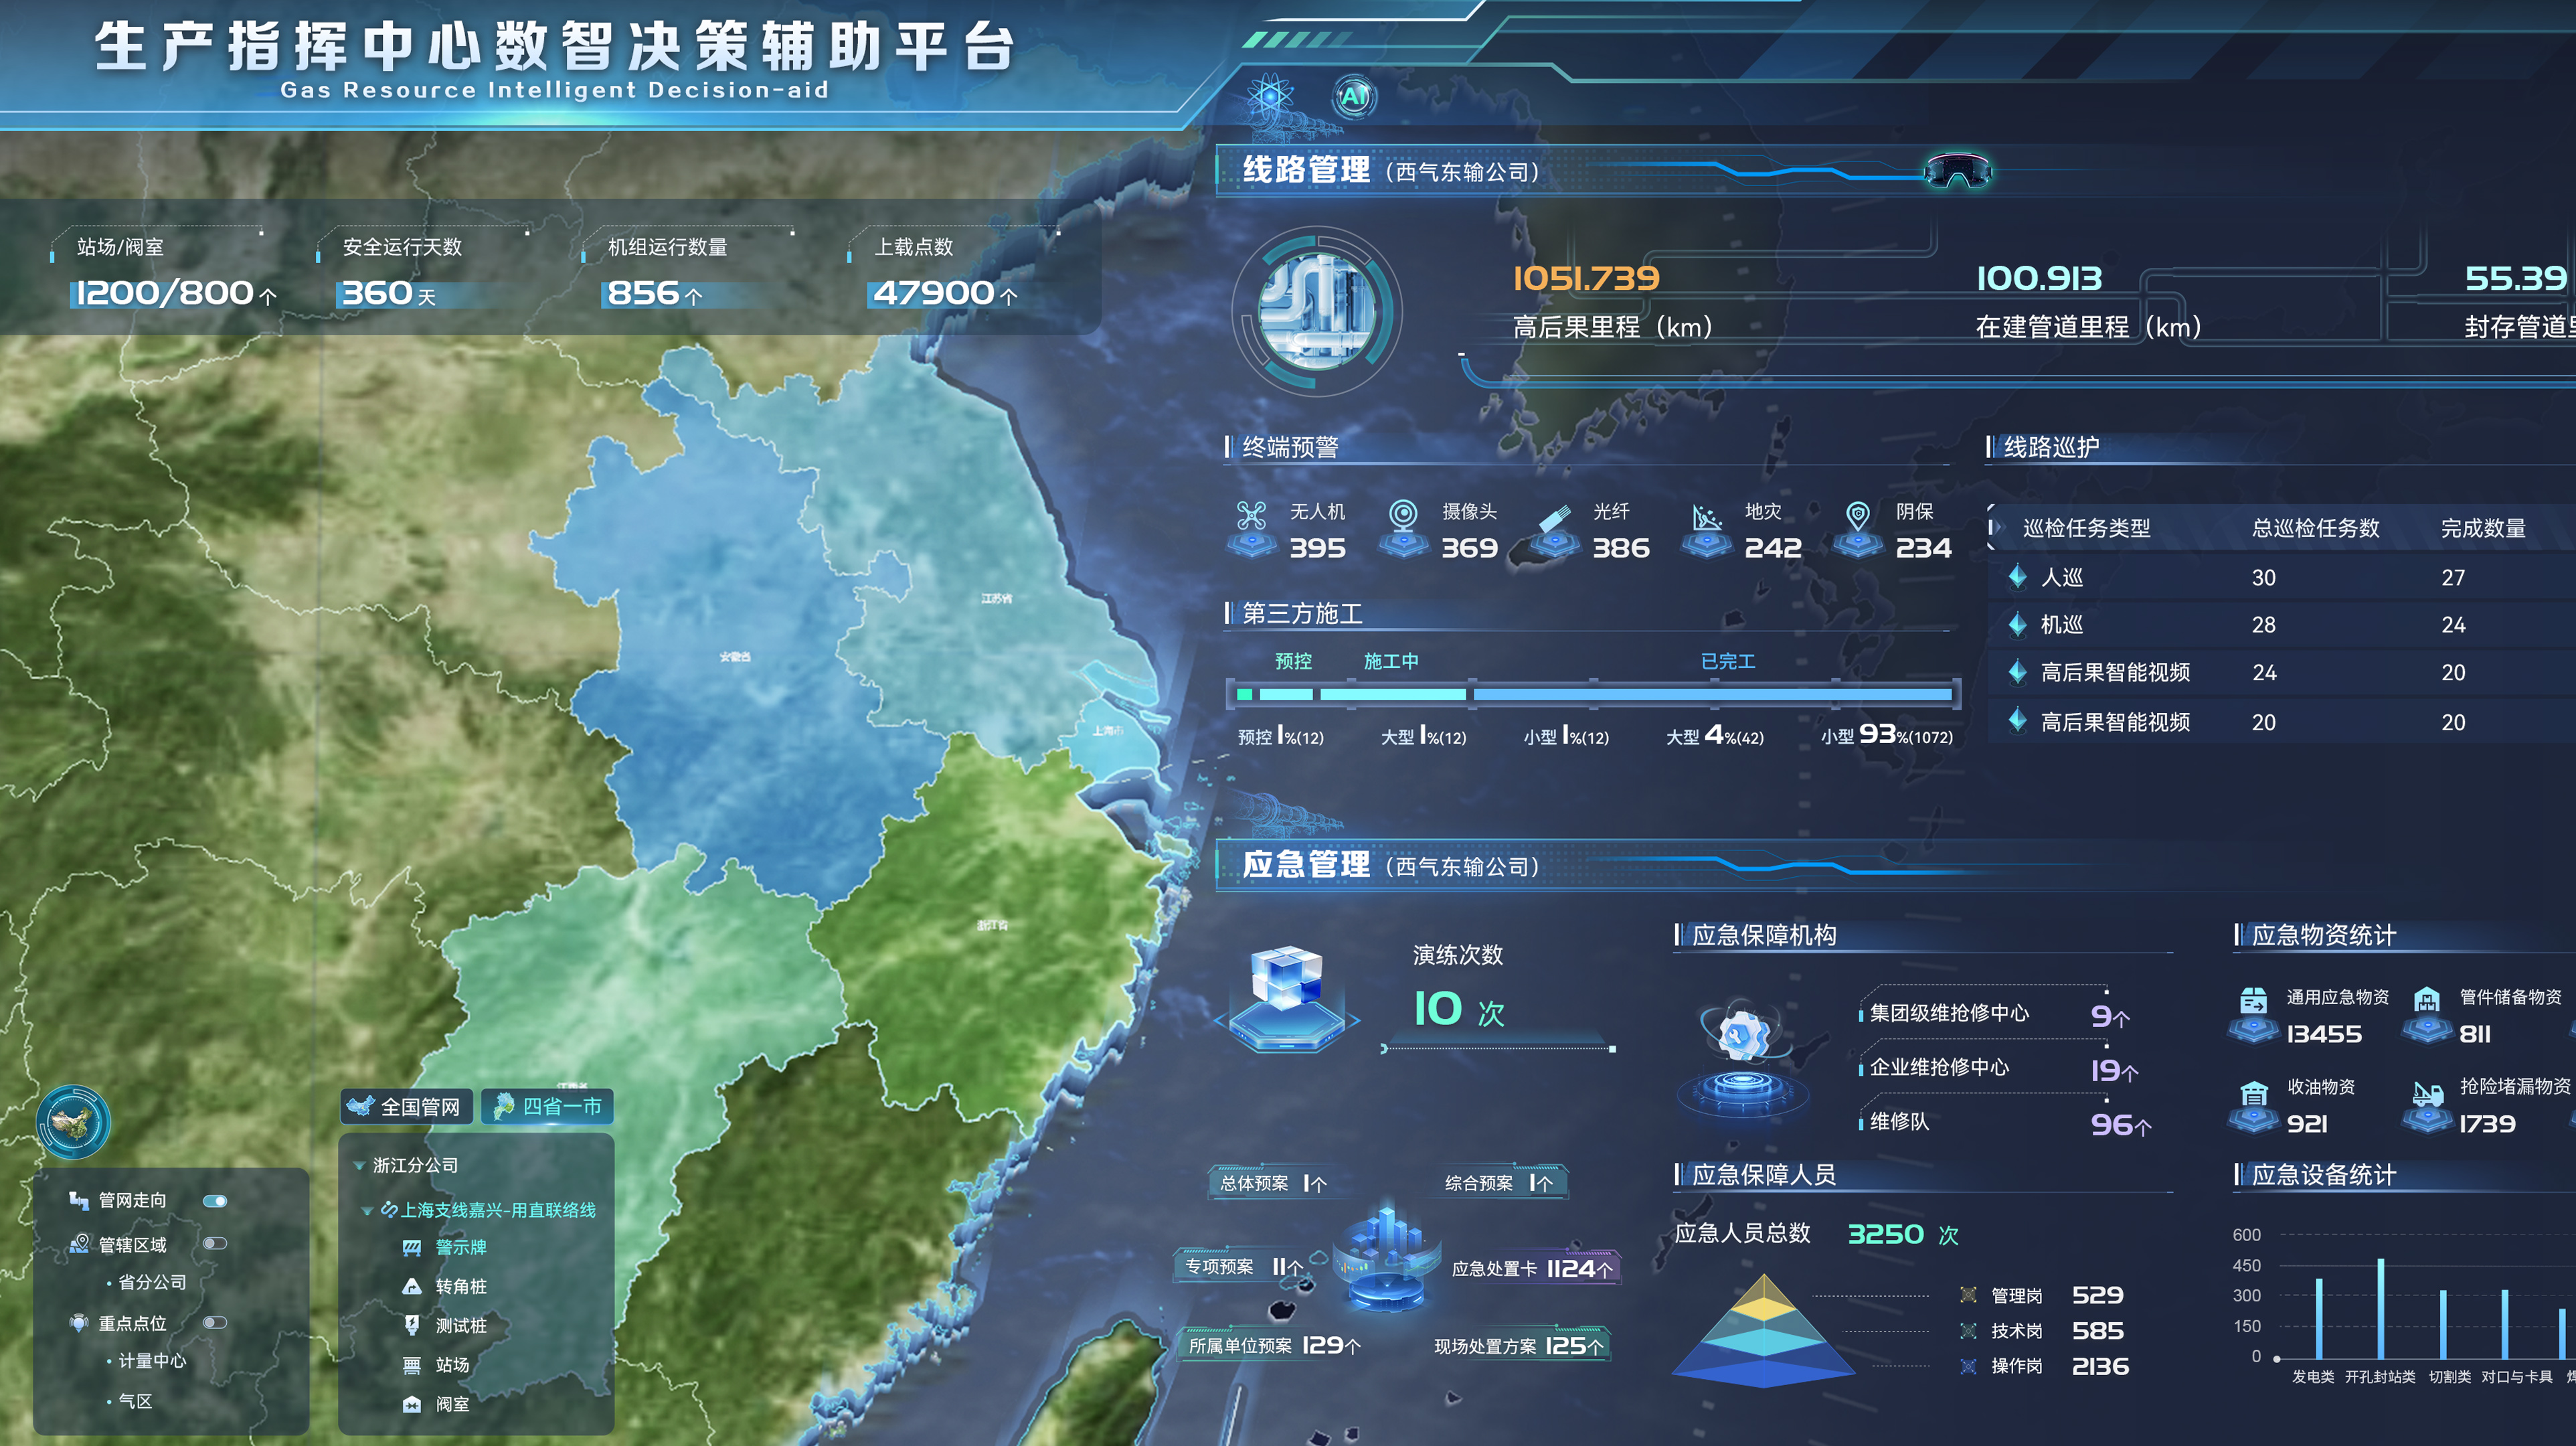
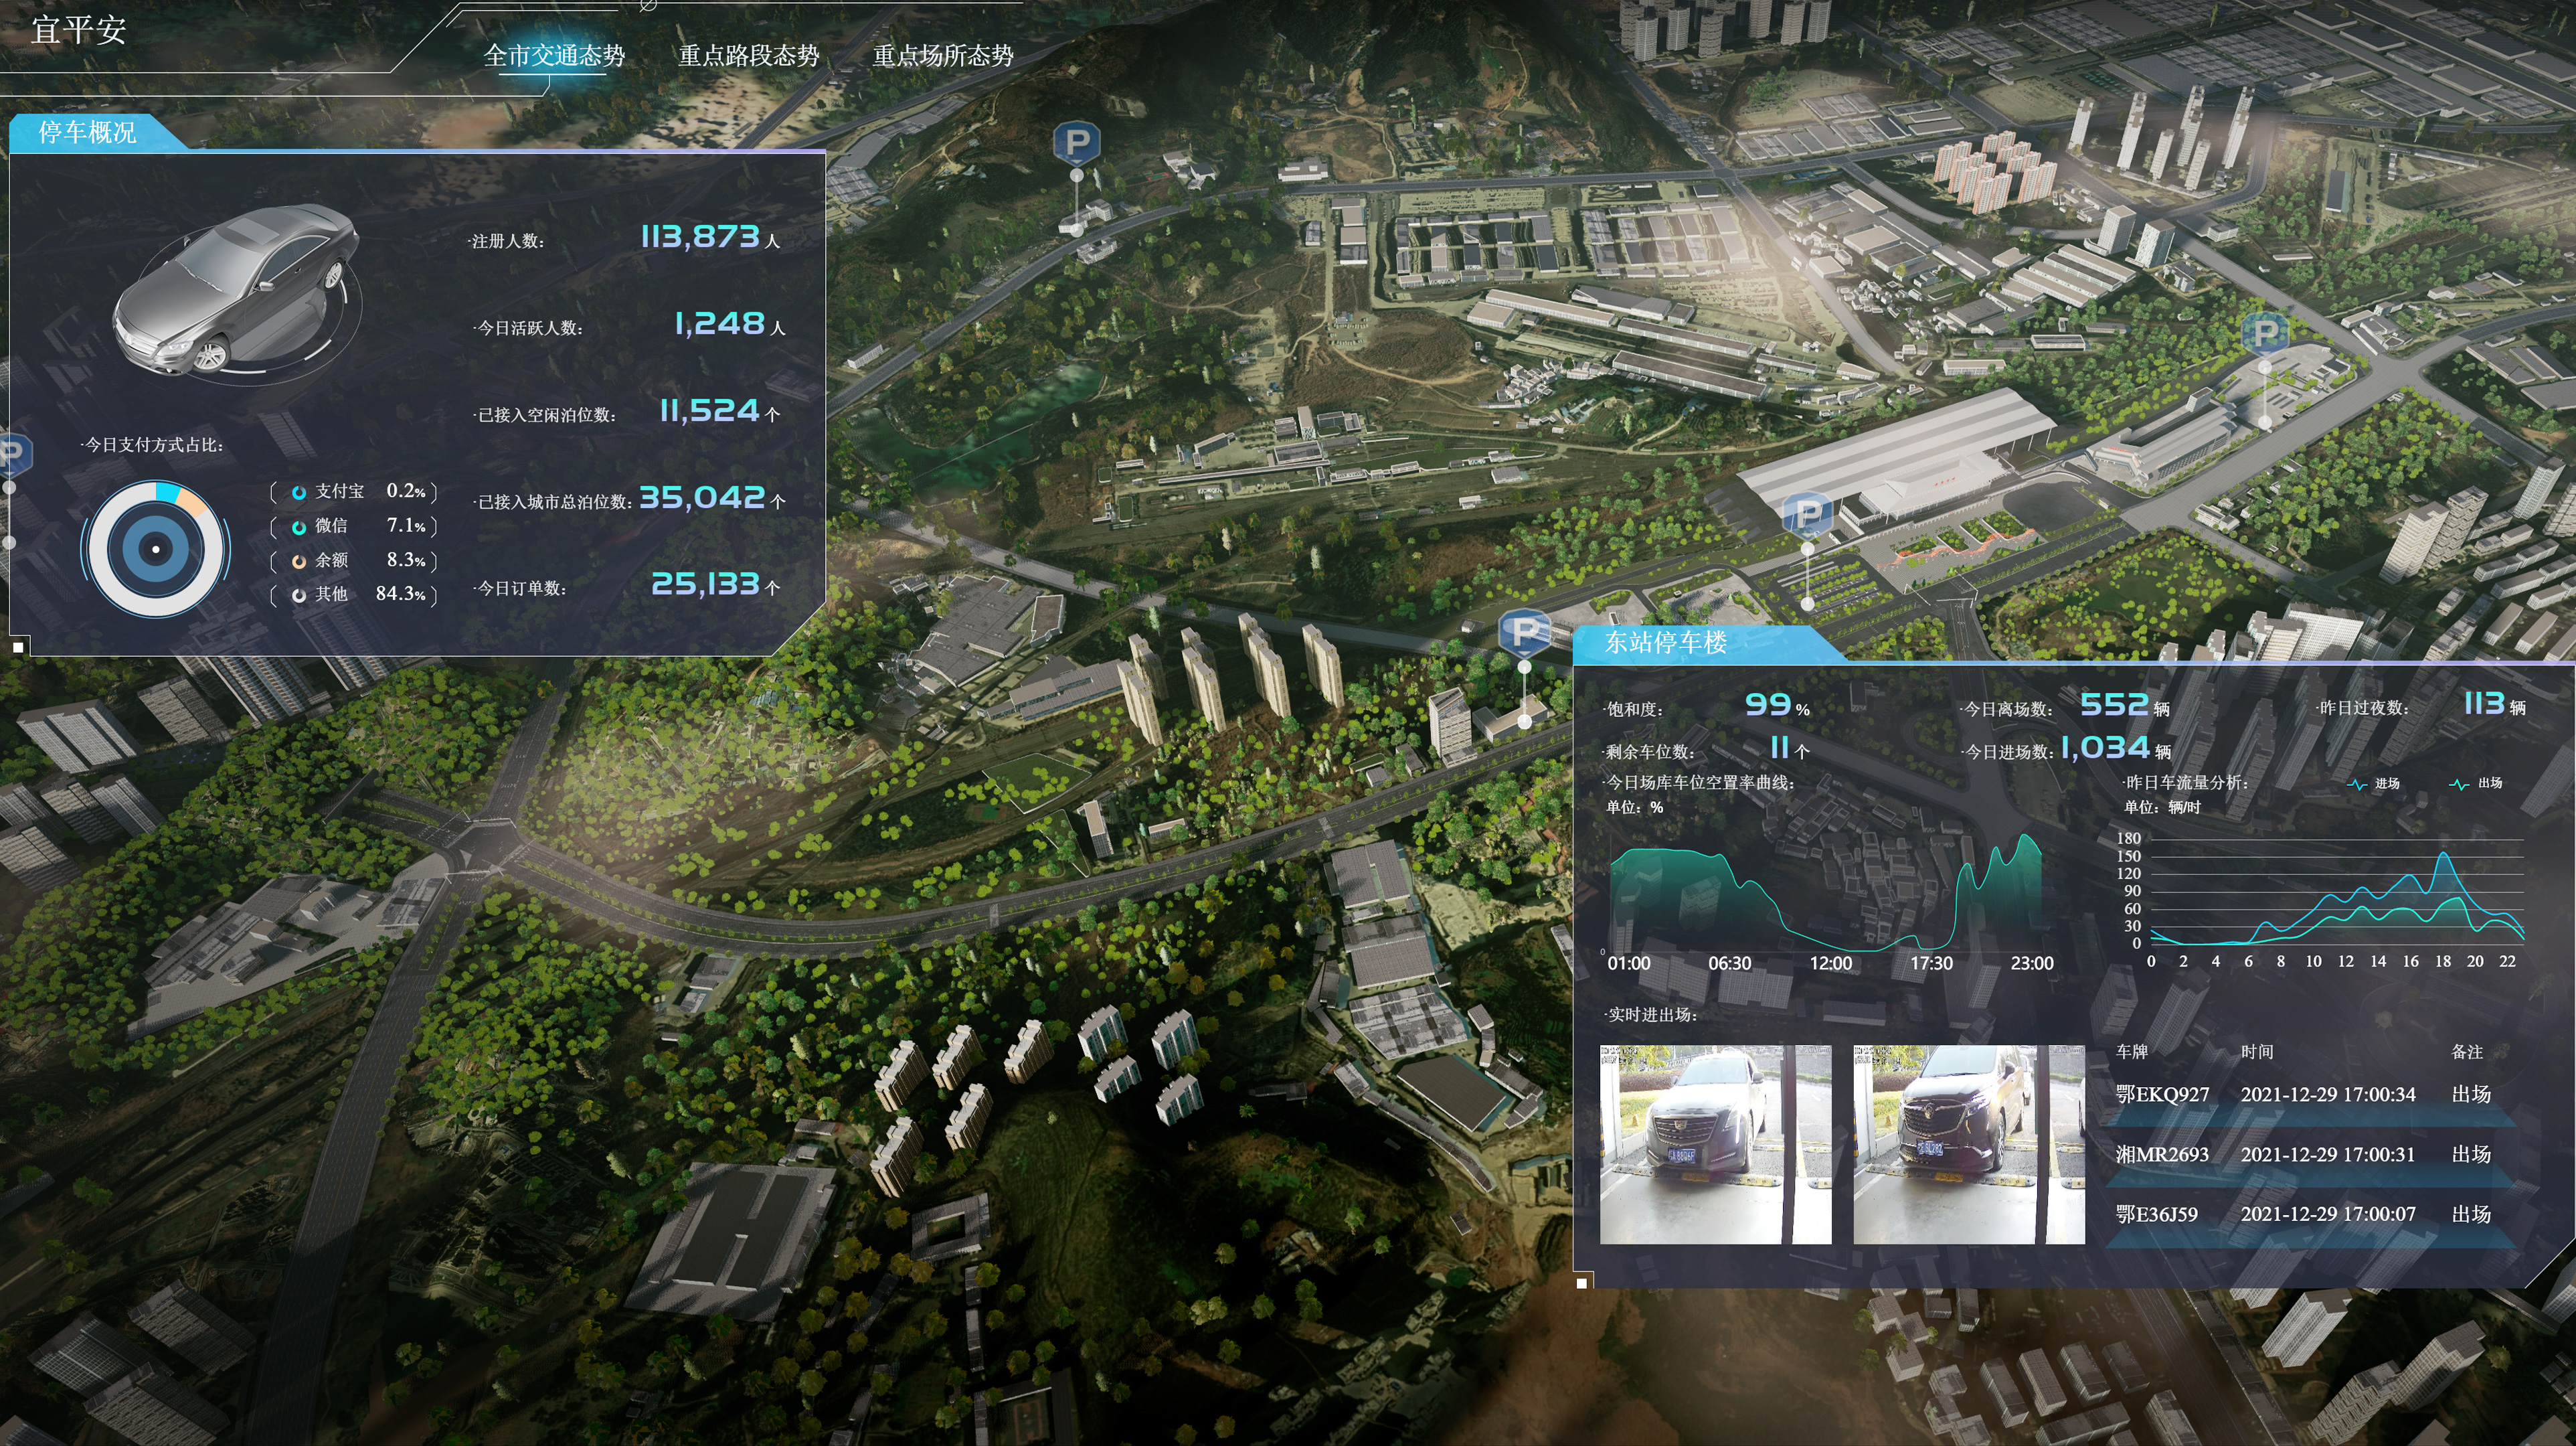
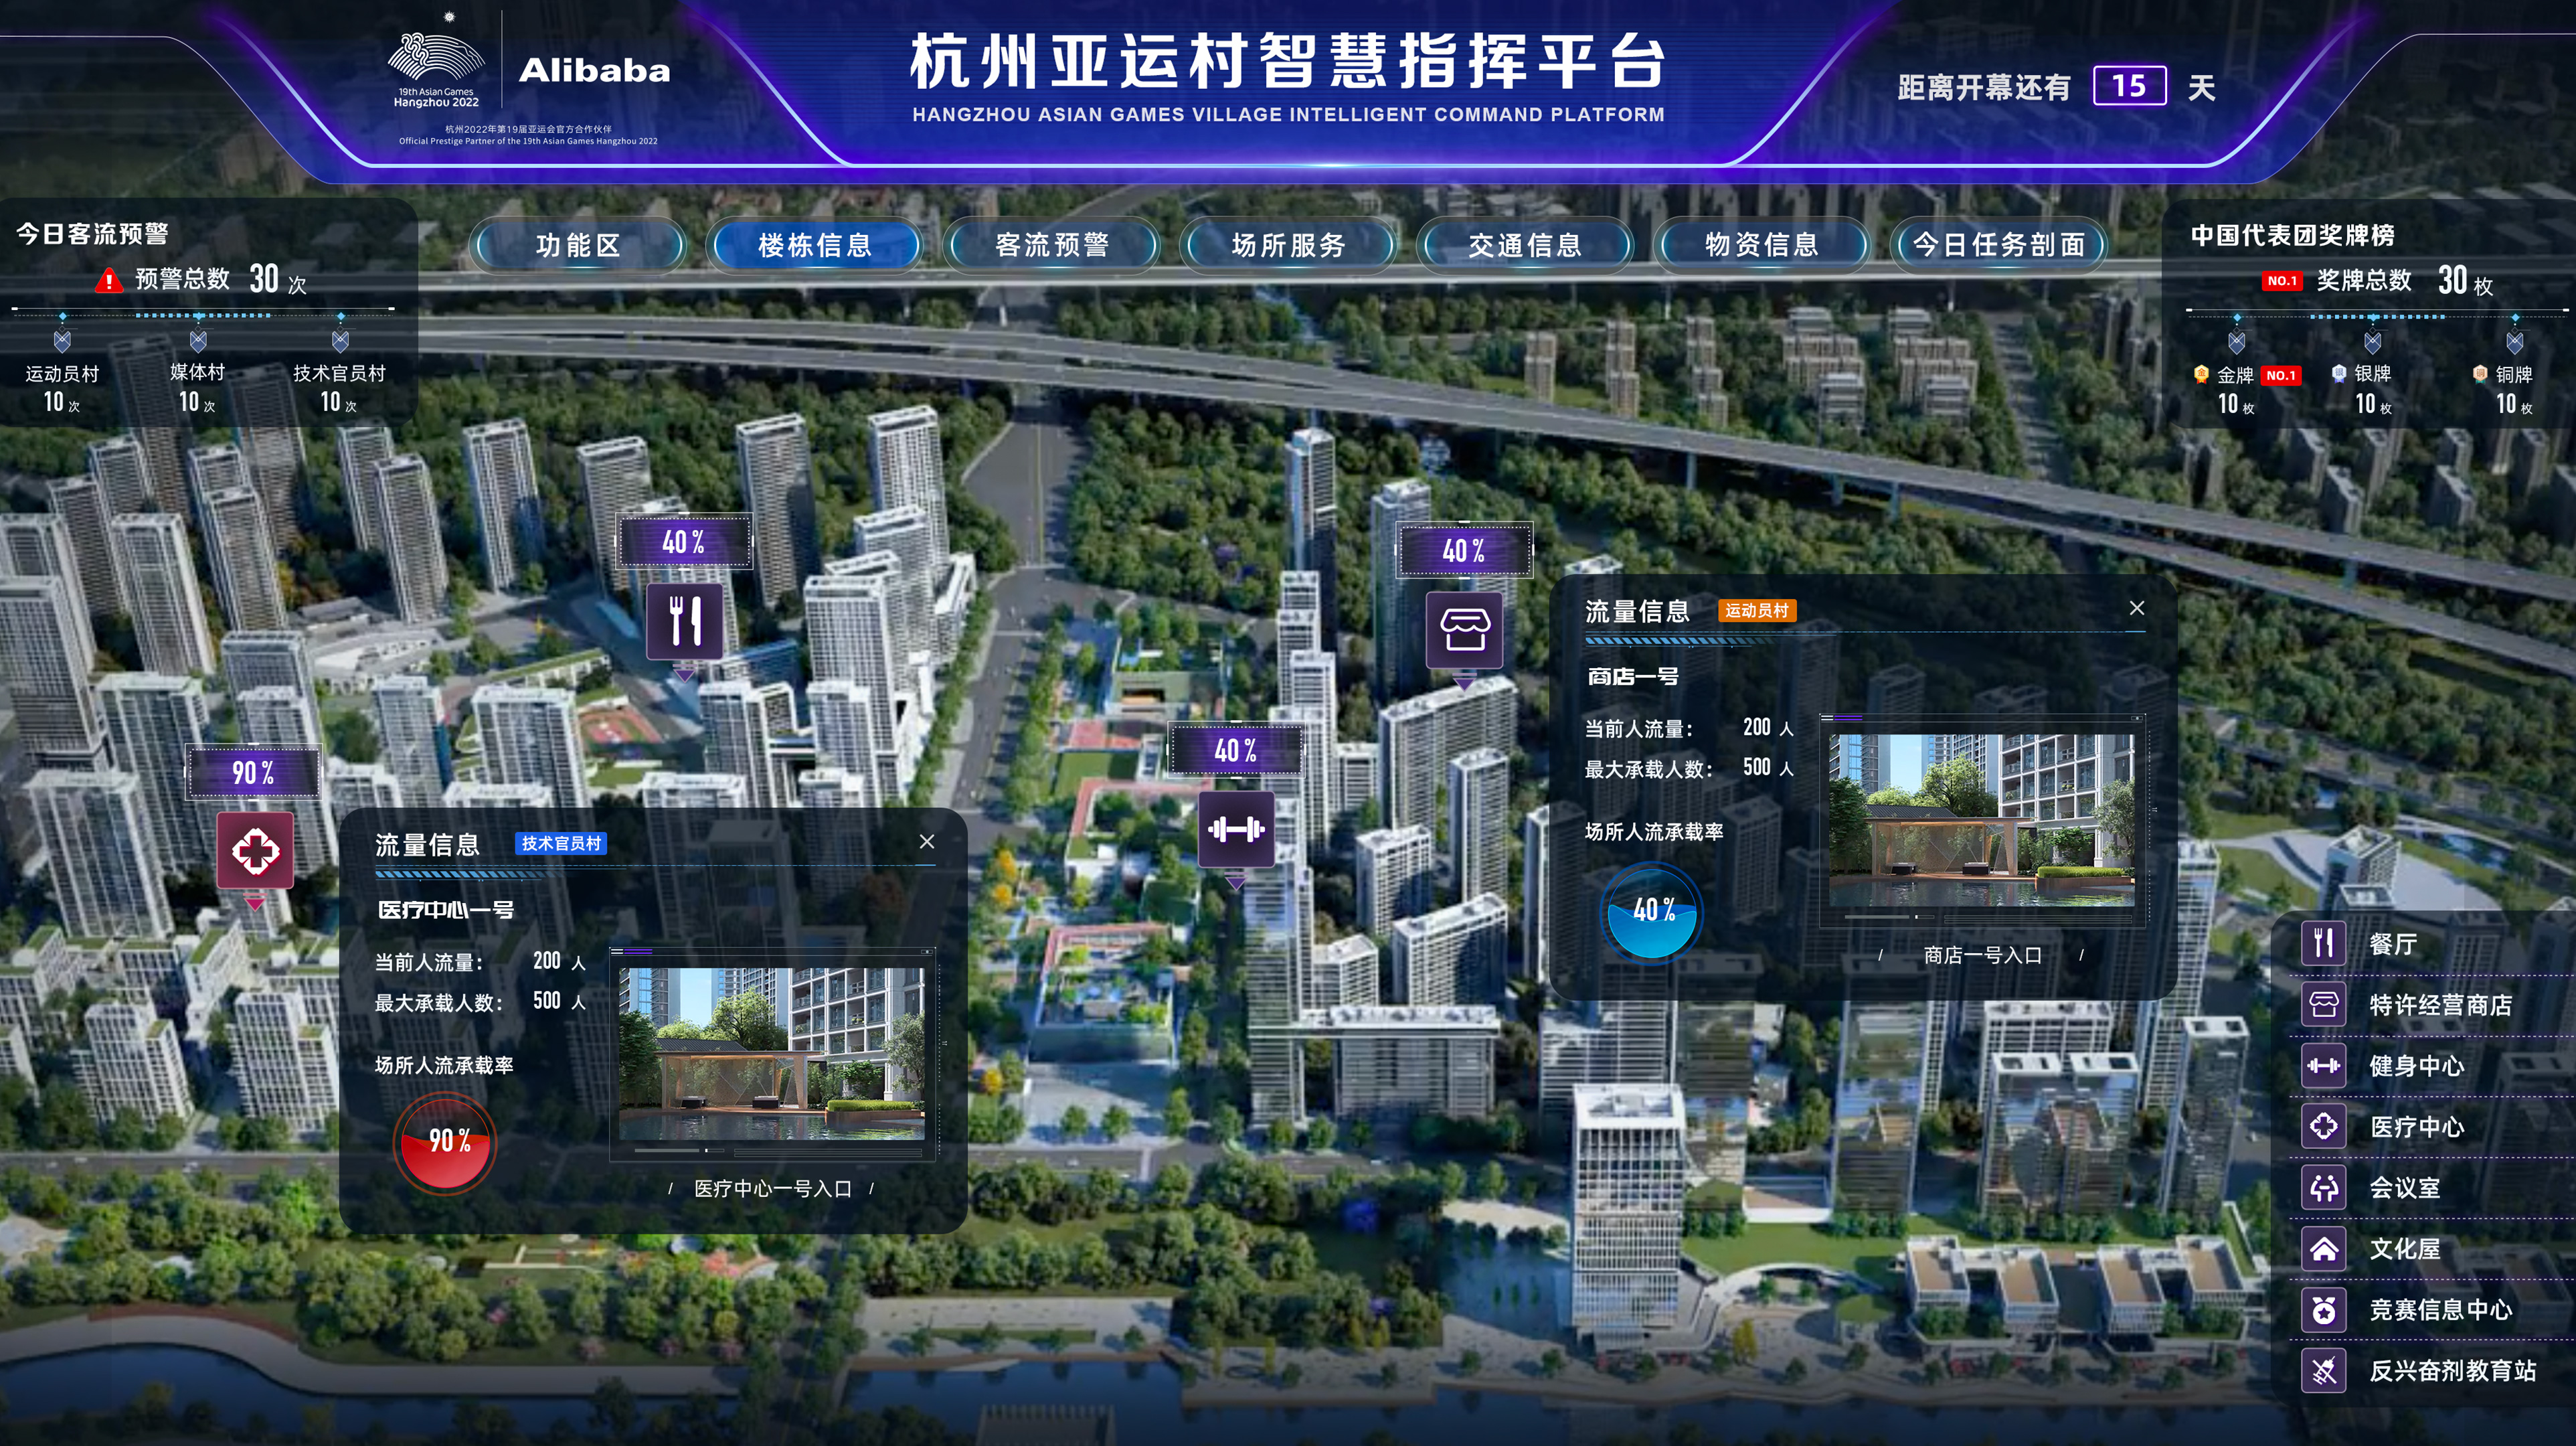
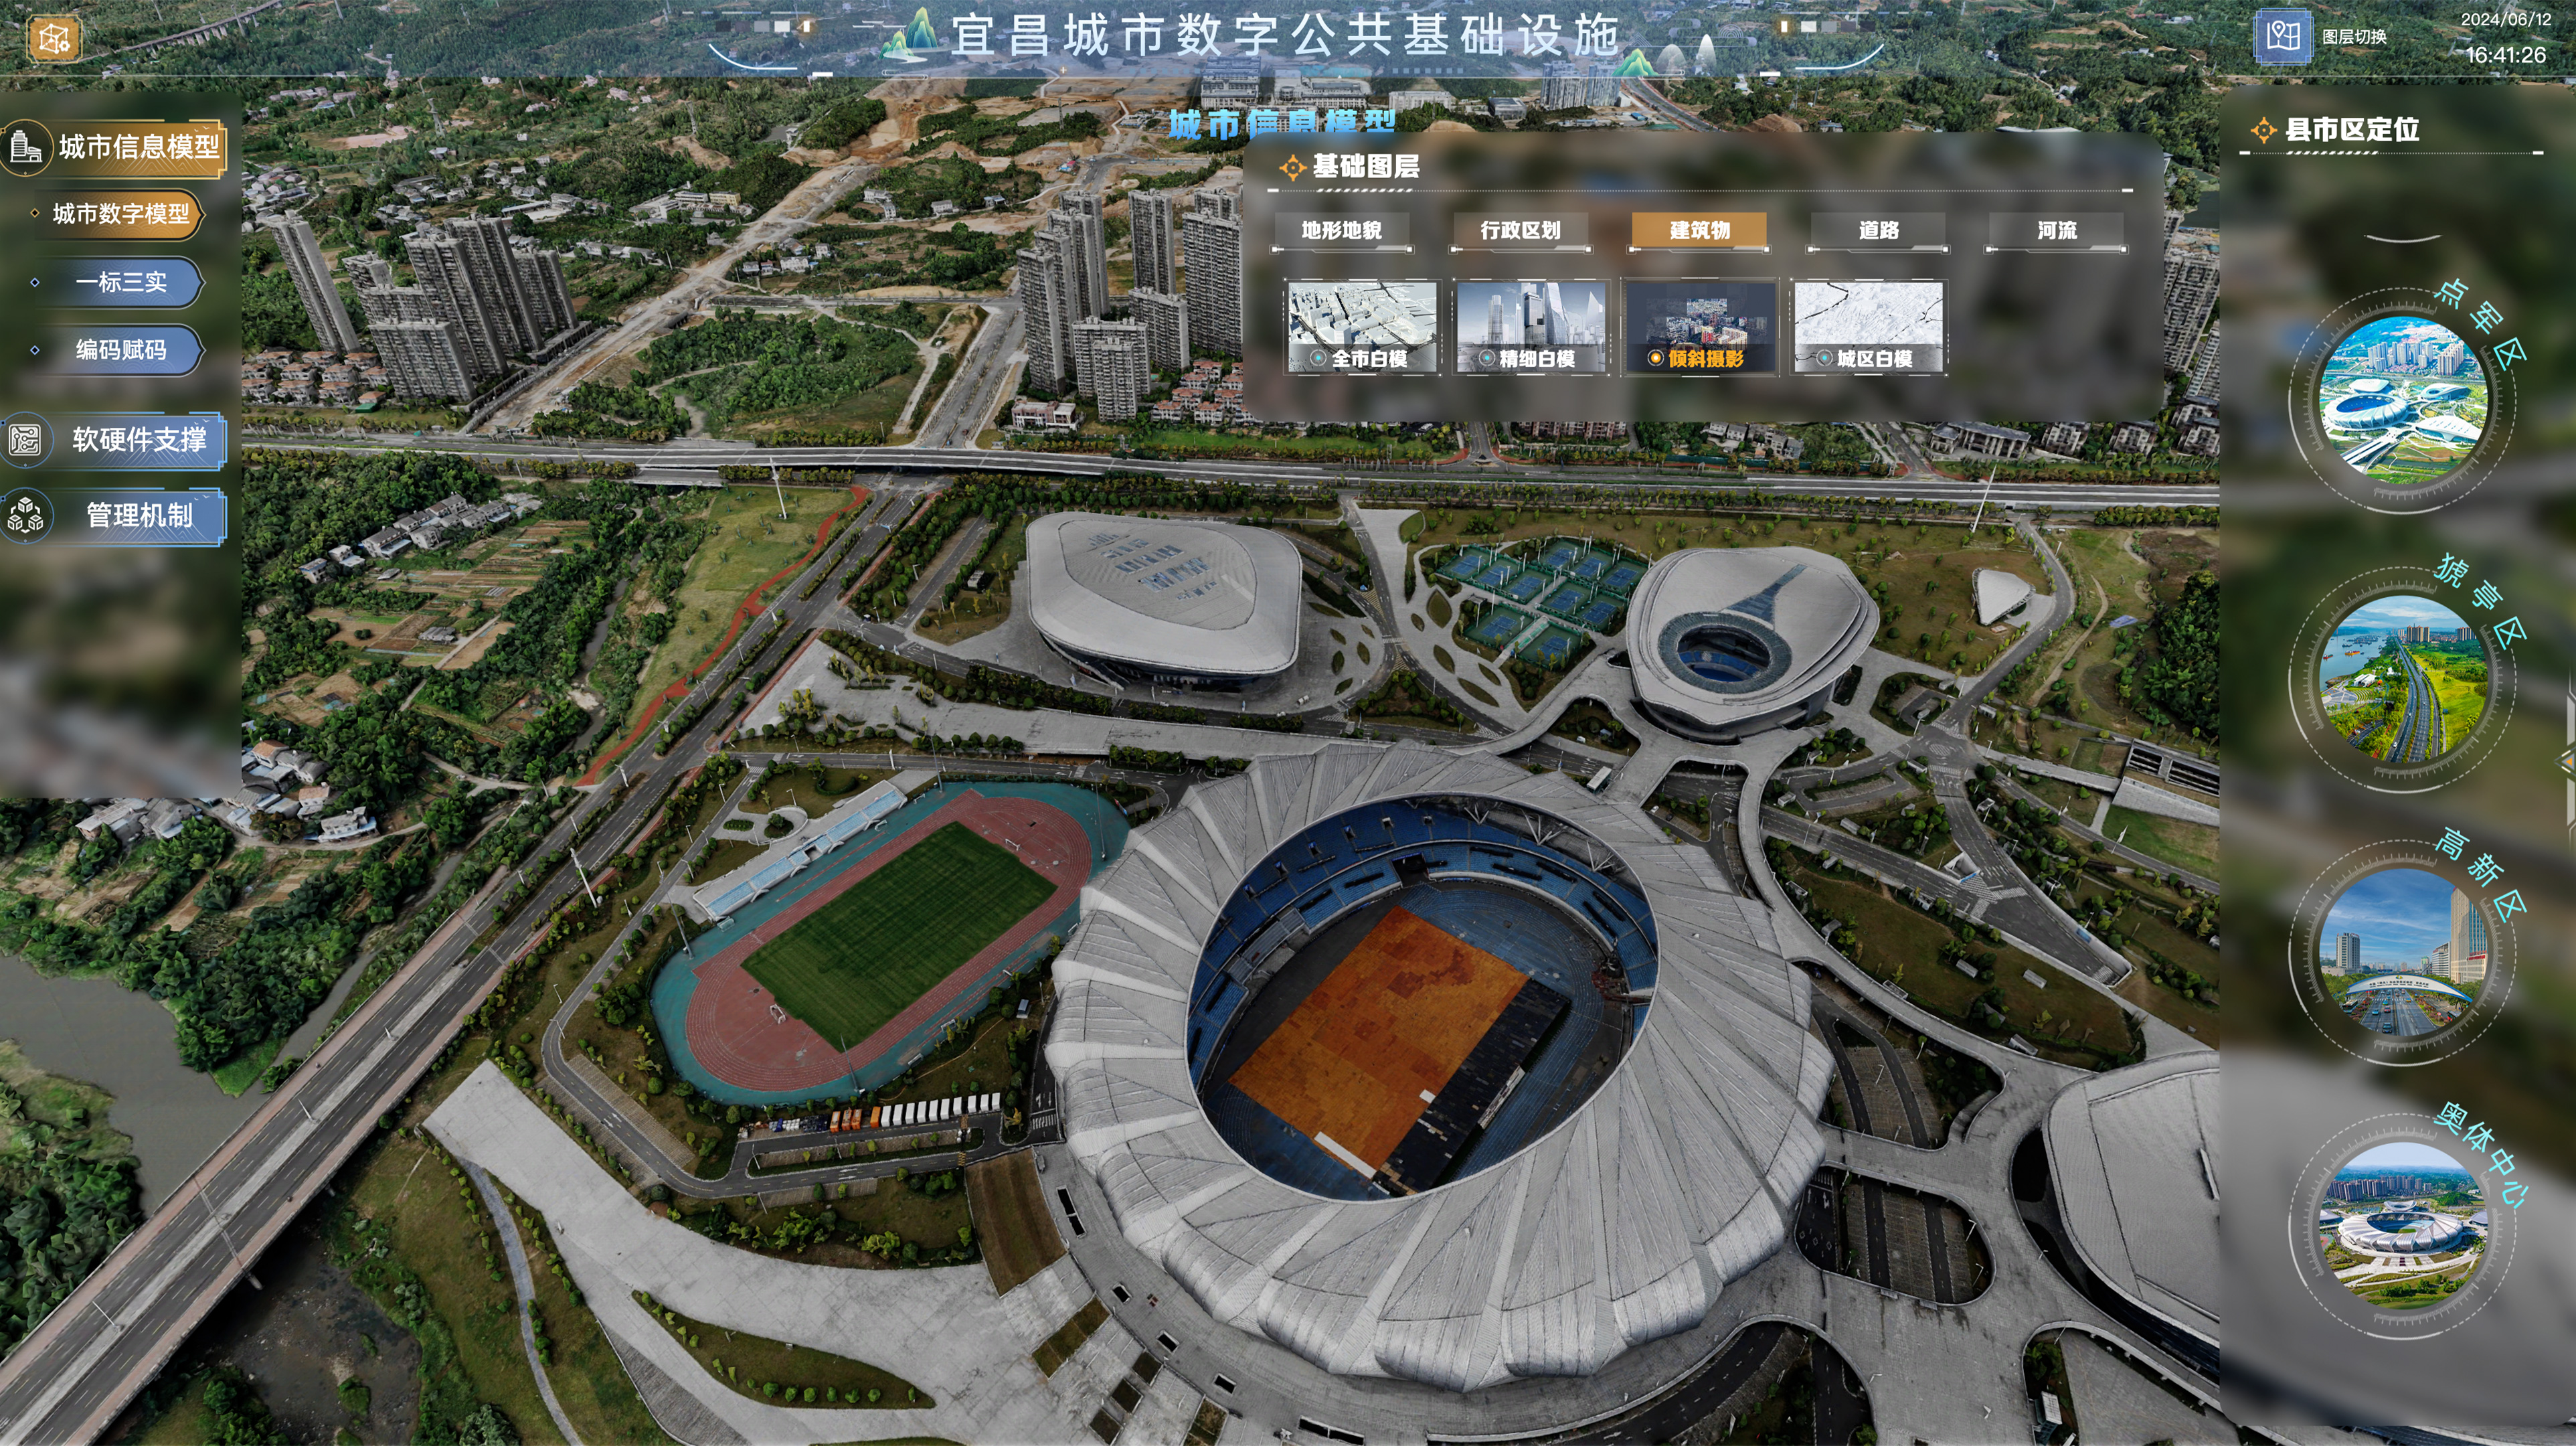
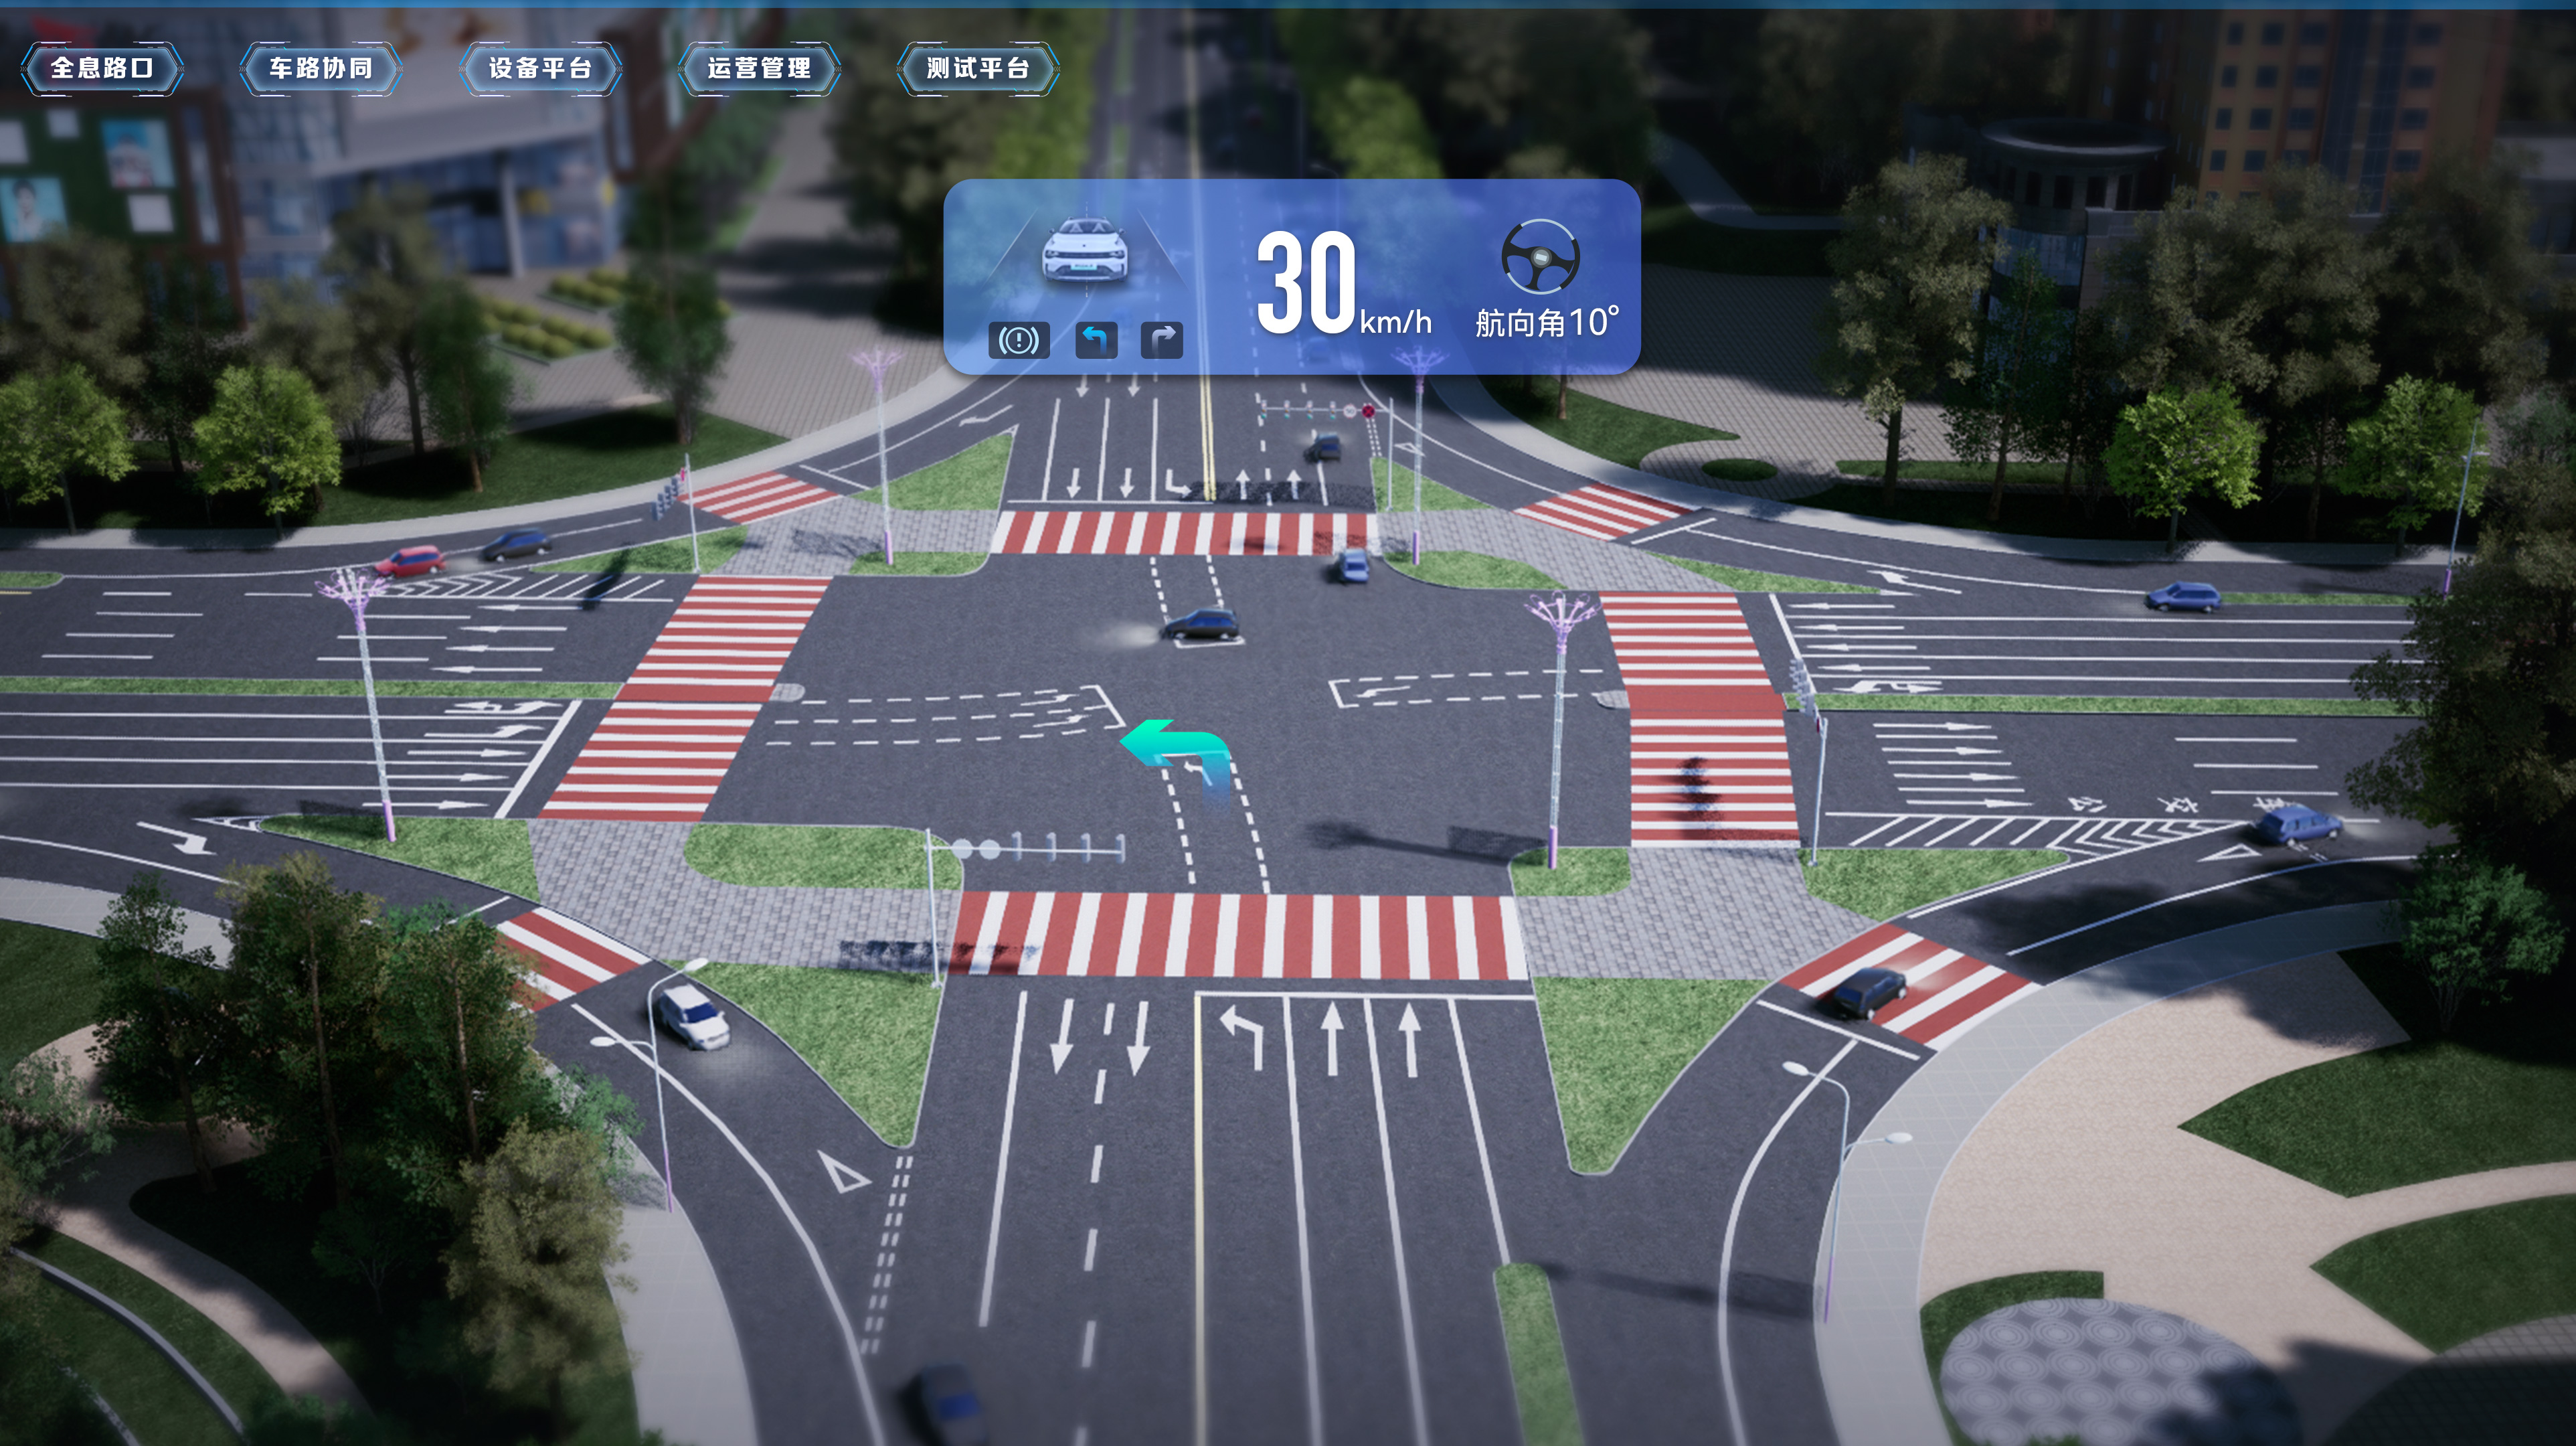
The data visualization dashboard should not just display charts on the screen, but should connect business status, system health, resource relationships, and exception responses into actionable real-time views. Guance data visualization dashboard solution is based on a full-stack observable data foundation, aggregating metrics, logs, links, RUM, infrastructure, IoT, alerts, and business data into a unified context, helping teams build monitoring dashboards, business dashboards, management cockpits, and digital twin dashboards.
Data sources are scattered and inconsistent in caliber:
Business metrics, system metrics, logs, alarms, and on-site data are distributed across different platforms, requiring a large number of manual tables and cleaning in front of a large screen.
Large screens can only display, not troubleshoot:
Many visualizations only show trend changes but cannot further explore the context of services, logs, links, resources, and alerts.
Business and Technology Perspective Gap:
Management focuses on revenue, efficiency, and risk, while technical teams focus on errors, latency, and resource levels; both types of data lack a unified interpretive framework.
Digital twins lack real-time data support:
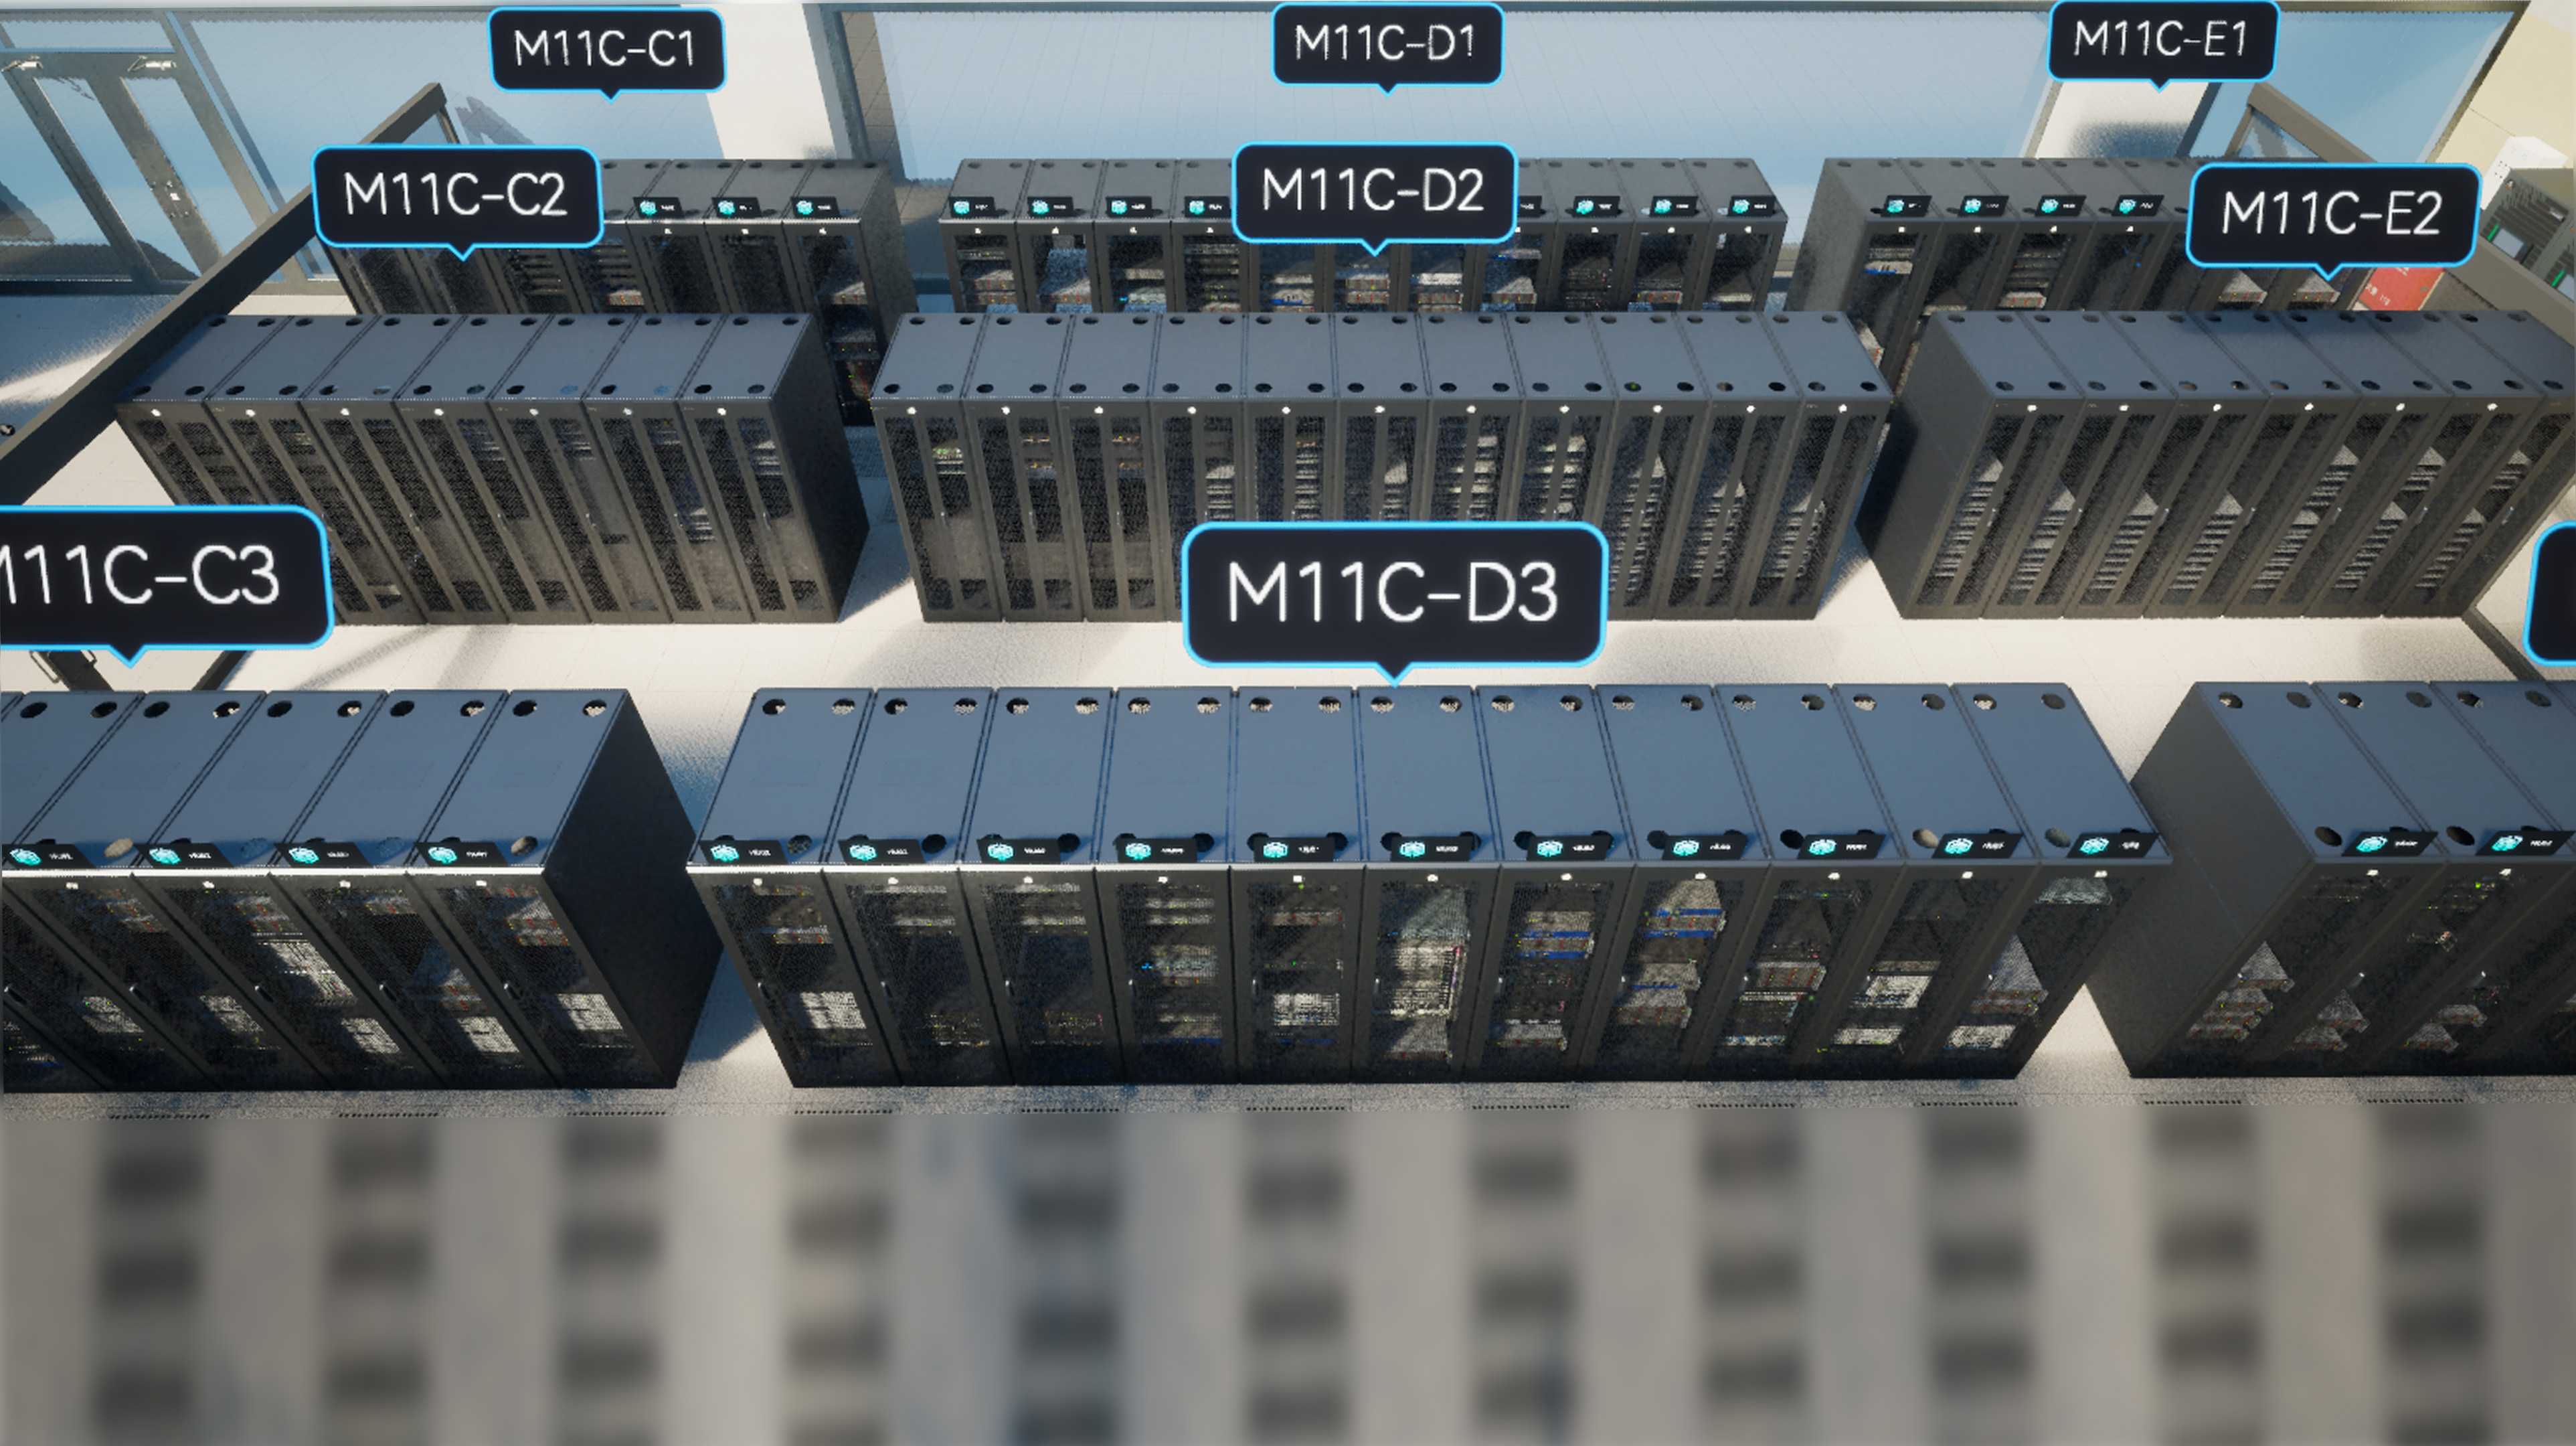
If 3D scenes cannot connect to devices, space, alarms, and system operating status, it is difficult to reflect the real business scene.
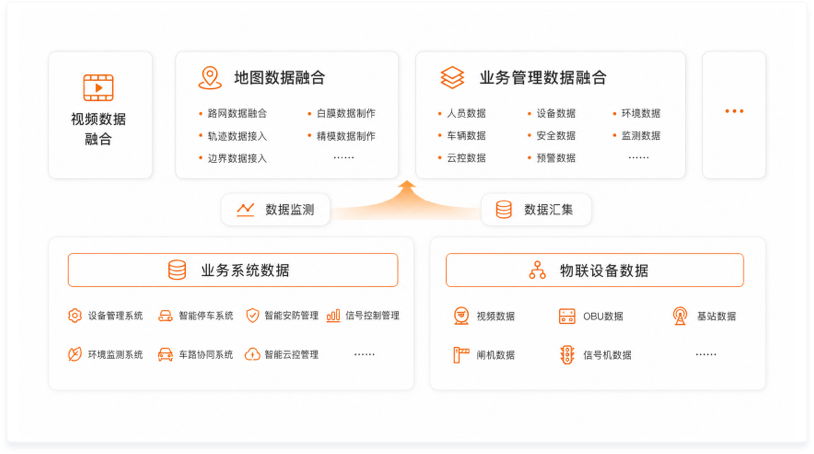
Unified access to full-stack observable data:
Integrate applications, logs, infrastructure, networks, IoT, alert events, and business metrics into a single data foundation, reducing cross-system data collection.
Turn the big screen into a crawl-in entrance:
From the monitoring dashboard, you can continue to see abnormal indicators in Trace, Logs, Host, Pod, Network, and Alarm Details, supporting quick cause localization.
Build the business cockpit by role:
Configuring different perspectives for management, business teams, SREs, R&D, and operations & maintenance, allowing the same data to serve different decision-making scenarios.
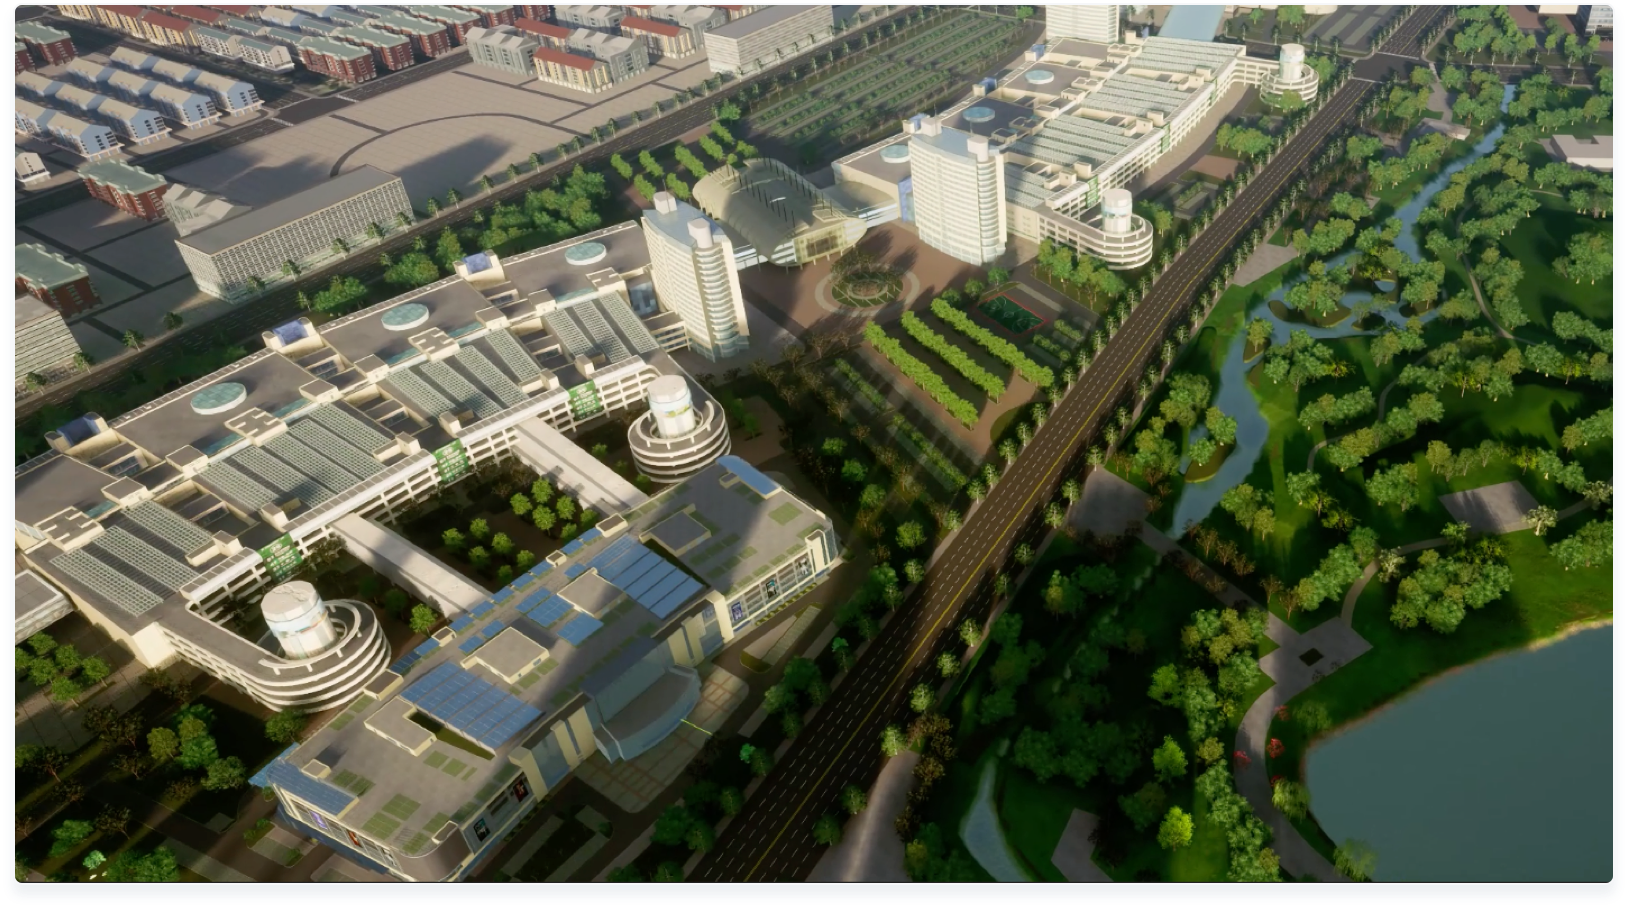
Supporting digital twins and on-site situation:
Access spatial models, device status, location relationships, and business events to keep 3D scenes and real-time monitoring data synchronized.


Frequently asked questions
Ideal for teams that need to centrally display business metrics, application performance, infrastructure, IoT, logs, and alert events, for real-time situational monitoring, cockpit management, and digital twin scenarios.
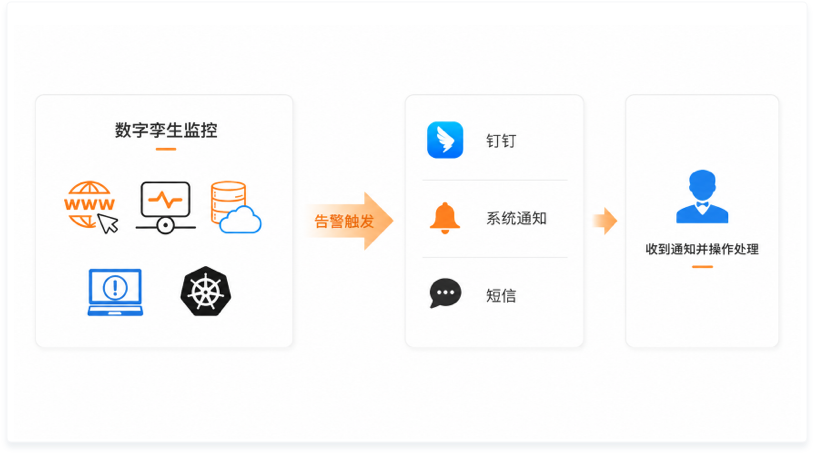
The BI dashboard focuses on business analysis and historical statistics, while the monitoring dashboard emphasizes real-time performance, alarm linkage, system context, and exception handling, directly connecting to the troubleshooting process.
It is usually necessary to integrate spatial models, device status, business metrics, infrastructure, logs, alarm events, and location relationships to ensure that 3D scenes reflect the true operating status.
Related reading