






Phone:400-882-3320




 Get product resources
Global reach
Observe systems, applications, and digital experience across regions through Guance service nodes.

Intelligent operations

Platform capabilities

Security analytics

AI
Dedicated compute
Dedicated compute keeps concurrent queries stable and complex analysis fast.
Learn moreDedicated compute
Dedicated compute keeps concurrent queries stable and complex analysis fast.
Learn more
Trusted by teams across industries


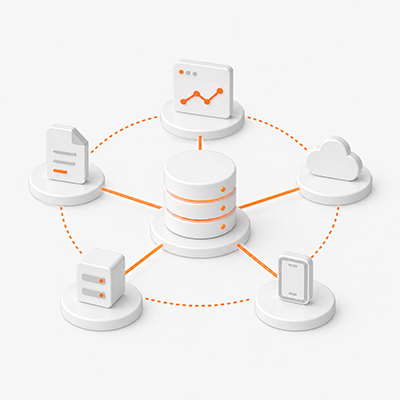
Collect, store, query, and visualize metrics, logs, traces, RUM, profiles, events, cloud resources, and business data in one workspace.

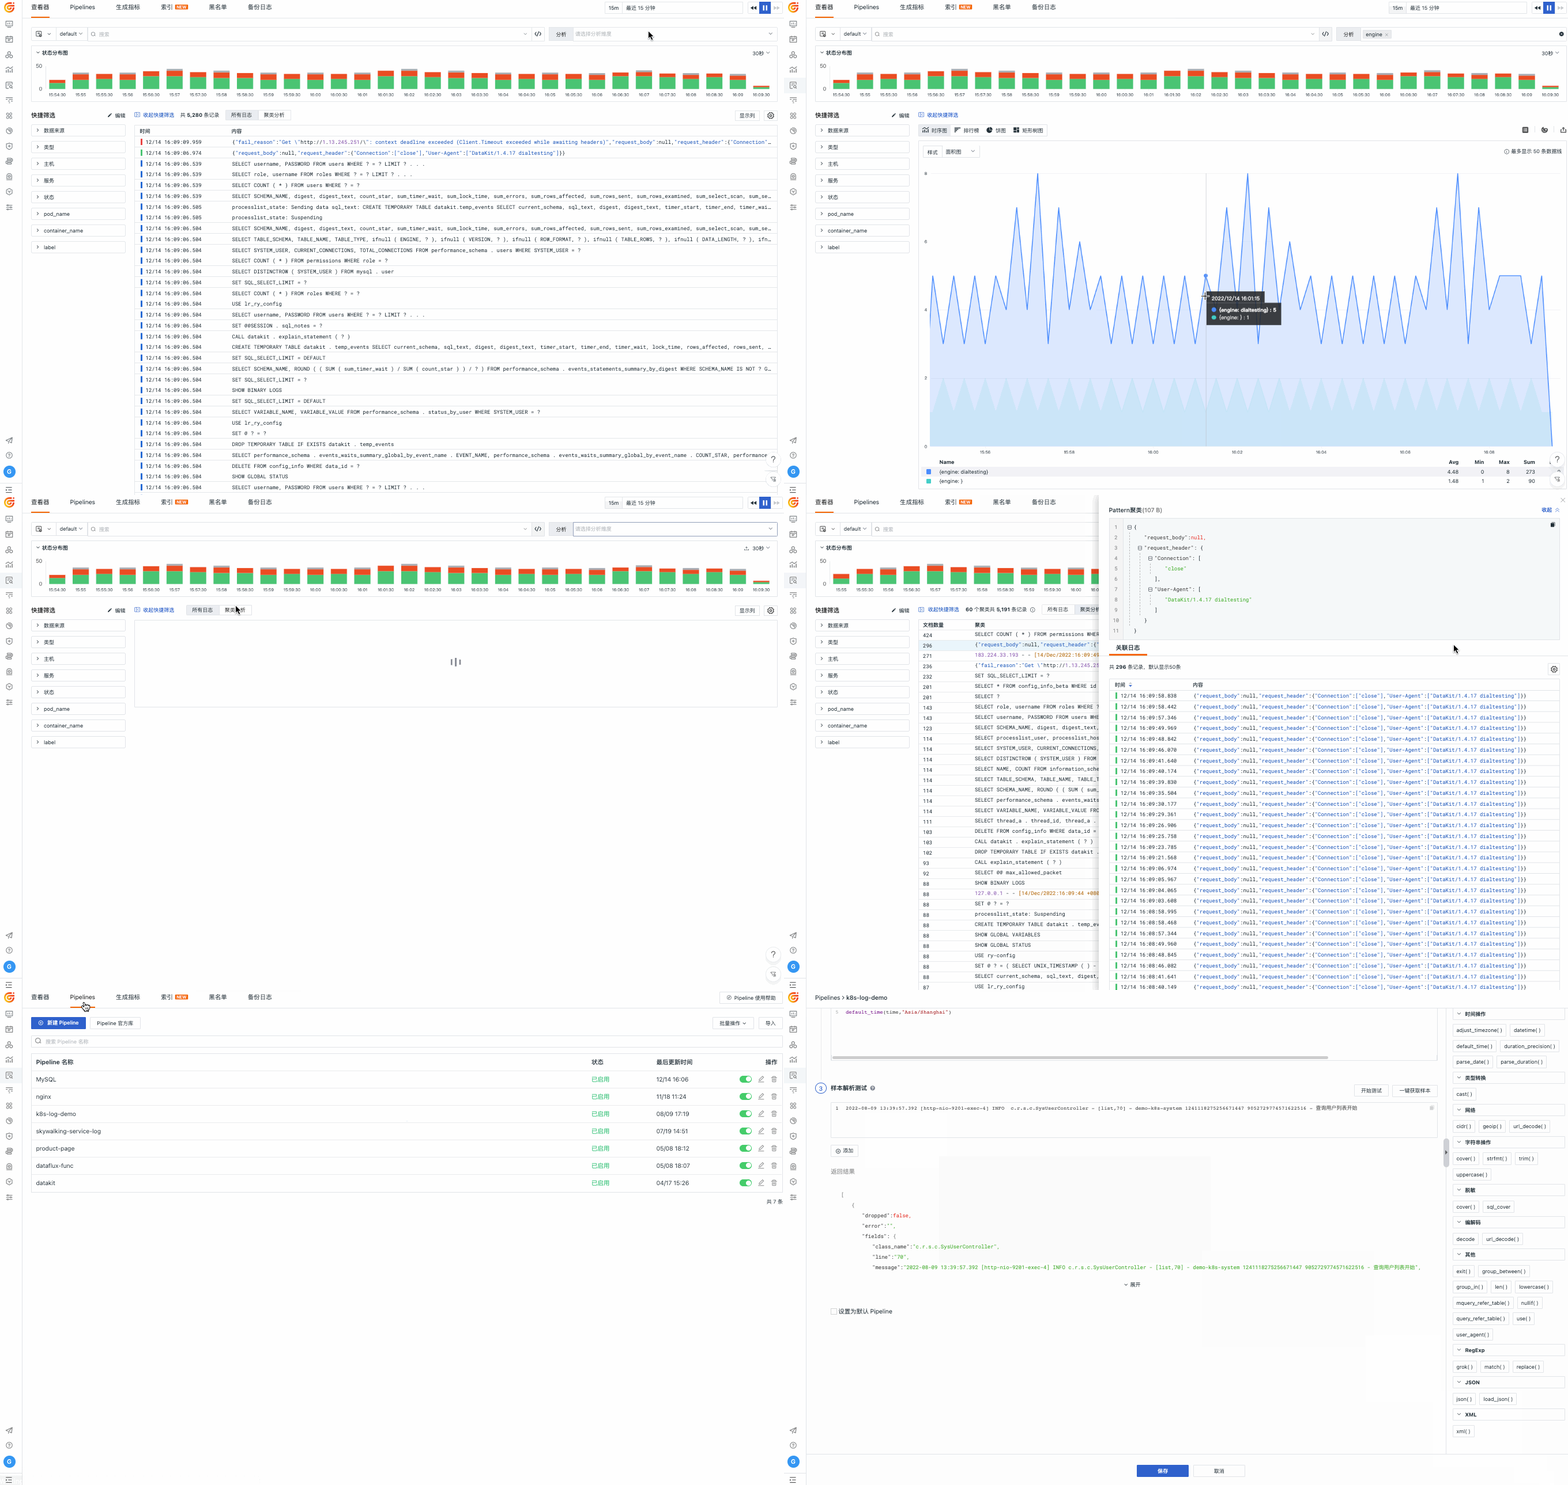
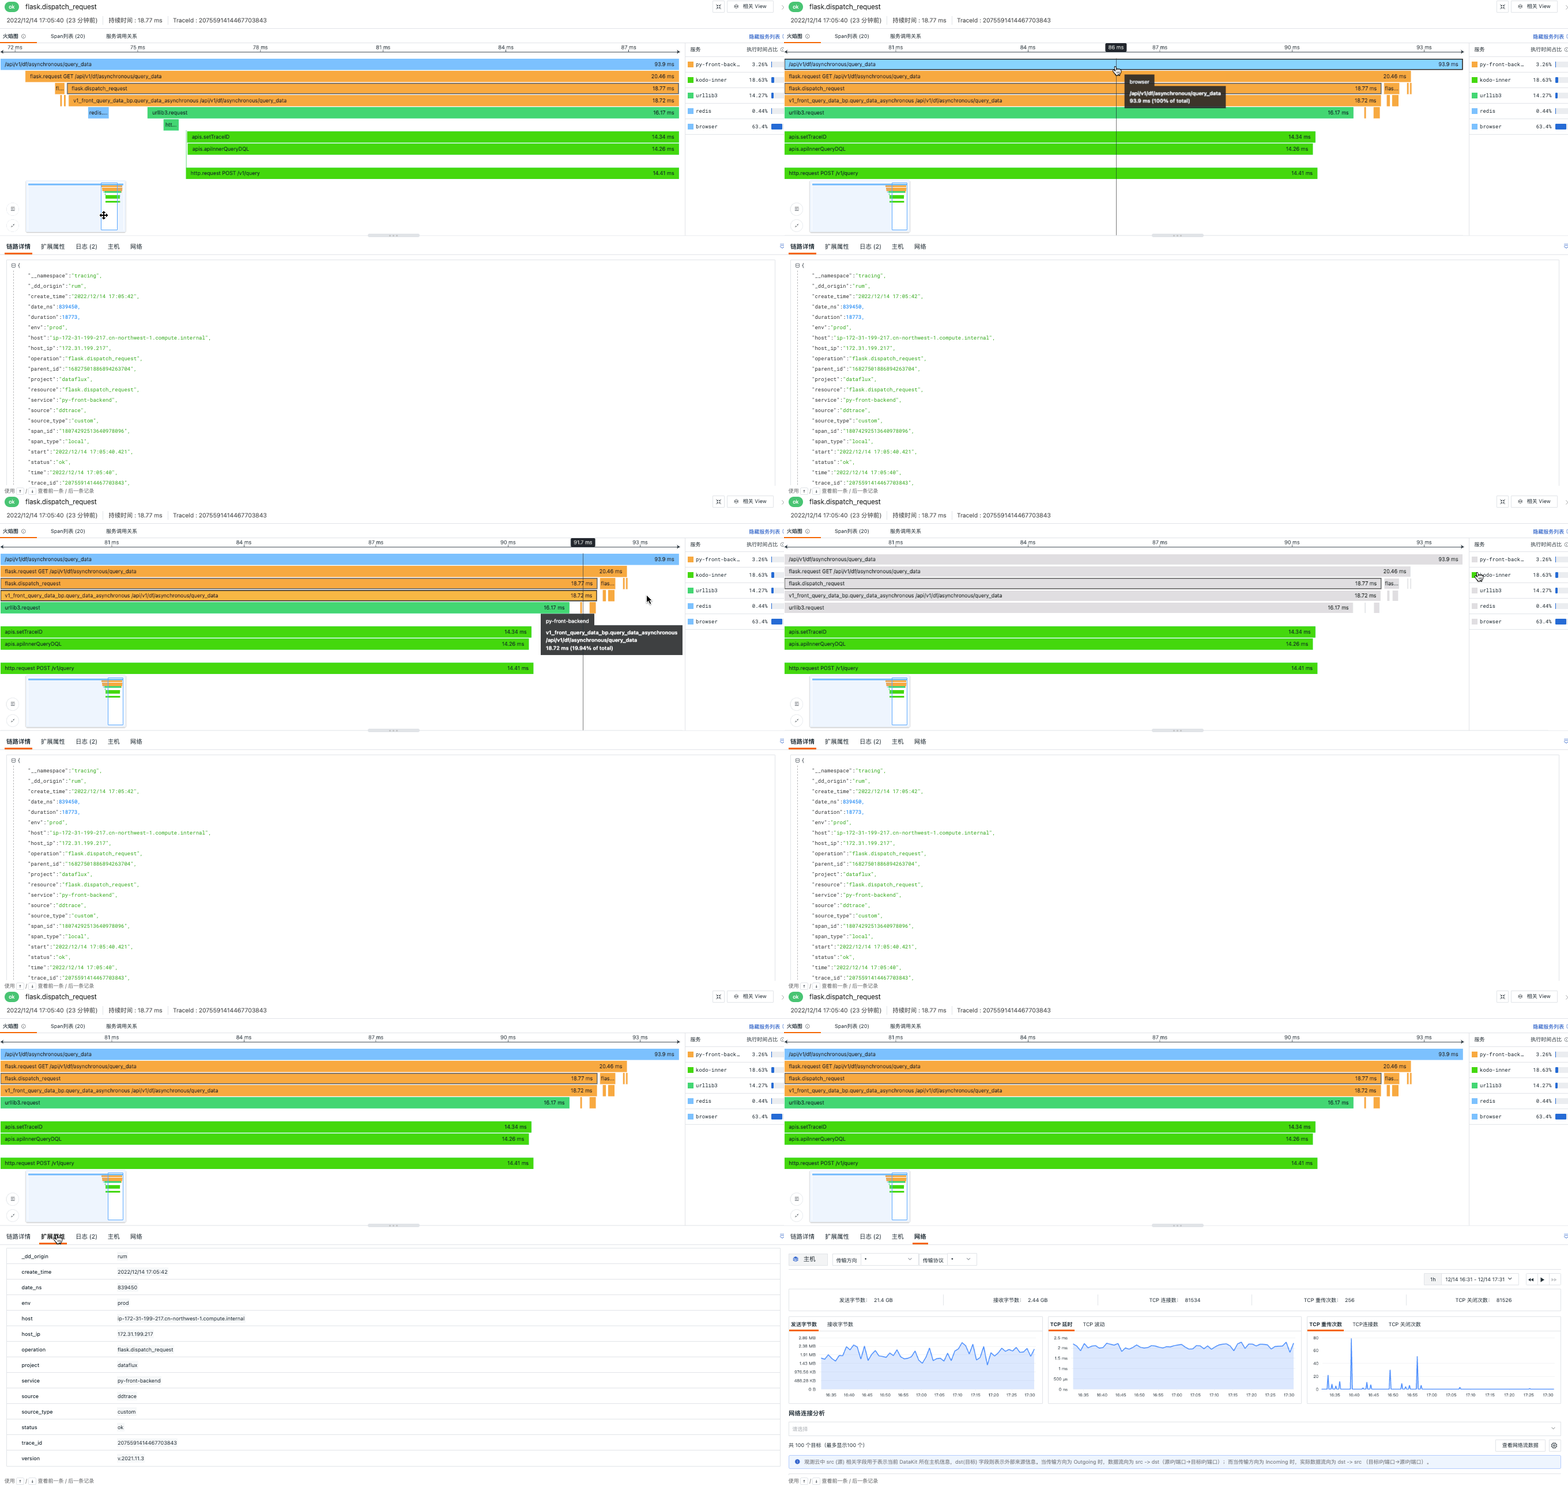
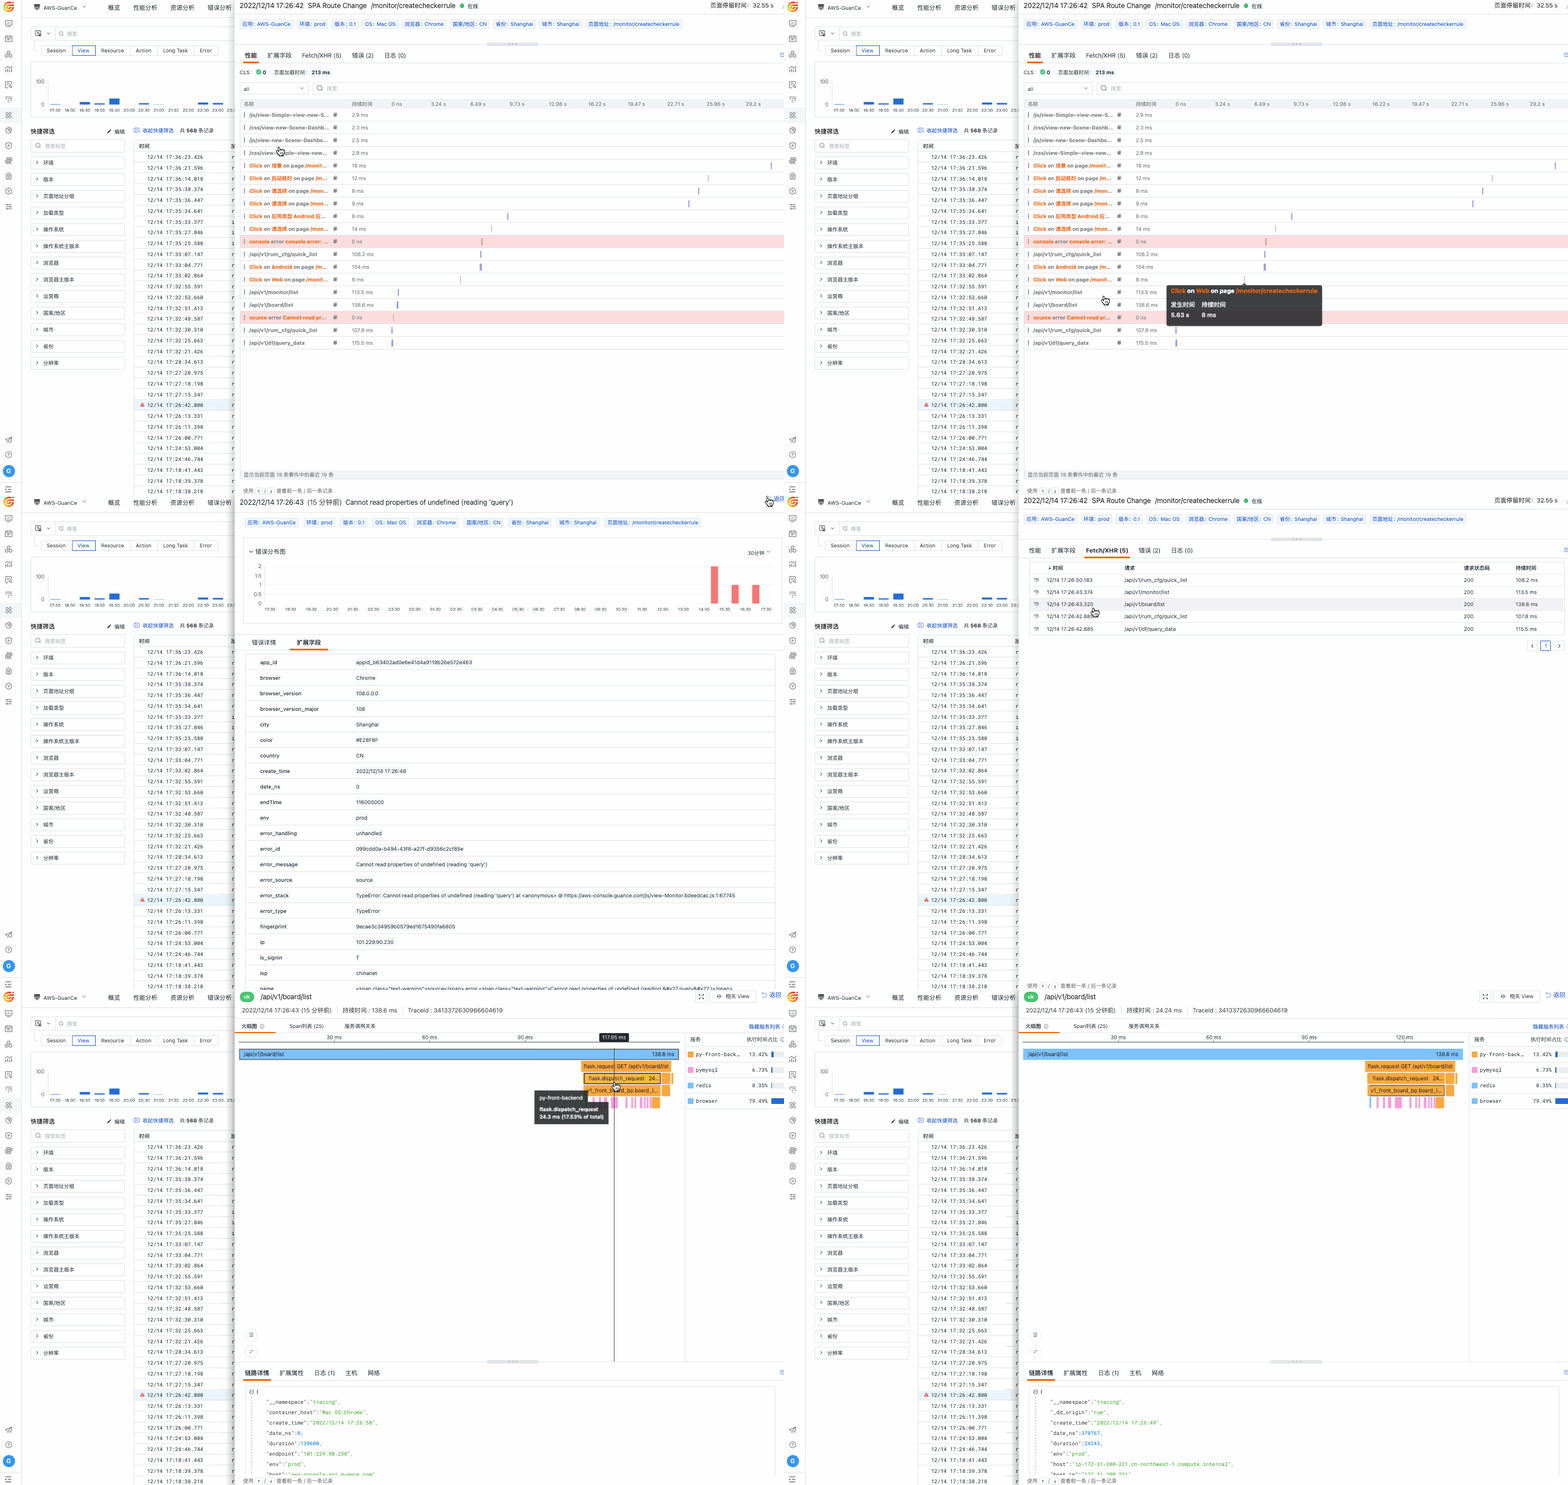
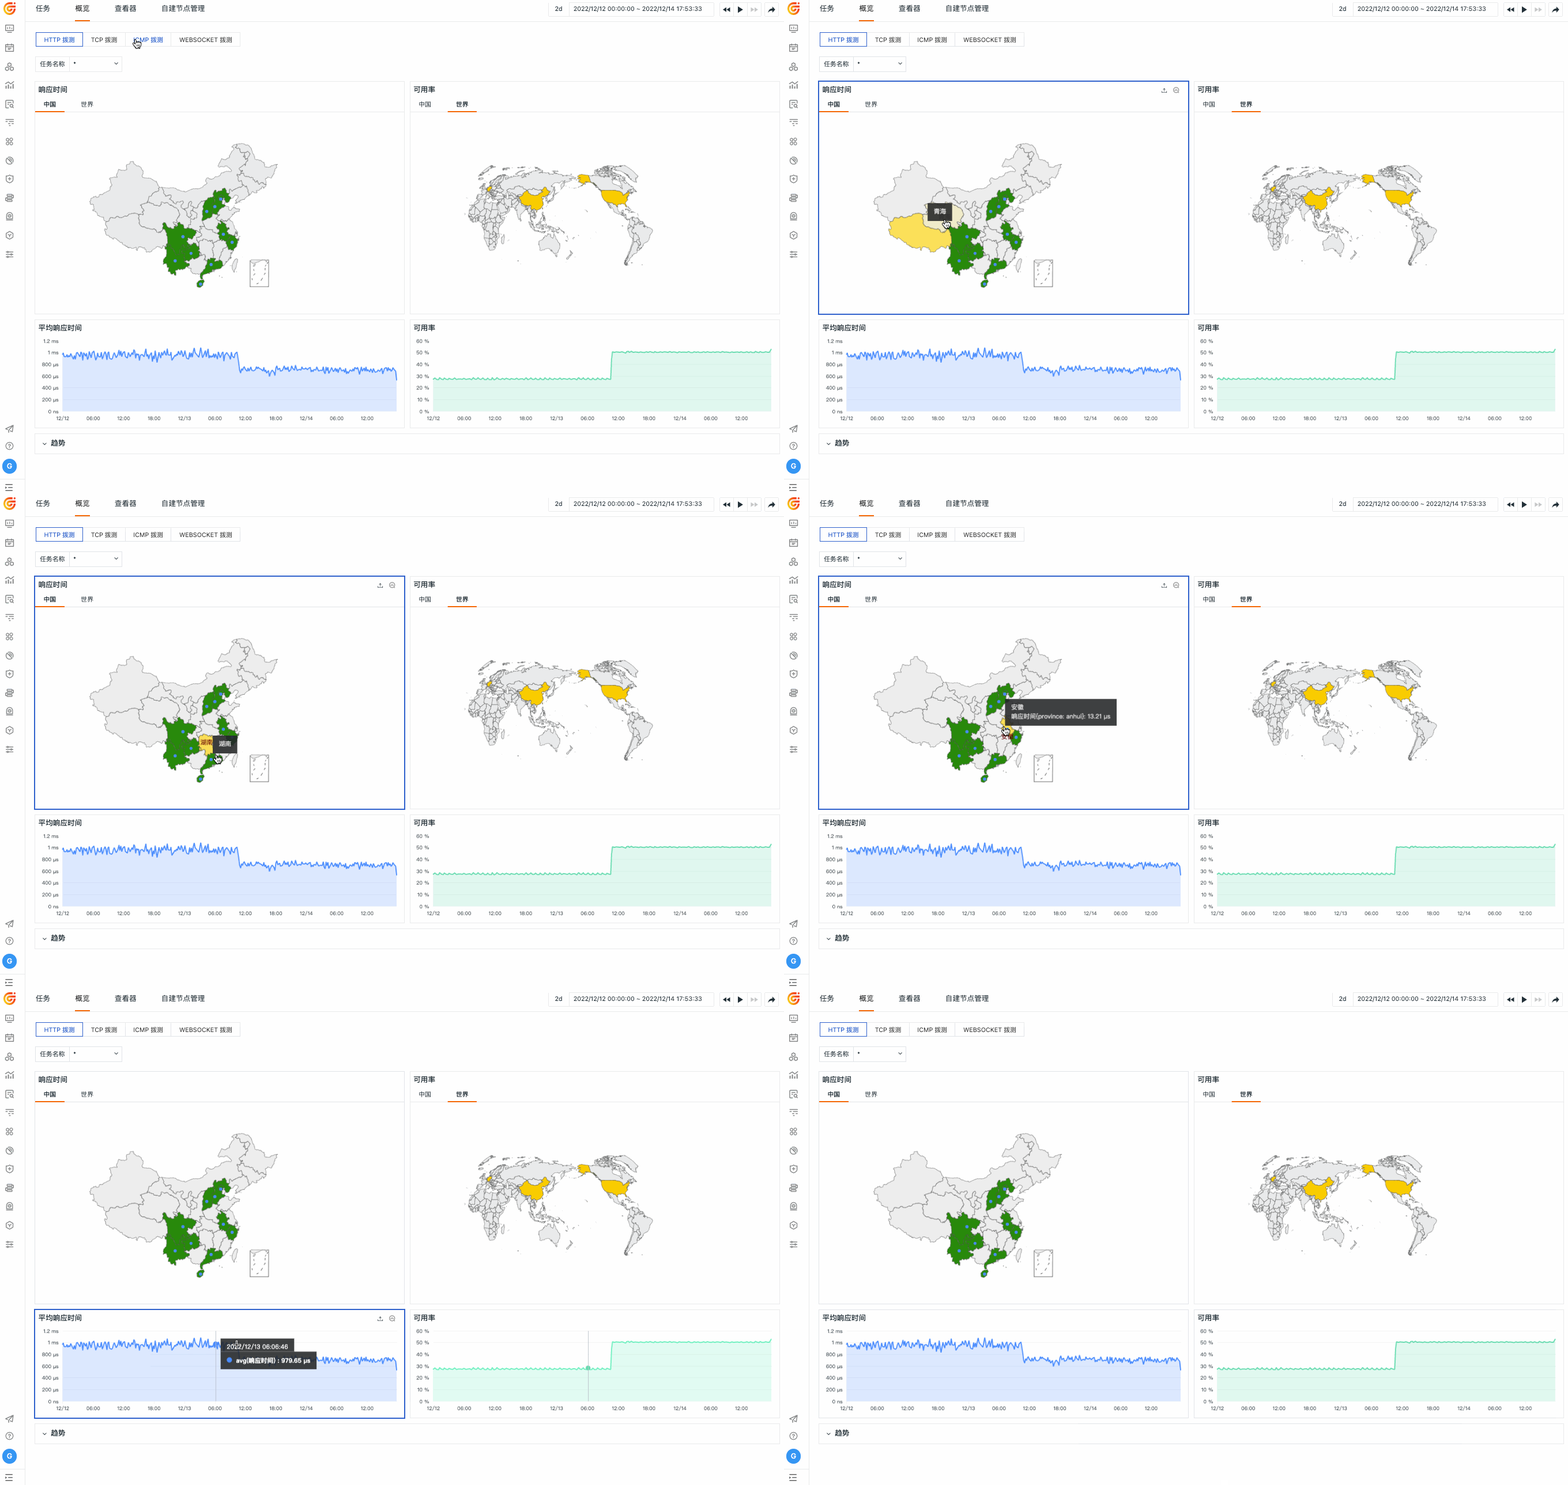
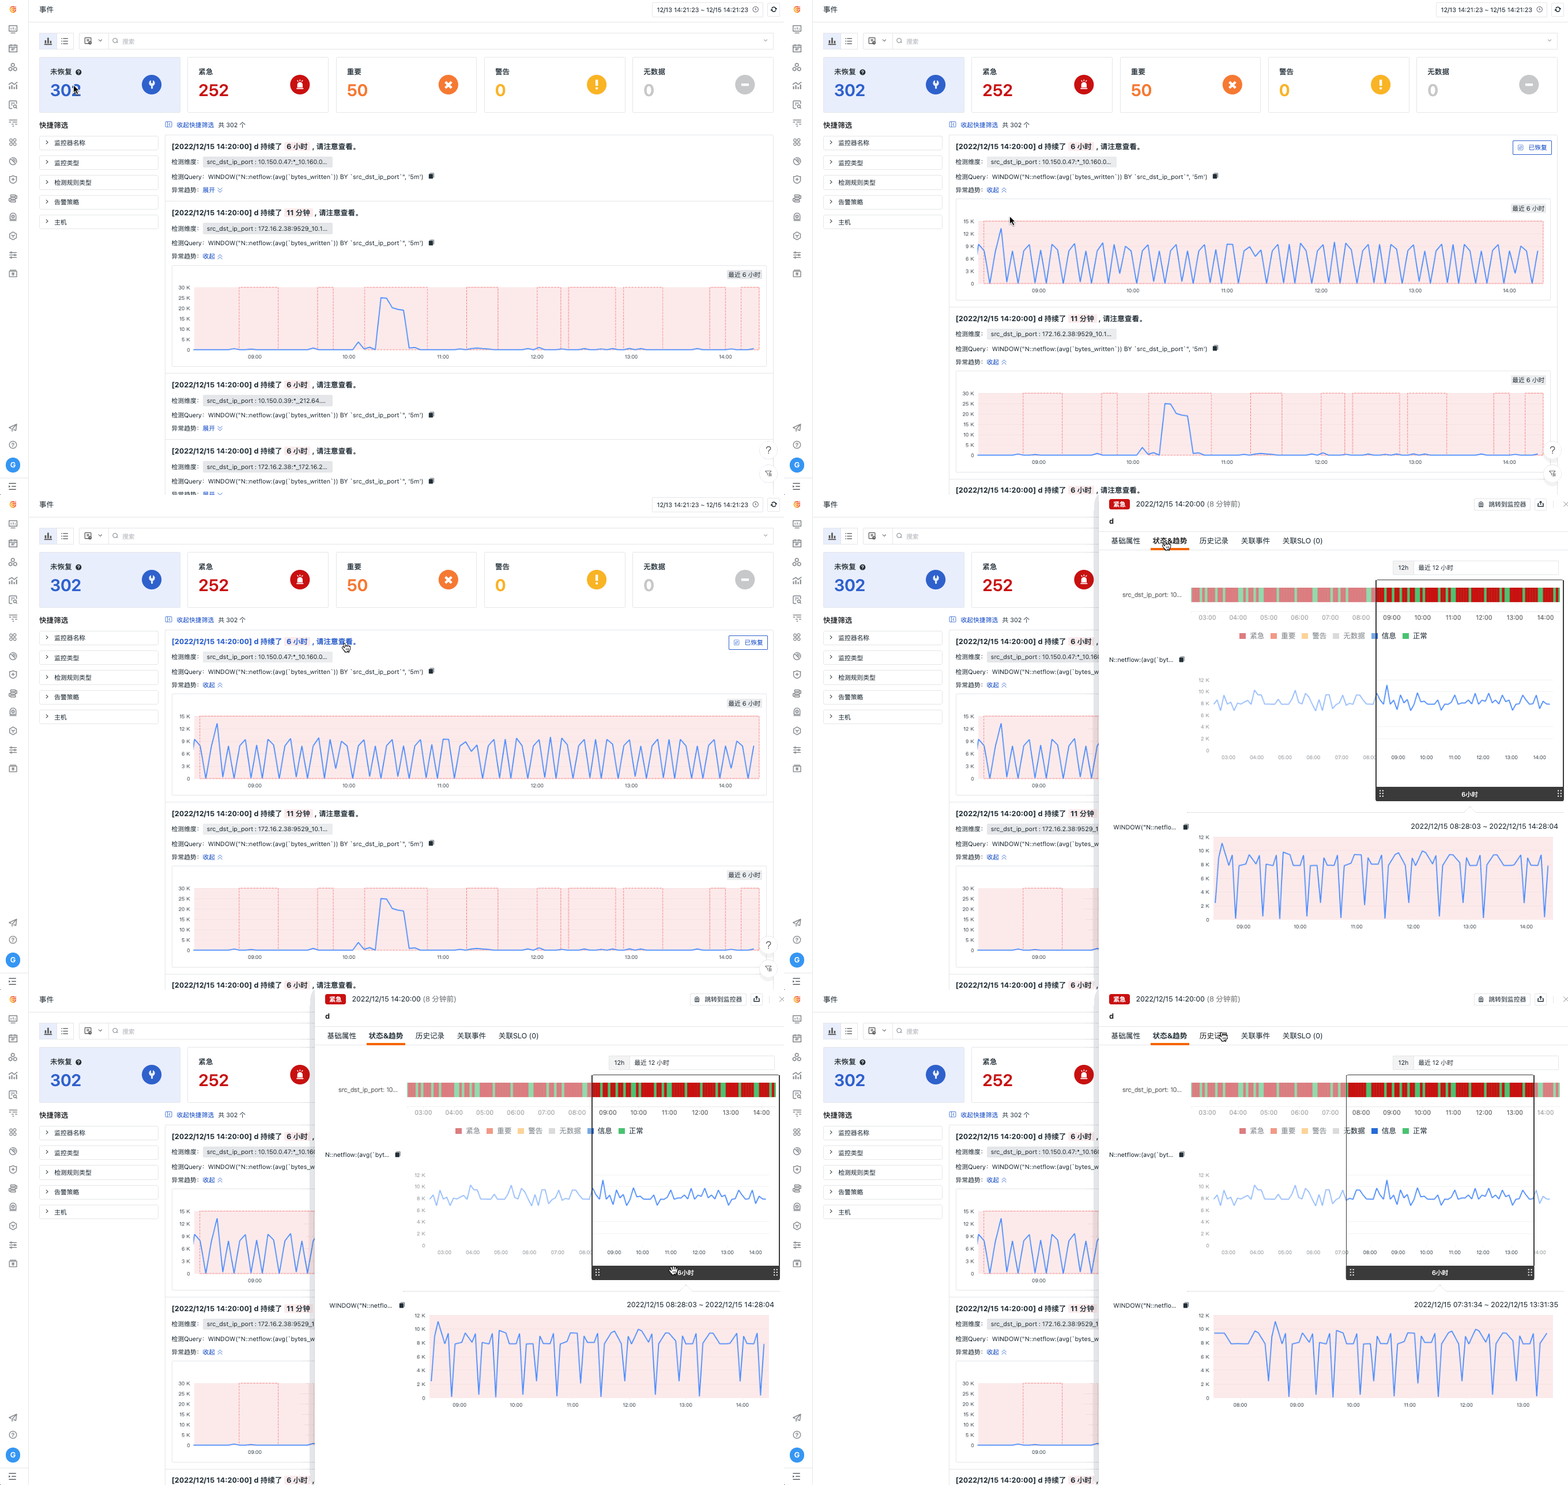
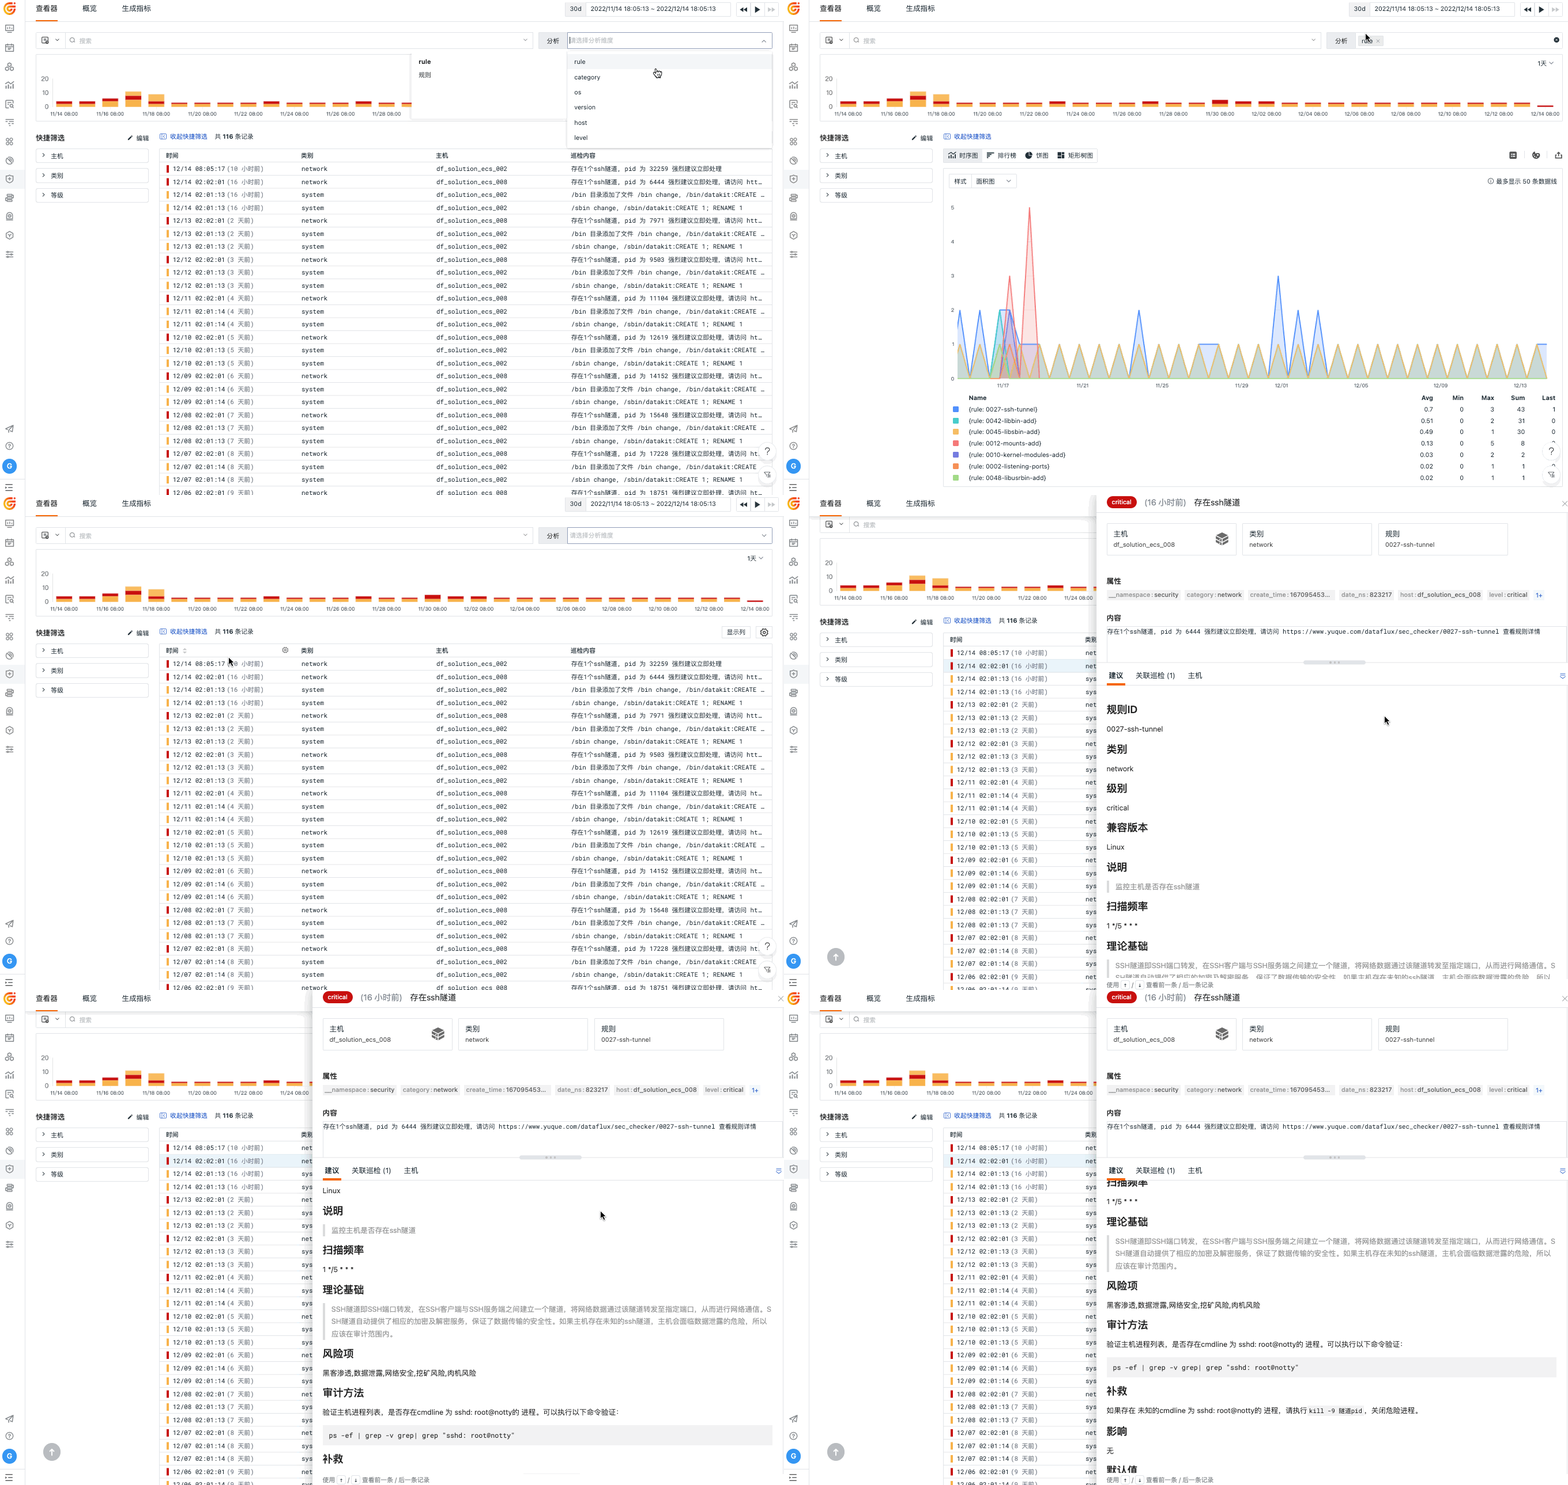
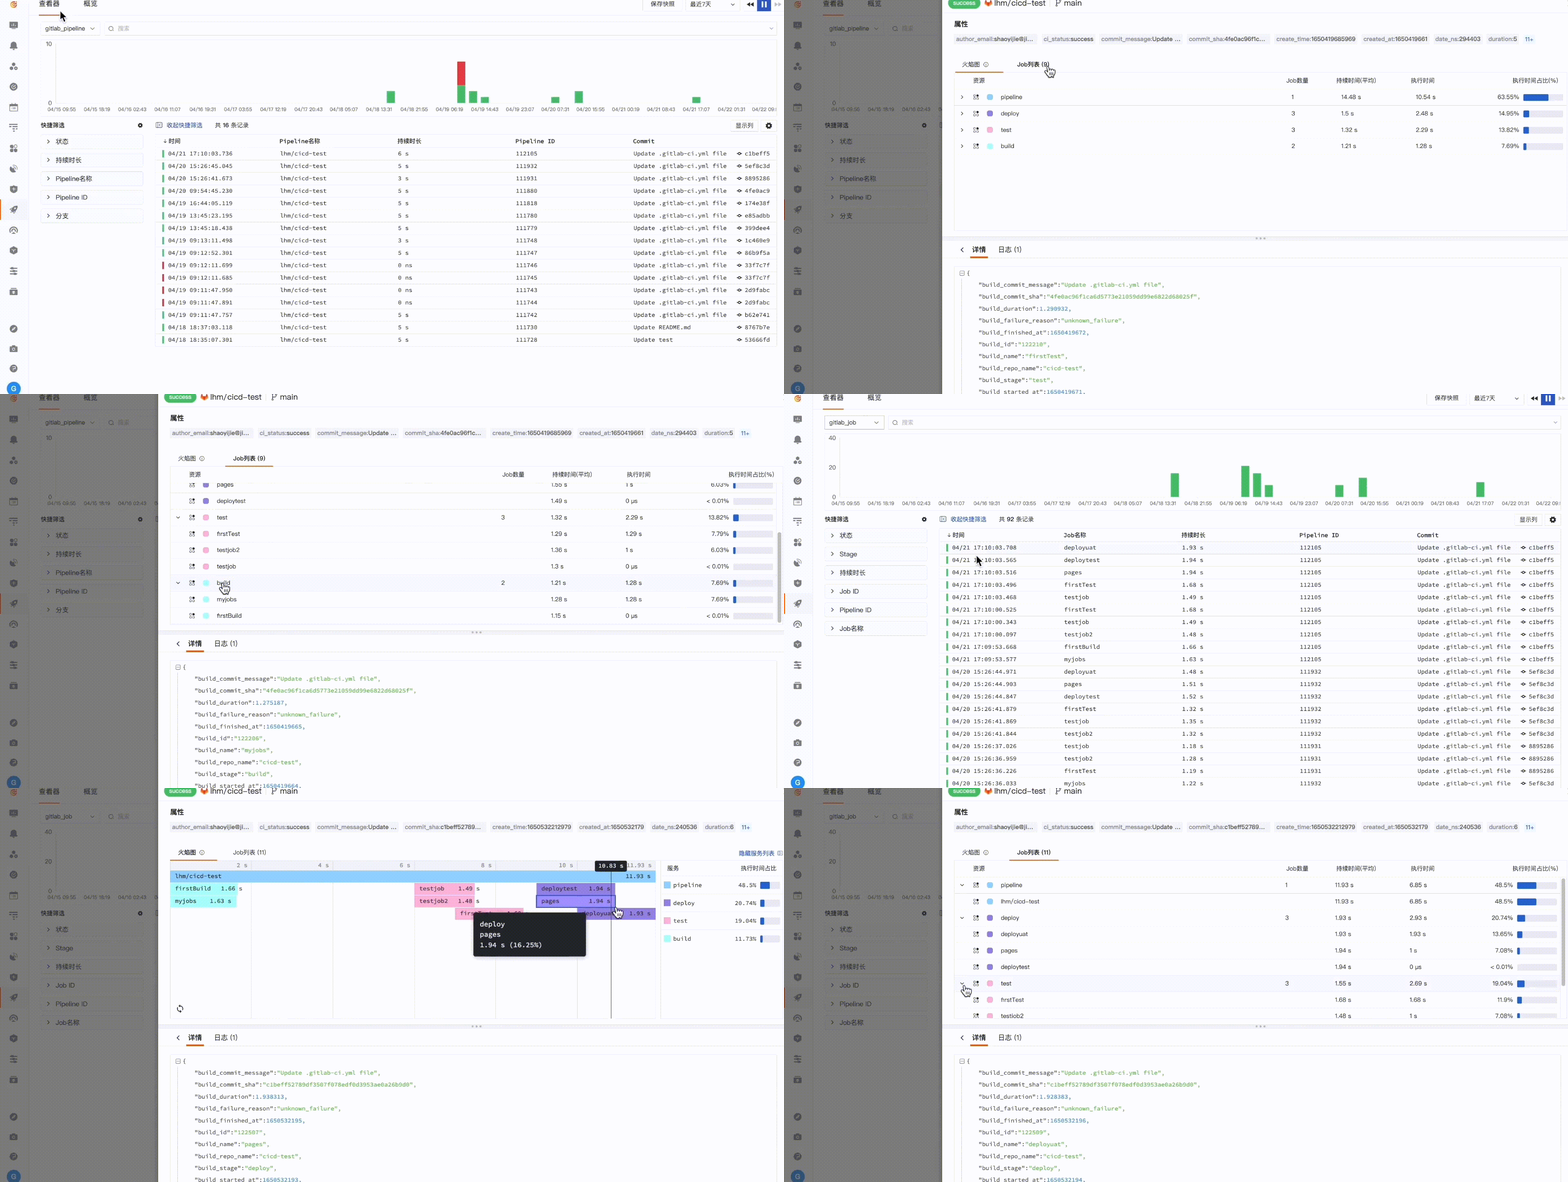
Switch between real Guance product views to see how teams move from a system symptom to the evidence needed for a decision.Unified observability platform

Create dashboards with flexible layouts, rich visualizations, drag-and-drop interaction, shared queries, and ready-to-use system templates.
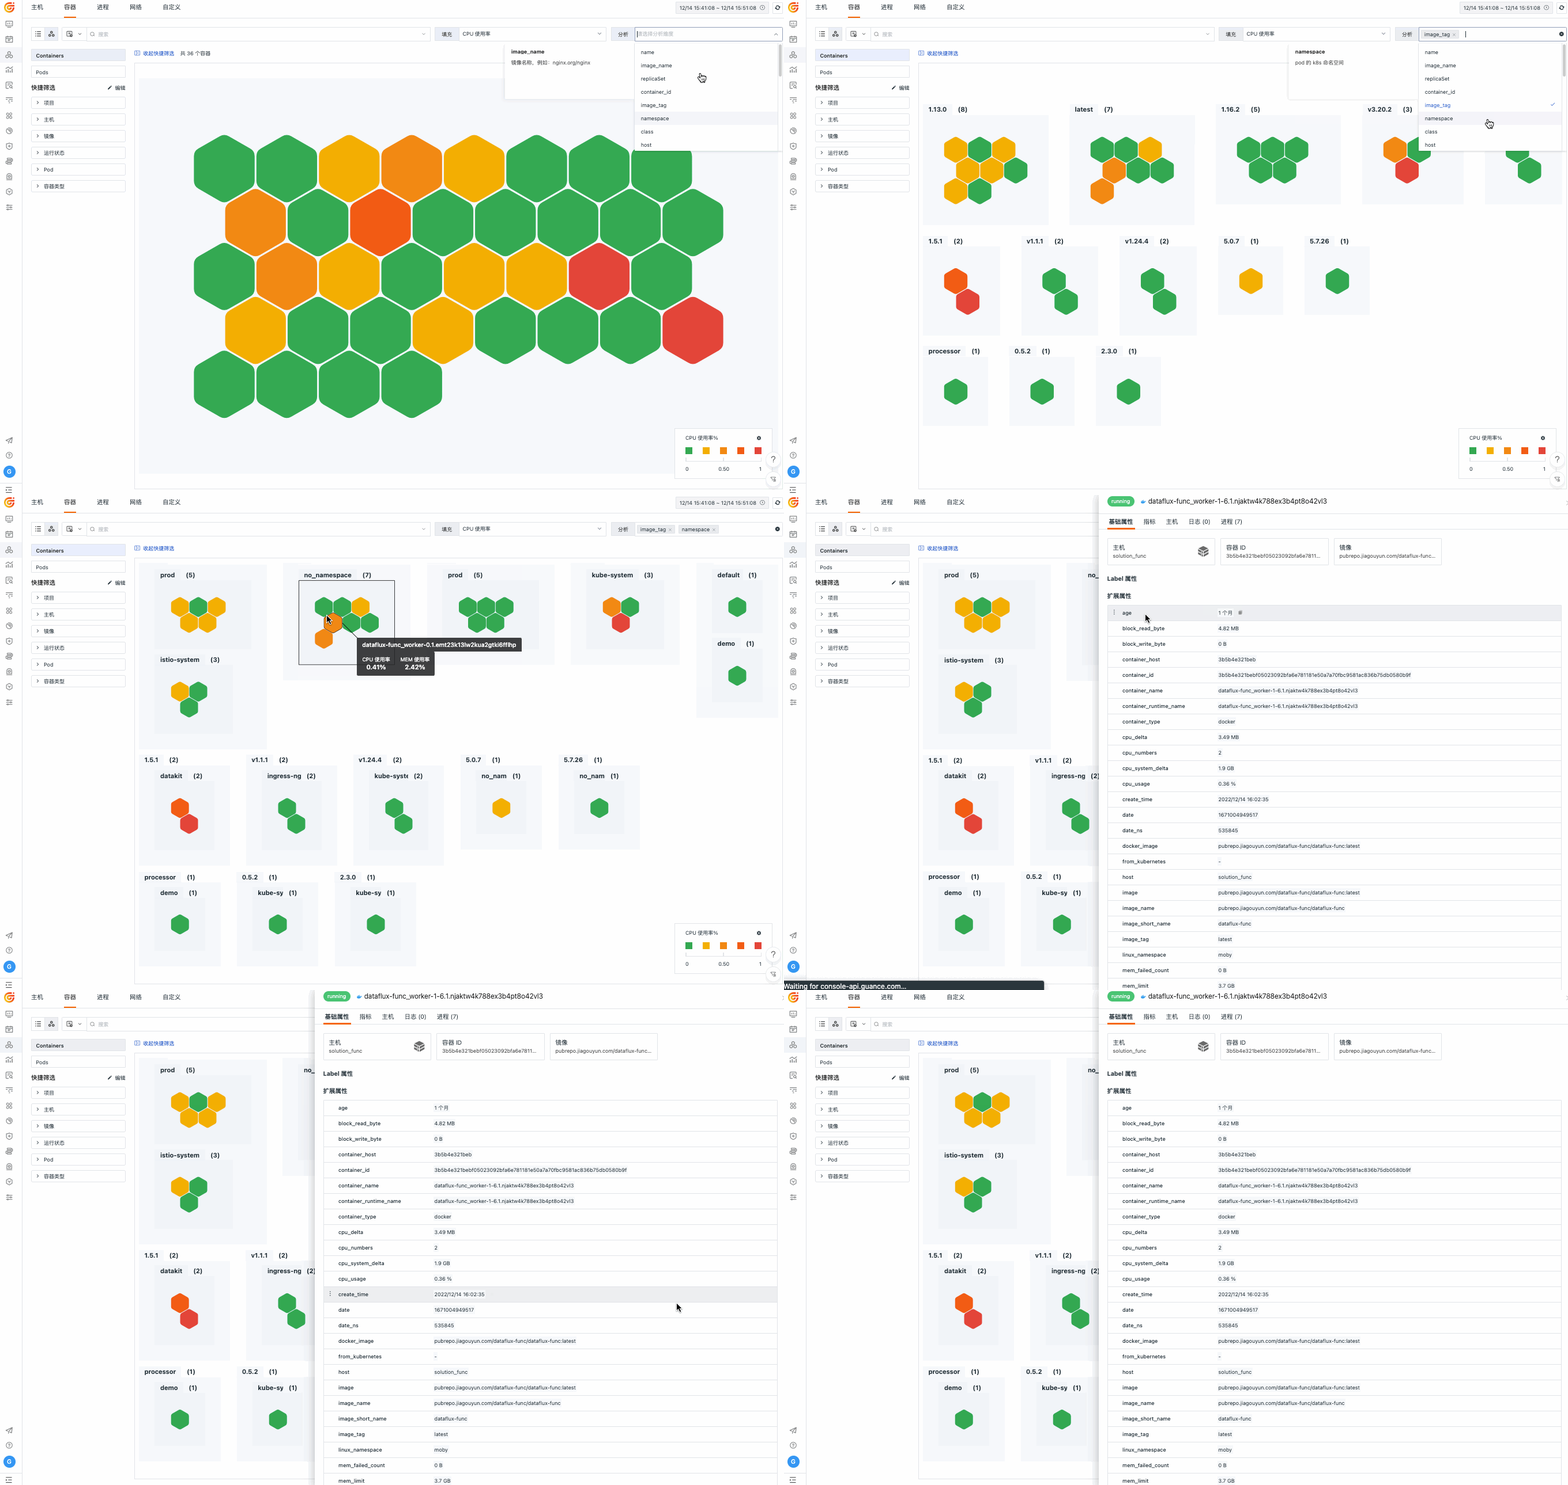
View detailsDeploy quickly across hosts, containers, processes, public clouds, and private environments, then inspect health and capacity from interactive views.
View detailsCollect logs from applications, hosts, containers, gateways, and cloud services, then search, parse, visualize, alert, and correlate them with traces.
View detailsConnect service maps, distributed traces, errors, logs, profiles, infrastructure, and releases to explain why an application is slow or failing.
View detailsUnderstand page performance, errors, resources, actions, sessions, and backend traces from the perspective of each user journey.
View detailsRun scheduled checks for availability, latency, DNS, TLS, APIs, and network connectivity from selected test locations.
View detailsConfigure detection rules, severity levels, mute policies, recipients, and SLO alerts across metrics, logs, applications, and user experience.
View detailsRun scheduled checks across systems, software, and logs, surface findings, and provide evidence teams can review and act on.
View detailsTrack pipeline execution, failed branches, logs, and task context so teams can troubleshoot delivery issues without rebuilding evidence.
View detailsCreate and run functions, expose APIs, and automate application, network, storage, and server workflows without maintaining separate infrastructure.
View details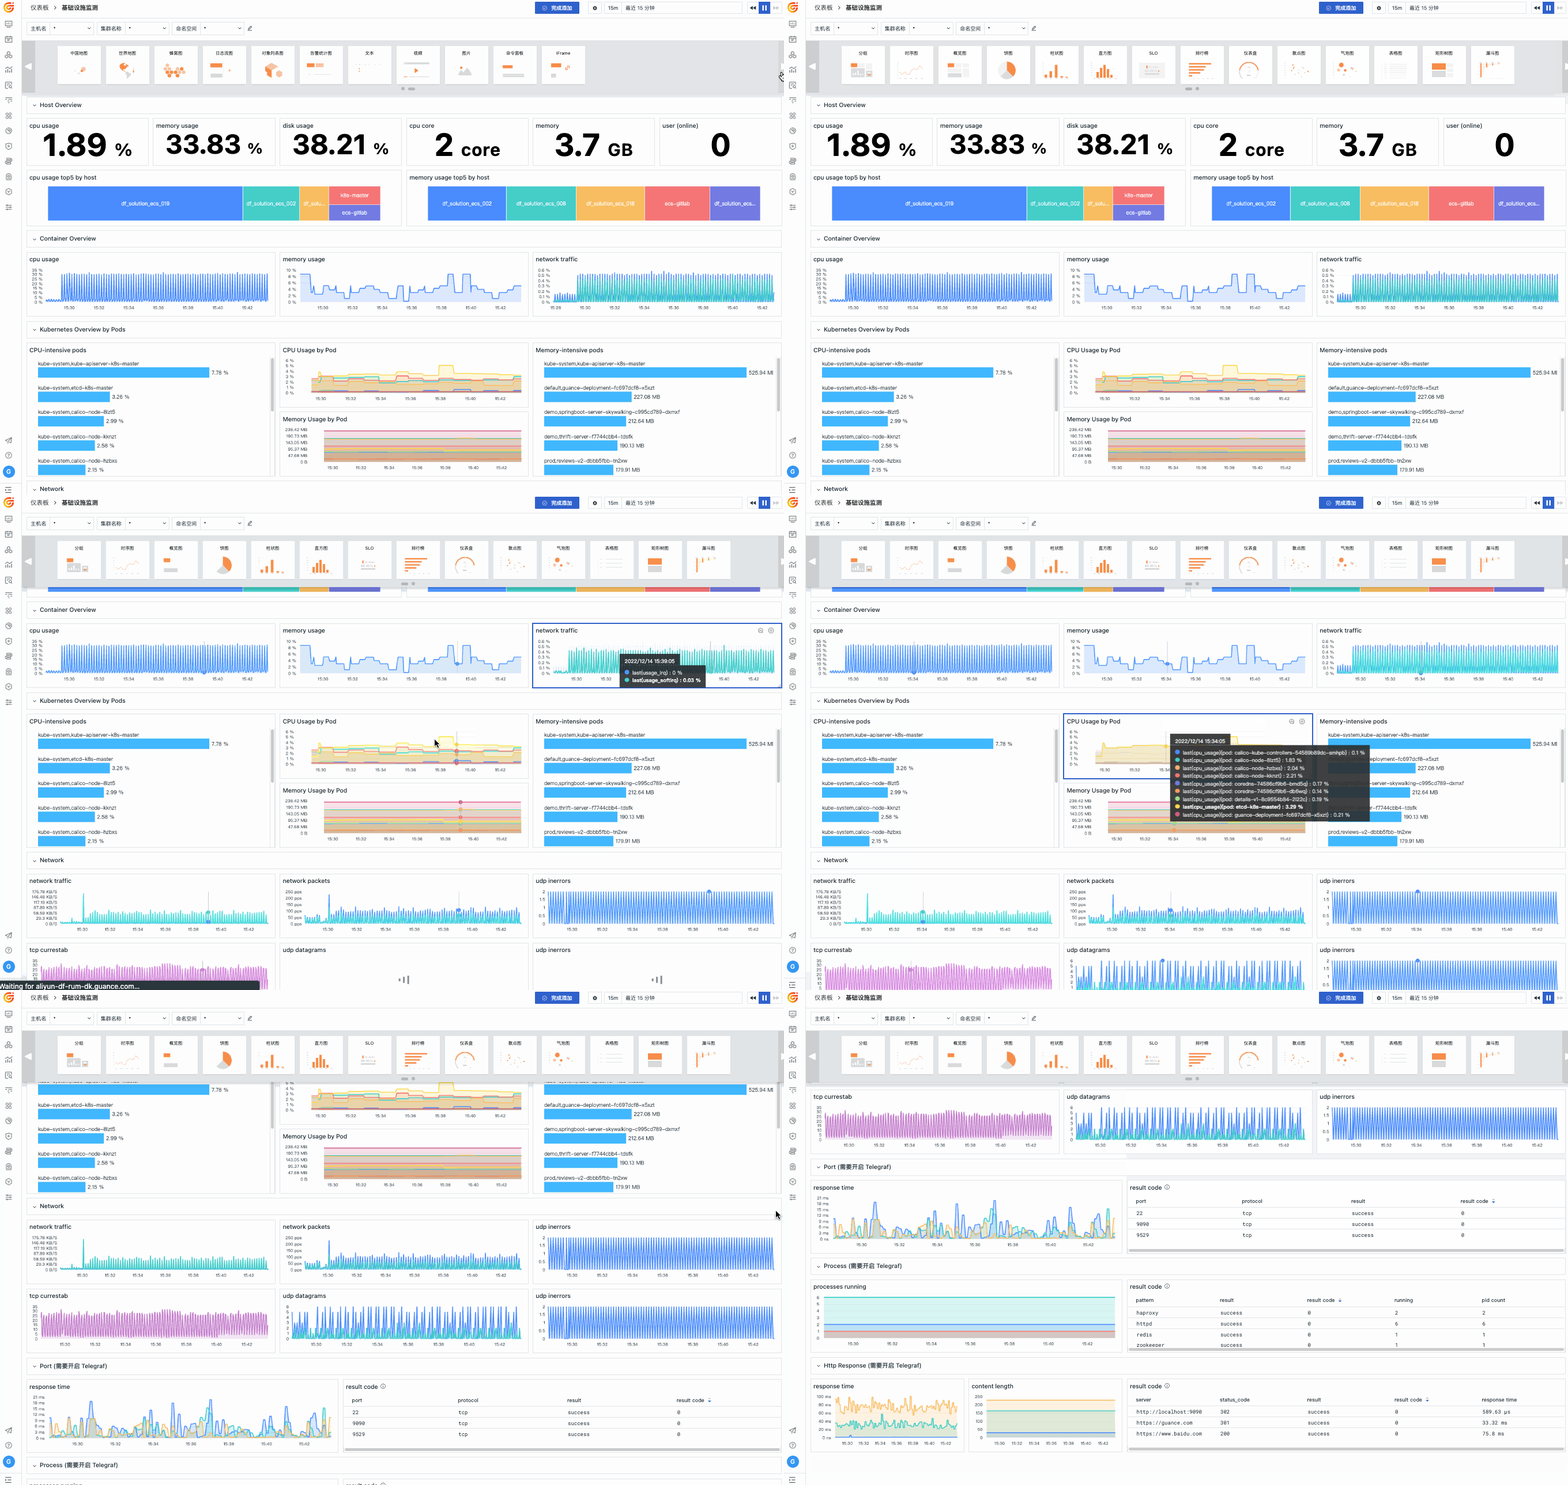
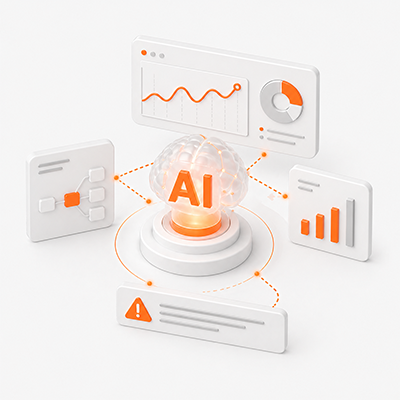
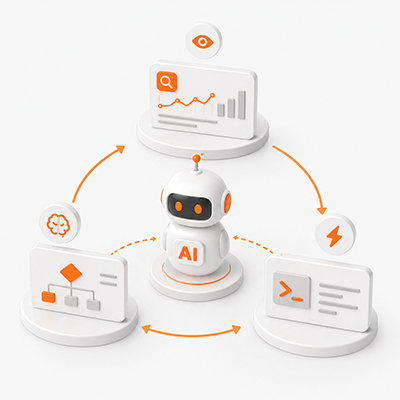
From observation to action, driven by AI
Your Agent team works around the clock to turn signals into decisions and controlled actions.
Improve reliability across your systems
Global reach
Observe systems, applications, and digital experience across regions through Guance service nodes.

Open integrations
Connect applications, databases, infrastructure, and public clouds without isolating data by environment.

One platform
Unify metrics, traces, logs, profiles, RUM, infrastructure, application, and availability data in shared dashboards and workflows.

Usage-based pricing
Pay according to actual usage with daily settlement; current allowances and rates are listed on the pricing page.
Guance supports global service access and multi-region observability workflows for teams running digital services across Southeast Asia and beyond.
10 +
global service nodes
60 +
countries and regions served with low-latency access