


What is log monitoring? From detection to response
Design log monitoring around detection windows, error rates, and missing data. Route actionable alerts and investigate related signals with Guance.
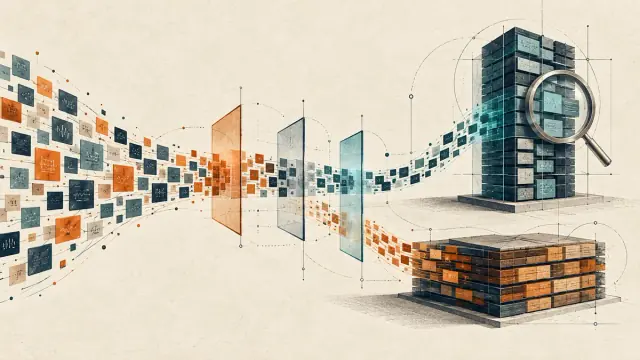
Two five-minute windows each contain 30 failed checkout requests. In one window, checkout handled 3,000 requests. In the other, it handled 300. The failure rates are 1% and 10%. Both windows reach a threshold of 30 failures, but they tell the on-call engineer different things.
Log monitoring runs recurring checks on collected logs and generates events or notifications when the configured conditions are met. It can shorten mean time to detect (MTTD) when the right events arrive and the rule gives the team a useful place to start. The choice of source, window, and denominator matters as much as the threshold.
Start with the evidence your logs carry
Application logs describe requests, business operations, and exceptions. Infrastructure logs come from hosts, containers, and network equipment. Security logs include authentication and permission changes. The records may arrive from files, container stdout, or a cloud export. Verify the source, event timestamp, and coverage before counting anything.
Logs help explain what changed. They can reveal an error pattern before a team would otherwise notice it, and can give security responders a trail to investigate. OWASP includes security logging and alerting failures in its 2025 Top 10. A missing or poorly scoped rule can still leave gaps. OWASP A09:2025
From a log query to an alert
- Choose the records and the window. In Guance Log Detection, choose the data source, filter for the error you care about, and group by a useful field such as service. A five-minute frequency checks once every five minutes. The detection range determines how far back each run looks and must be at least as long as the frequency. Longer ranges can overlap, so the same log may contribute to multiple runs. Set the range and threshold with reporting cadence, arrival delays, and the symptom's duration in mind.
- Separate counts, rates, and empty results. In the checkout example, 30 is a count. Divide by total requests in the same service, environment, and window only if each counted record represents one failed request. Duplicate lines and log sampling can skew the ratio. Use a trustworthy request denominator and handle a zero or missing denominator explicitly. An error-only query with no matches cannot tell you whether collection is working. If a source should report continuously, monitor its total volume or heartbeat separately. Guance lets you choose how to handle an empty query result. Treat it as zero only when that interpretation makes sense.
- Give the event a destination and a next step. The monitor generates events, and Event Center lets you inspect them. Use the event template to include the service, time range, and a relevant log link where available. The alert policy controls who is notified and how often. Escalation there depends on recurring anomalies at the same level. Enable incident association and map event to incident severity if the rule should create an incident record. Verify the event and recipient path with a controlled test. Event configuration
Three places log monitoring earns its keep
Troubleshooting a service
A spike in timeout logs can narrow the search to a service and a dependency. Check the request error rate and latency for the same period, then open a retained trace with matching IDs. The error text gives you a lead, and the other signals help distinguish overload from an upstream failure.
Investigating suspicious activity
A burst of Linux authentication failures is worth investigating. Group by a meaningful source or account, then check whether a successful login or privilege change followed. Legitimate retries can create a similar burst. An alert identifies activity to investigate.
Preserving evidence for an audit
Start from the applicable requirements. Decide which actions must leave a record, who can query and export it, how long it must remain available, and how integrity is protected. Test retrieval from the archive with a known event. Retaining logs alone does not demonstrate compliance.
Five practices that keep the checks useful
- Normalize the fields the rule depends on. Verify event time, service, environment, and severity with samples. Structured fields make filtering easier to check. A keyword can help when text is all you have. Remove sensitive values before broad collection or access.
- Route pages to an owner. Give the recipient a concrete action and an escalation path. An informational event can stay in Event Center for review without paging anyone.
- Keep the path to related signals. Log records give details, metrics quantify the impact, and sampled traces show the instrumented request path. Guance trace details uses
trace_idto find related logs that are present and queryable. Check the time range and permissions. Index selection follows configured rules, so verify where a test record lands. - Tune repeated notifications against response time. Consecutive checks can suppress short spikes, at the cost of later detection. Alert aggregation and mute windows reduce repeated notifications. Keep an urgent signal on a separate route if delaying it would be costly.
- Keep data for the investigation you need to run. Choose searchable retention from the lookback your team needs and use a controlled archive for audit records where required. A DataKit blacklist can drop low-value logs before upload. Verify that no monitor or audit process depends on them. A DataKit instance with a local blacklist filter in
datakit.confdoes not apply workspace blacklist rules.
What to check in a log monitoring tool
Use one rule your team actually needs. Check that the tool can read the right sources, query the expected volume, show the exact records behind a chart, and route the event with usable context. Then repeat with a late record and an empty result. That exposes differences in detection and notification that a feature list misses. For a wider comparison of storage, query, and cost models, see the log platform selection guide.
Frequently asked questions
How does log monitoring relate to log management? Log management covers collection, parsing, access, retention, and archive. Monitoring runs checks over that data and uses the results to trigger an appropriate response.
When should I use a baseline instead of a fixed threshold? Use a fixed threshold for an explicit condition. Consider a historical baseline or change comparison when normal traffic varies by hour or day. Validate it against known incidents and normal peaks. Guance Smart Monitoring can use built-in or AI-generated rules and runs the saved rules. Review their metrics, windows, and thresholds.
How many alerts should a team have? Keep the rules with a clear owner and next action. When a rule triggers often and nobody responds, check the grouping, scope, and route. Tune it, make it informational, or remove it according to the coverage you need.
Further reading: Log management (Simplified Chinese) · Log levels (Simplified Chinese) · Reduce logging costs
Contact us
Join the community

to join the community
Try Guance
Start online and pay only for what you use.
Get startedChoose a Guance plan