


Logging vs. error tracking: what each tells you and how to use both
Compare logs and error tracking through capture, issue grouping, context, alerts and cost. Learn what crash analytics and affected-user counts can establish, and how Guance connects errors to recorded requests.
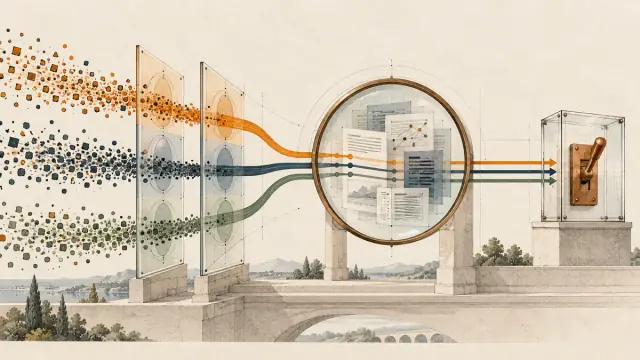
When a payment request fails, the exception can show where execution stopped. It may not show whether inventory was reserved first or what a downstream service returned. Those details need to have been recorded somewhere too.
Logs preserve events the application records; error tracking organizes captured errors into issues that a team can investigate and follow up. The distinction is useful, but it does not divide platforms into “manual search” and “automatic diagnosis.” Both can support queries and alerts, and neither reconstructs data that was never collected. Even an affected-user count depends on the identifiers and events available.
Key differences at a glance
- Logs can contain normal activity, debugging information, warnings and errors, subject to collection and retention. Error tracking focuses on errors and can also accept explicitly reported messages.
- Error trackers can group events using fingerprints and other rules. Log platforms can also organize errors through structured fields, queries, clustering and alerts.
- Stack traces, devices, releases and breadcrumbs depend on the SDK, integrations and configuration. They are not guaranteed to be complete; logs can carry structured context as well.
- The two work well together: error tracking helps identify, group and assign issues, while logs supply recorded business steps and downstream details.
What logging records
Developers, frameworks and middleware emit logs for selected events, such as request processing, state changes and debugging. That is not a record of everything the system does. A log may be free text or a structured record with fields such as service, status and a request identifier. Its usefulness depends on what was recorded, collected and retained. The OpenTelemetry log data model supports structured attributes as well as a body.
An investigation can start with a text search, a structured query, an alert or a related request. Logs can then show recorded business state and processing order. A single error entry does not, by itself, establish the full root cause.
What error tracking adds
The error-tracking features in products such as Sentry collect error events through SDKs and integrations. Automatic capture depends on the runtime and an initialized, configured SDK. Common examples include uncaught exceptions and unhandled promise rejections. An exception already handled by the application may need explicit reporting through an API such as captureException. Do not assume that every crash or incorrect business result will be detected. Sentry error capture
Error tracking typically organizes three kinds of work, some of which log platforms can also provide:
- Grouping events into issues. Stack traces, exception types, messages and custom fingerprints can influence grouping. Sentry versions its default algorithm and allows grouping rules to be customized. Similar messages need not represent one problem, and a shared cause may produce several groups. Grouping algorithms and rules
- Adding context. Events can include stacks, environments, releases, device information, users and breadcrumbs. Availability depends on the SDK and enabled integrations. User data needs deliberate collection and privacy controls; installing an SDK does not identify every visitor. SDK data collection
- Alerting and regression handling. New issues or the reappearance of resolved issues can trigger configured rules. Filtering, sampling, quotas, alert conditions and notification throttling affect what gets reported. A new exception is not a guarantee of an immediate notification. Alert triggers and filters
Crash analytics focuses more specifically on crashes and their observed distribution across releases, devices and users. Throwing an exception does not necessarily crash a process. Crash and native-error support varies by platform, so check the relevant SDK and symbol-file requirements. “Affected users” describes the identifiers represented in received events; it is not automatically a count of everyone affected or a measure of business loss.
Compare the workflows, not just the labels
| Dimension | Logging | Error tracking |
|---|---|---|
| Coverage | Events actually recorded and retained, including normal activity and errors | Captured exceptions, supported crashes and explicitly reported messages |
| Collection | Framework output, application logging and collectors | SDK or integration capture, plus explicit reporting |
| Aggregation | Structured queries, counts or clustering, depending on the platform | Issue grouping and counts, with configurable fingerprint or other rules |
| Alerts | Detection and notification rules over collected data | Rules for new issues, regressions and other conditions, with throttling |
| Context | What the log recorded, processing preserved and retention kept | What the SDK, platform, integrations, identifiers and privacy settings provide |
| Cost | Product-specific ingestion, storage, query or feature charges | Product-specific event allowances, retention, features or overage charges |
Grouping reduces the number of issues people need to handle individually. It does not necessarily reduce the number of error events ingested. Compare the actual products and plans before concluding that one costs less; “log volume” and “event volume” are not universal, interchangeable billing units.
Use both through the investigation
The entry point determines the order, but three steps are useful:
- Detect: An error-tracking rule or log monitor identifies a new issue or a change in errors. Estimate the observed impact from the data and identifiers actually collected.
- Scope: Use release and environment fields to narrow the problem and assign it to the responsible team. Those fields must have been recorded correctly.
- Diagnose: Search retained logs using the event time and request context, then examine stacks, business state and downstream responses to test the explanation.
Keeping only error events may omit the normal steps leading to a failure. Keeping scattered text without usable fields or alerts can also leave important problems unnoticed. Choose the missing evidence and workflow capabilities, rather than relying on the name of the data type.
Follow an error back to the request in Guance
With trace collection configured and business logs carrying the current trace_id in a consistent format, Guance's trace details can show recorded error spans and retrieve related logs for that request. Check the time range, service and environment fields, index mapping and query permissions. An identifier cannot recover a span discarded by sampling, an uncollected log or data beyond retention. The useful evidence is what was actually recorded; enabling application performance monitoring does not mean every exception has been captured and grouped.
Logs also offer an error-focused view. Guance's log error tracking displays collected logs with error_stack or error_message fields. A record must contain those fields; a severity of error alone does not supply a missing stack trace.
For notification and ownership, configure monitor rules over the log or trace data and include relevant query links in the event. If incident association and event-severity mapping are enabled, matching abnormal events can create incident records. Notification still follows the configured alert policies. This separates tracking work from simply finding a line of error text.
Common questions
Is an error log level enough? It is one field. Structured error logs can support aggregation, clustering and alerts. Following a recurring issue or determining release and user impact needs the relevant stack, grouping rules and identifiers; severity alone cannot provide them.
Can error tracking replace logs? Usually not directly. Error events suit issue management, while audits and normal processing steps need their own records. If a logical defect produces no exception and is neither detected nor explicitly reported, neither tool automatically knows that the business result is wrong.
How do I connect an error log to its request? Record the active trace_id, keep service and environment fields consistent, and check the time range, index and permissions. Use a known failed request to confirm that the query finds its records. Events happening at the same time do not establish causation.
Can I track frontend errors? A suitable SDK can capture supported errors, within its runtime, integration and browser limits. To map a minified stack to source, the source map must match the deployed artifact, and the platform must obtain the mapping and required source content through an upload or supported access method. Sentry can associate artifacts through Debug IDs; release and path matching are other approaches. A release is not required for every method, and maps or symbols cannot supply a stack trace that was absent from the event. Source maps · Debug ID matching
Continue reading
Contact us
Join the community

to join the community
Try Guance
Start online and pay only for what you use.
Get startedChoose a Guance plan