


Prometheus Alertmanager: routing, grouping, silences, and inhibition
Configure Prometheus Alertmanager routes, test receiver selection with amtool, and distinguish scheduled silences from dependency-based inhibition.
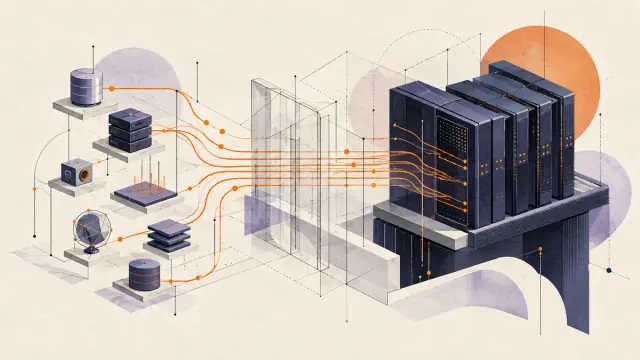
The checkout service starts timing out when its database goes offline. Prometheus raises a database alert and an error-rate alert for each affected instance. The on-call team needs the database page and enough context to see the blast radius. Sending every alert to the same phone makes it harder to find the first useful signal.
Alertmanager decides where and when to notify after Prometheus evaluates its alerting rules. Start with labels the responders can trust. They determine which alerts share a notification, which team receives it, and which symptoms can safely go quiet while a known dependency is down.
What Alertmanager receives
Prometheus evaluates alerting rules and sends firing alerts to Alertmanager. The alert's label set identifies it. Identical alerts sent by redundant Prometheus servers can be deduplicated. If the servers attach different replica labels, make sure the alert labels are consistent before expecting this to work. Alertmanager groups alerts into notifications and can suppress notifications through silences or inhibition. It leaves rule evaluation and alert expressions in Prometheus. Alertmanager concepts
Prometheus alert rules → Alertmanager
  → match routes and group alerts by labels
  → deduplicate or mute notifications as configured
  → receivers: email, Slack, webhook
Build a route and test it with labels
This example sends critical alerts to on-call and database alerts to the DBA team. It also sends critical database alerts to both. Save this as alertmanager.yml and put the email template shown below in templates/ops.tmpl. Run the commands from that directory. Replace the example addresses and configure your own authentication and transport settings before deployment.
global:
  smtp_smarthost: 'smtp.example.com:587'
  smtp_from: 'alerts@example.com'

templates:
  - 'templates/*.tmpl'

route:
  receiver: default
  group_by: [alertname, cluster, severity]
  group_wait: 30s
  group_interval: 5m
  repeat_interval: 4h
  routes:
    - matchers: ['severity="critical"']
      receiver: oncall
      continue: true
    - matchers: ['team="database"']
      receiver: dba-team

receivers:
  - name: default
    email_configs:
      - to: 'ops@example.com'
        html: '{{ template "ops.html" . }}'
  - name: oncall
    webhook_configs:
      - url: 'https://oncall.example.com/hooks/alertmanager'
  - name: dba-team
    email_configs:
      - to: 'dba@example.com'
        html: '{{ template "ops.html" . }}'
A matching child route stops further sibling checks by default. Here the critical route sets continue: true, so a database alert can match the next route as well. If no child matches, the parent handles the alert. An alert sent to one or more children does not also go to the parent receiver by default. Child routes inherit grouping and timing values unless they override them.
amtool check-config alertmanager.yml
amtool config routes test --config.file=alertmanager.yml \
  --verify.receivers=oncall,dba-team severity=critical team=database
The test prints oncall,dba-team. Remove continue: true and the same label set routes only to oncall. Try a noncritical alert with no team label to see the default route. These checks read the local file and do not deliver notifications. Route configuration
Choose what goes into one notification
With group_by: [alertname, cluster, severity], all checkout instances with the same alert name, cluster, and severity can share a notification within that route. A second cluster stays in a separate group. If several services emit the same alert name and responders need separate messages, include a stable service label. Grouping on a volatile label such as a request ID defeats the purpose.
group_wait delays the first notification for a new group so related alerts can arrive. If an alert resolves during that wait, it does not send a firing notification. group_interval controls when the group checks for changes such as newly firing or resolved alerts after the initial wait. repeat_interval controls reminders when the last notification is unchanged. Alertmanager checks it on group ticks, so a value that is not a multiple of group_interval is rounded up. A shorter notification-log retention period can cause an earlier repeat. Grouping and timing
Silence a maintenance window
A silence mutes notifications for alerts that match every condition, for the life of the silence. It does not change the Prometheus expression or stop the alert from firing. During maintenance, scope it to the alert name, cluster, and instance you are working on. A condition like severity=warning by itself could silence unrelated services.
amtool --alertmanager.url=http://127.0.0.1:9093 silence add \
  'cluster=prod-eu1' 'alertname=HighLatency' 'instance=db-01:9100' \
  'severity=warning' --duration=2h --author=operator --comment='Database maintenance'
Point amtool at your Alertmanager and replace the example labels with values from a real alert. In the UI, check the matched alerts and the expiration time. If several instances share a naming convention, a quoted regex matcher such as 'instance=~"db-0[12]:9100"' can match just those instances. Silences
Inhibit a known downstream symptom
A silence has a clock. Inhibition follows another alert. When DatabaseDown is active, the rule below mutes HighErrorRate and HighLatency notifications for the same cluster and database. Add the block at the top level of alertmanager.yml.
inhibit_rules:
  - source_matchers:
      - 'alertname="DatabaseDown"'
      - 'cluster!=""'
      - 'database!=""'
    target_matchers:
      - 'alertname=~"HighErrorRate|HighLatency"'
      - 'cluster!=""'
      - 'database!=""'
    equal: [cluster, database]
Both alert rules have to emit cluster and database. Alertmanager treats a missing label like an empty value when checking equal. The nonempty matchers keep an alert without a dependency label from being suppressed by another alert that lacks it too. Use inhibition only where those labels describe a dependency you understand. A coincident error in another database remains visible. Inhibition rules
If the same Prometheus metrics also feed Guance, rebuild the condition and notification policy in the Guance monitor that evaluates them. Remote Write carries time series. Route trees, silences, and inhibition rules remain Alertmanager configuration. Where Guance evaluates a separate rule, use its alert policy to choose recipients and aggregation. Check which system owns the page so both do not wake the same person for the same signal.
Put the evidence in the notification
The configuration above loads the following template. Save it as templates/ops.tmpl.
{{ define "ops.html" }}
<h2>{{ .CommonLabels.alertname }} ({{ .Status }})</h2>
<ul>
{{ range .Alerts }}
  <li>{{ .Labels.service }} · {{ .Labels.instance }} · {{ .Status }}
    {{ .Annotations.summary }}
    {{ with .Annotations.runbook_url }}<a href="{{ . }}">Runbook</a>{{ end }}
  </li>
{{ end }}
</ul>
{{ end }}
The common alert name works as a group heading. Iterating through .Alerts lets the receiver see the individual instance and its annotations. Define summary and runbook_url in the Prometheus alerting rule. If the current metric value belongs in the message, include it in a rule annotation such as summary; Alertmanager does not evaluate the query again. The html field applies to the email receiver. The generic webhook sends its own JSON payload. Notification template reference · Webhook receiver
Frequently asked questions
Does Alertmanager need high availability? Run multiple peers if a single notification instance is an unacceptable failure point. Configure Prometheus to send alerts to each peer rather than one load-balanced endpoint. Peers share silences and notification history. A network partition can still produce duplicate notifications. Alertmanager high availability
What happens if nobody acknowledges a page? A reminder repeats a notification while the condition is still active. Use the on-call or incident system to track acknowledgment and move the page to another responder after a timeout. Escalation policies
What is a good repeat interval? Work back from when the responder needs another reminder. Choose a multiple of the group's check interval and make sure notification-log retention covers it. A route for urgent incidents and one for an informational mailbox need different timings.
Further reading · Prometheus monitoring guide · OpenTelemetry vs Prometheus
Contact us
Join the community

to join the community
Try Guance
Start online and pay only for what you use.
Get startedChoose a Guance plan