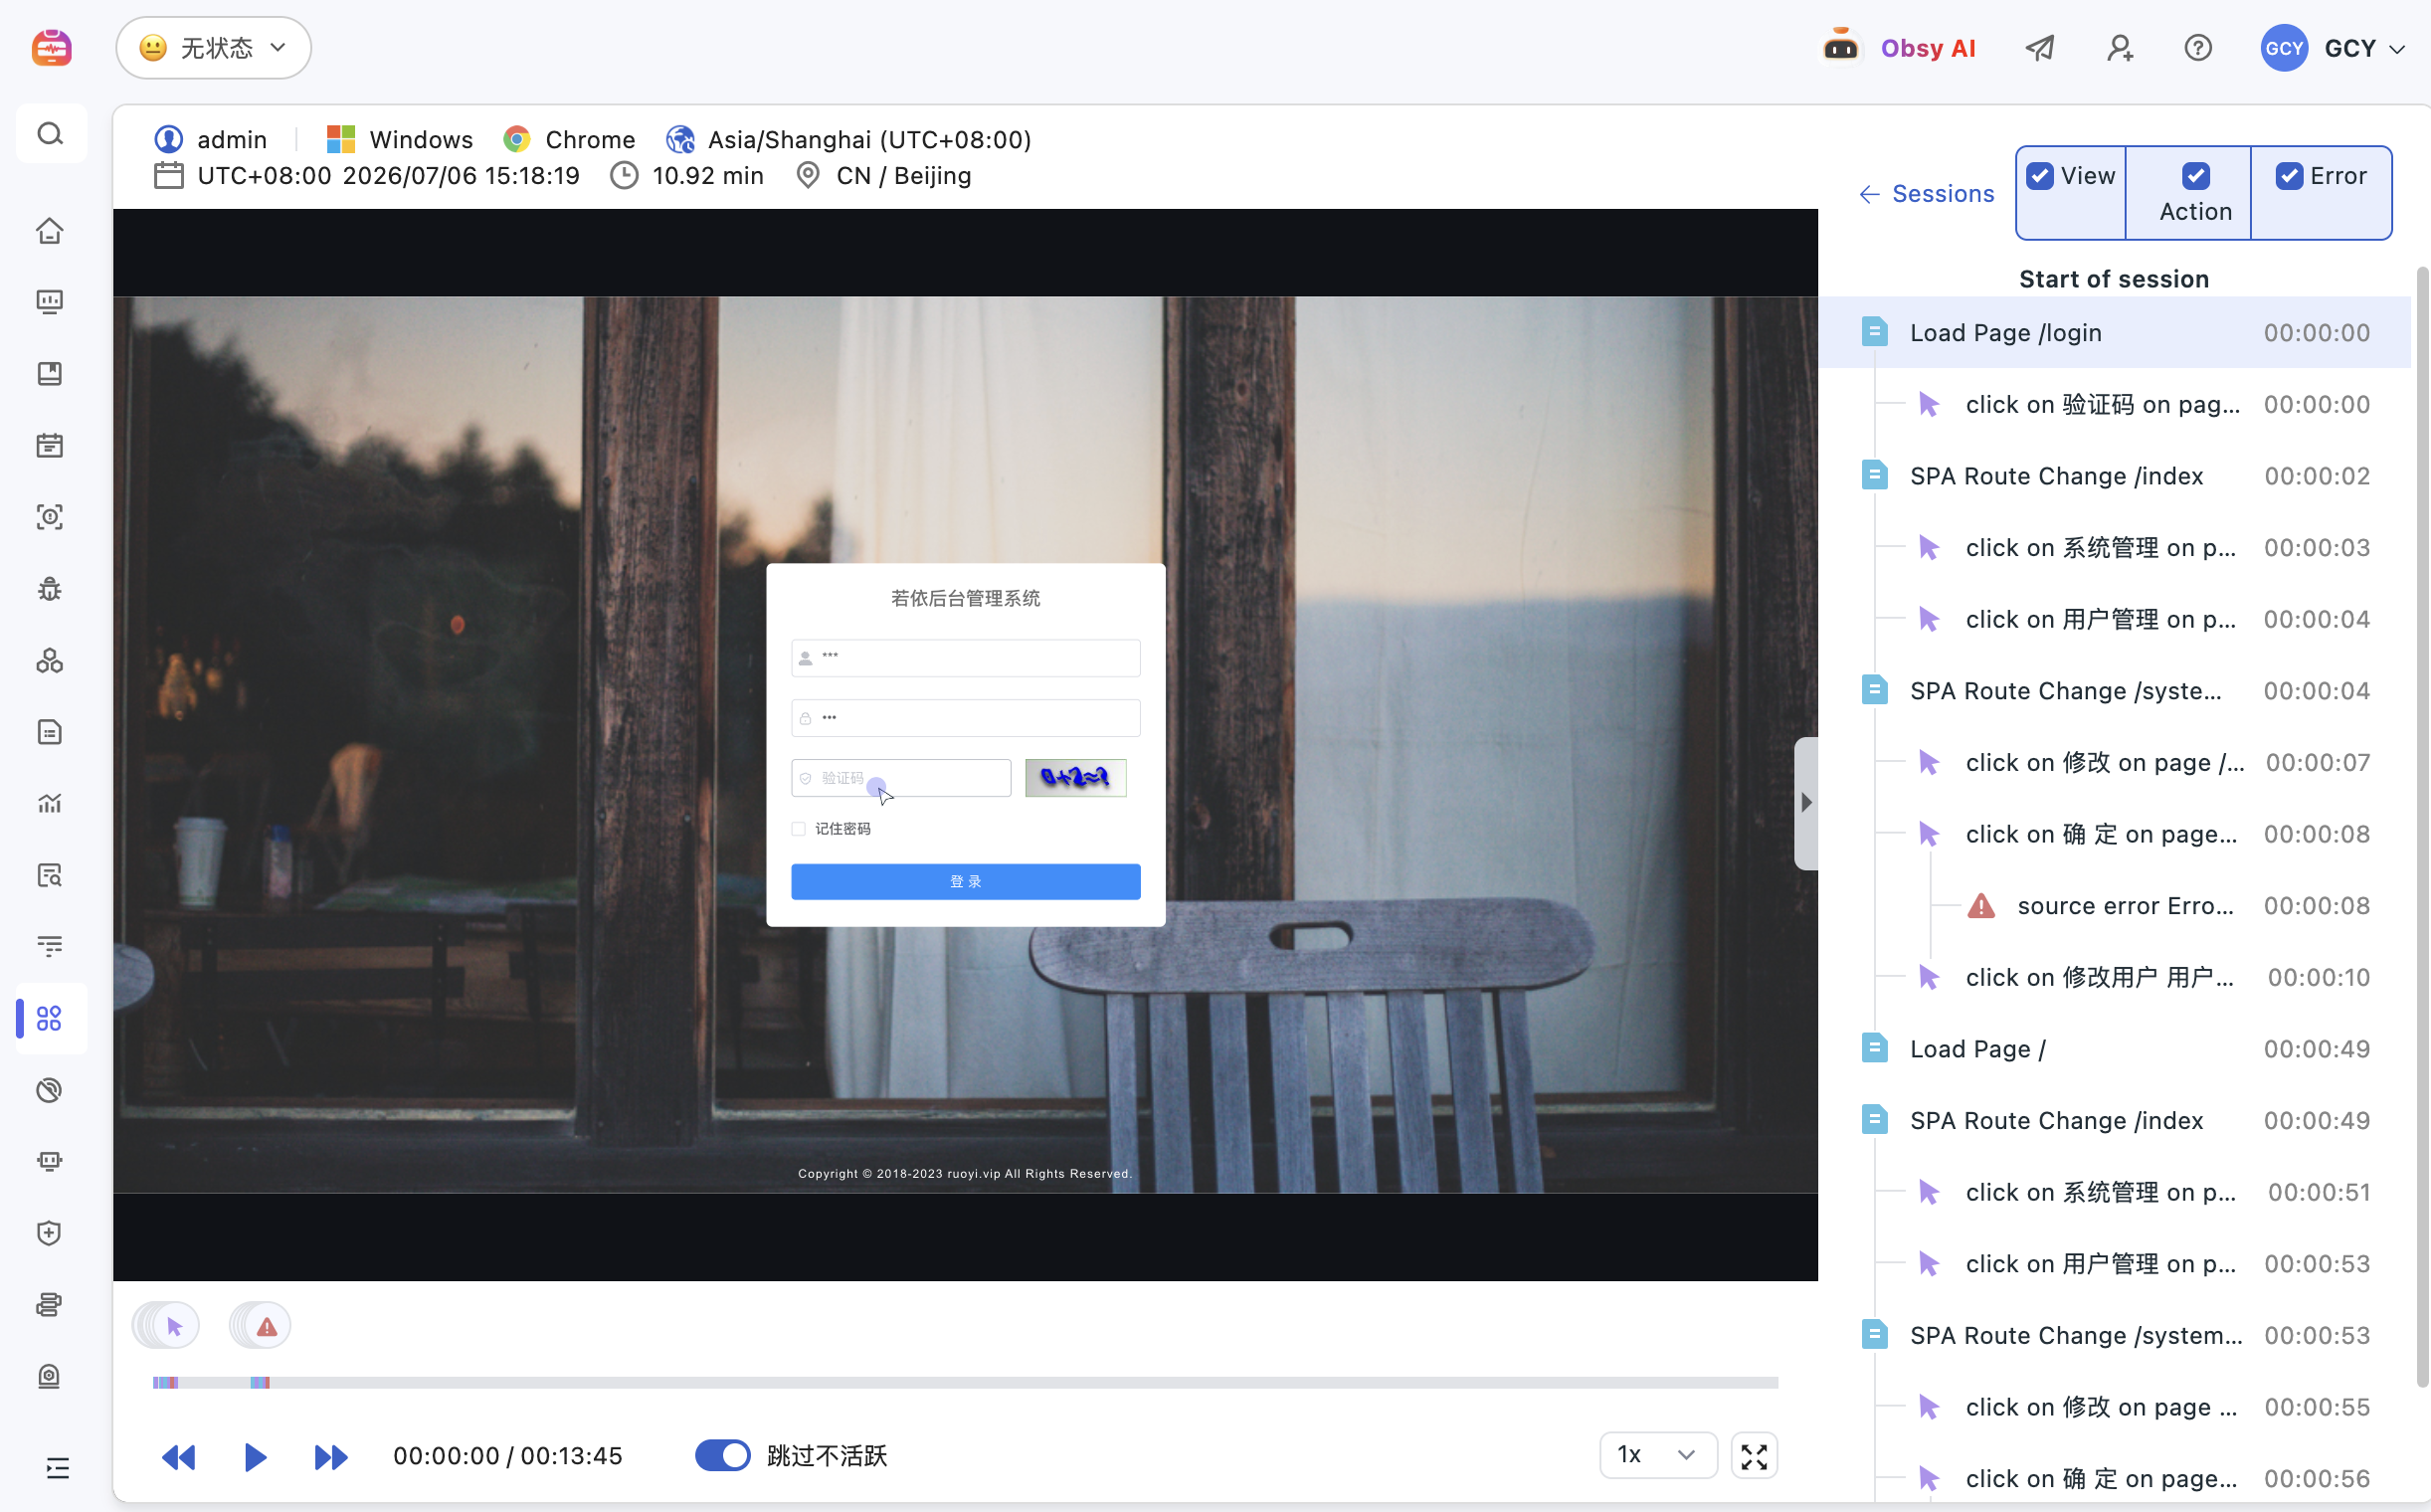
The AI eraa comprehensive data observation platform

Unified collection, storage, query, and display ensure all data is understood and utilized

"Guance" covers full-link monitoring and observation across apps, web, backends, middleware, infrastructure, and cloud platforms, integrating 650+ mainstream technology stacks and cloud services. It connects development, operations, SRE, security, and business teams, breaking down data silos. Centered on massive data and unification, it enables enterprises to achieve unified data collection, storage, query, and display, and transforms scattered signals into judgmental, collaborative, and actionable contexts.

Unified data platform

A unified platform stores all your system data

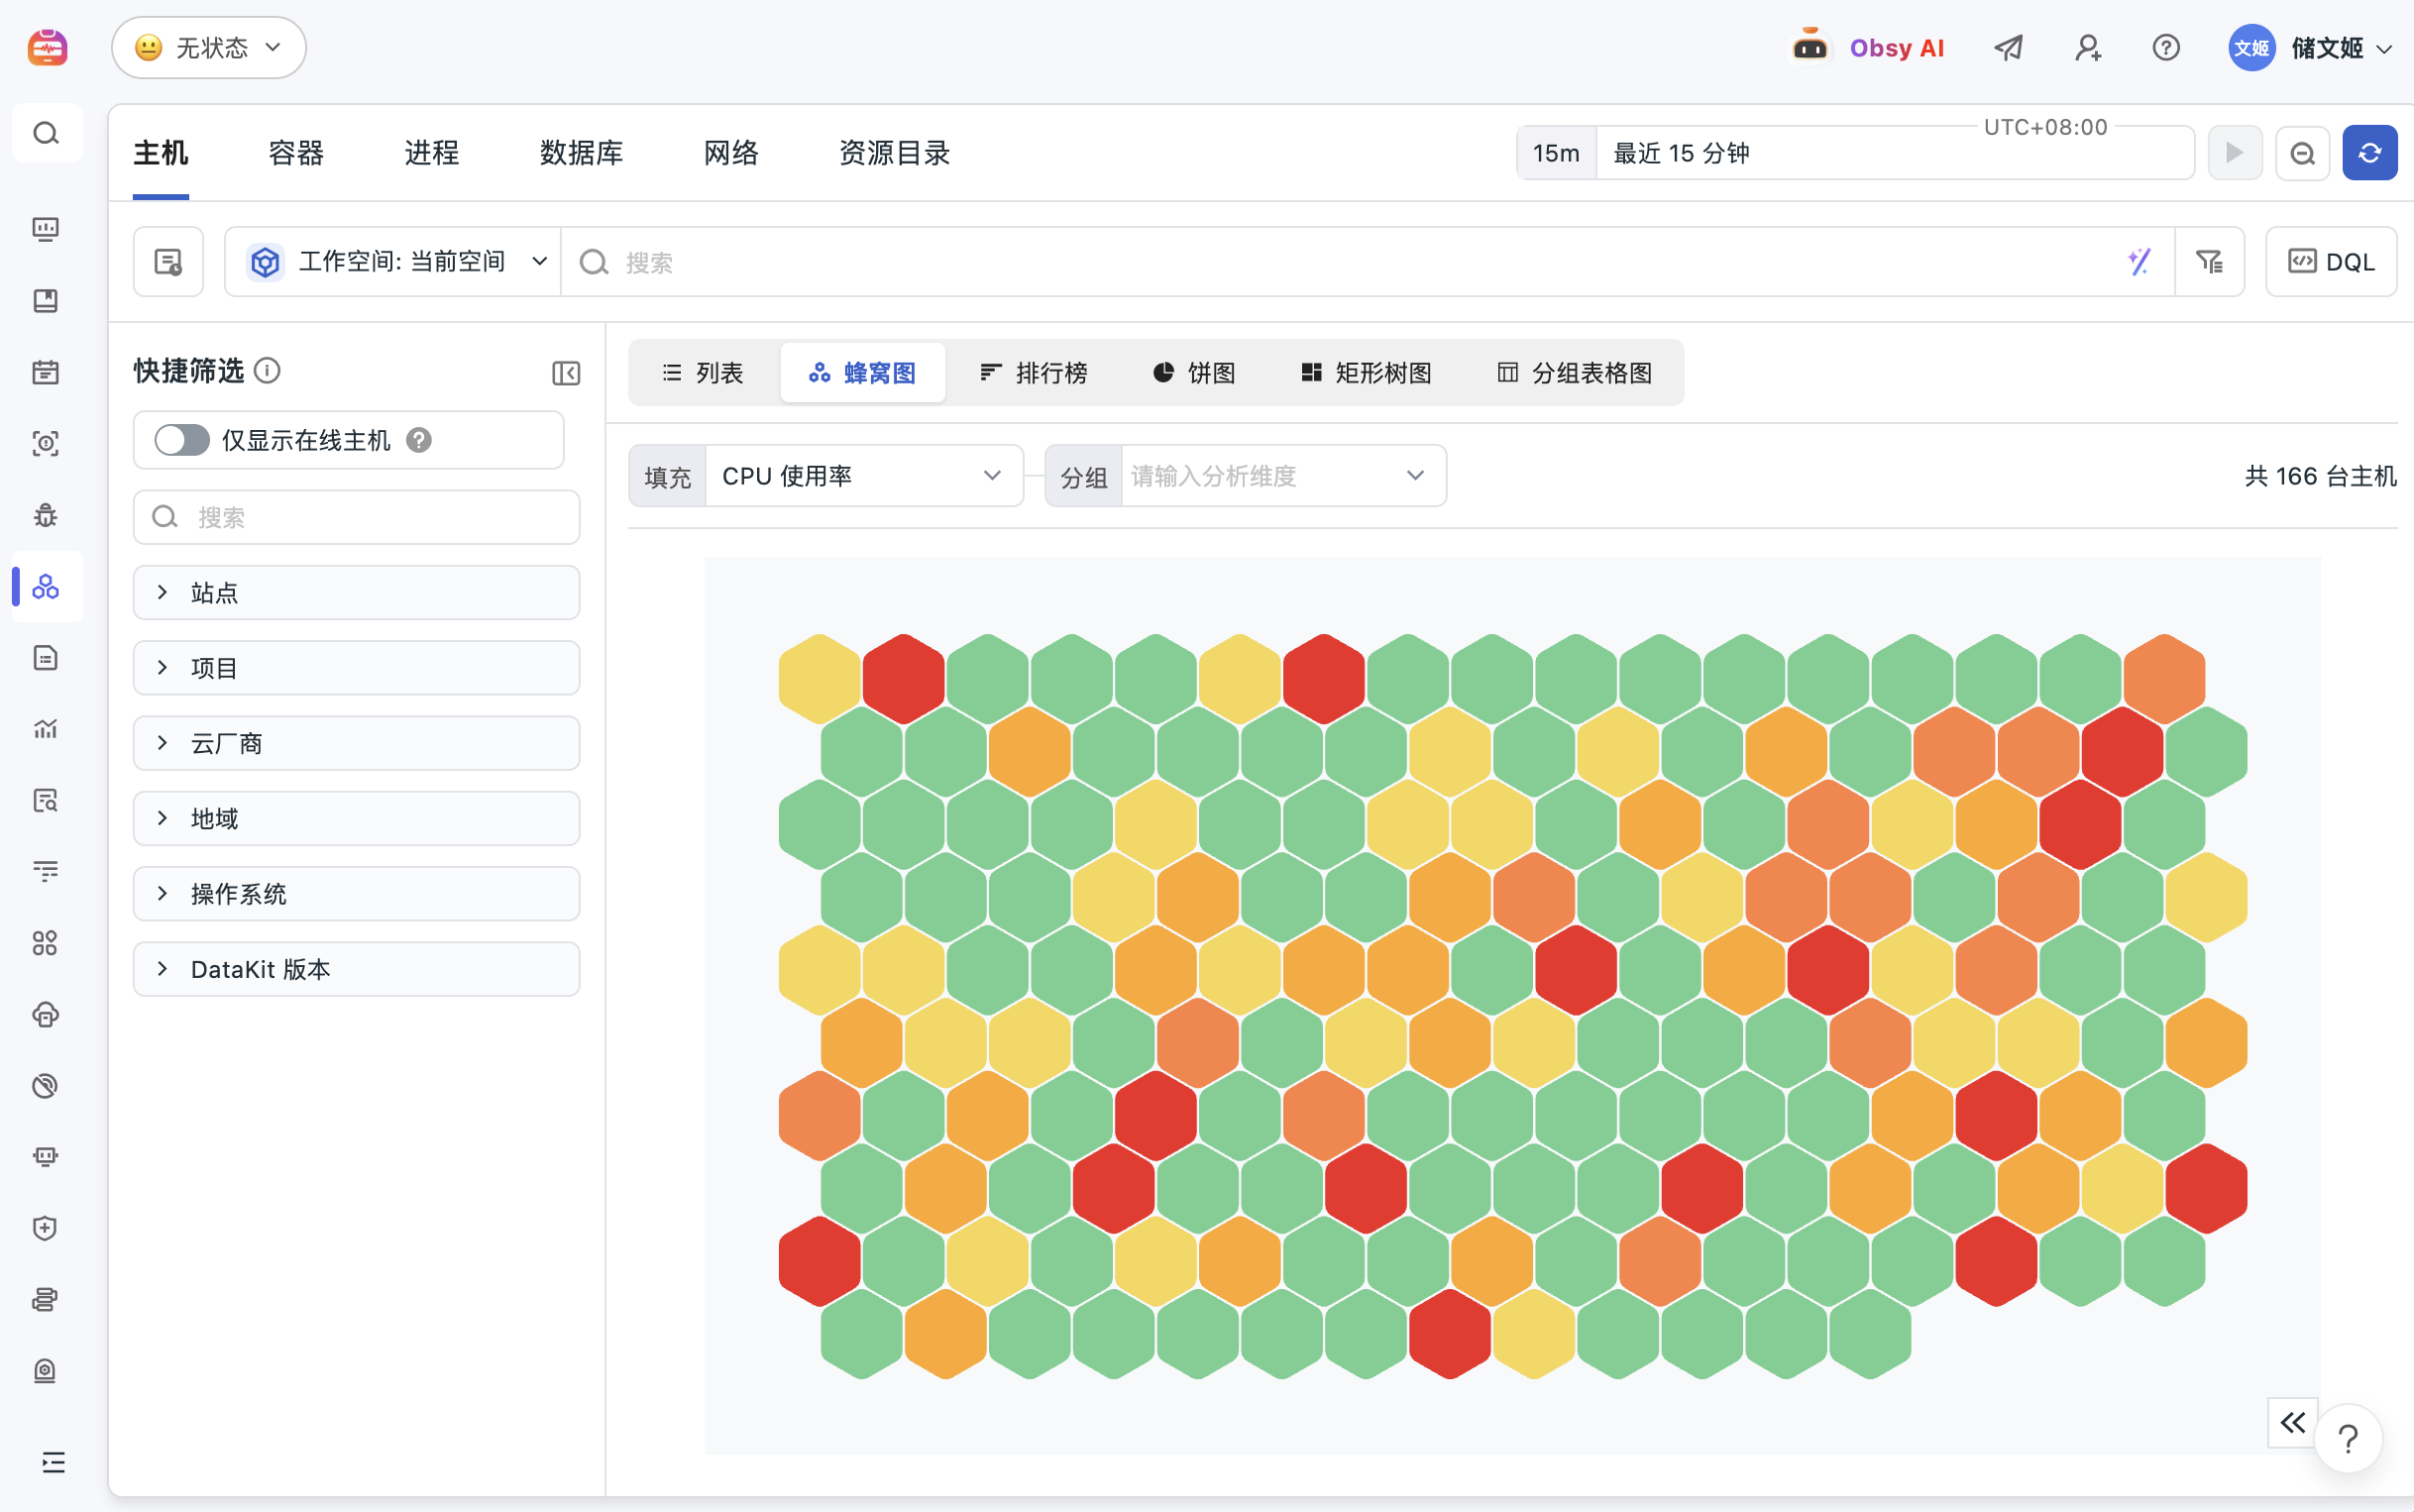
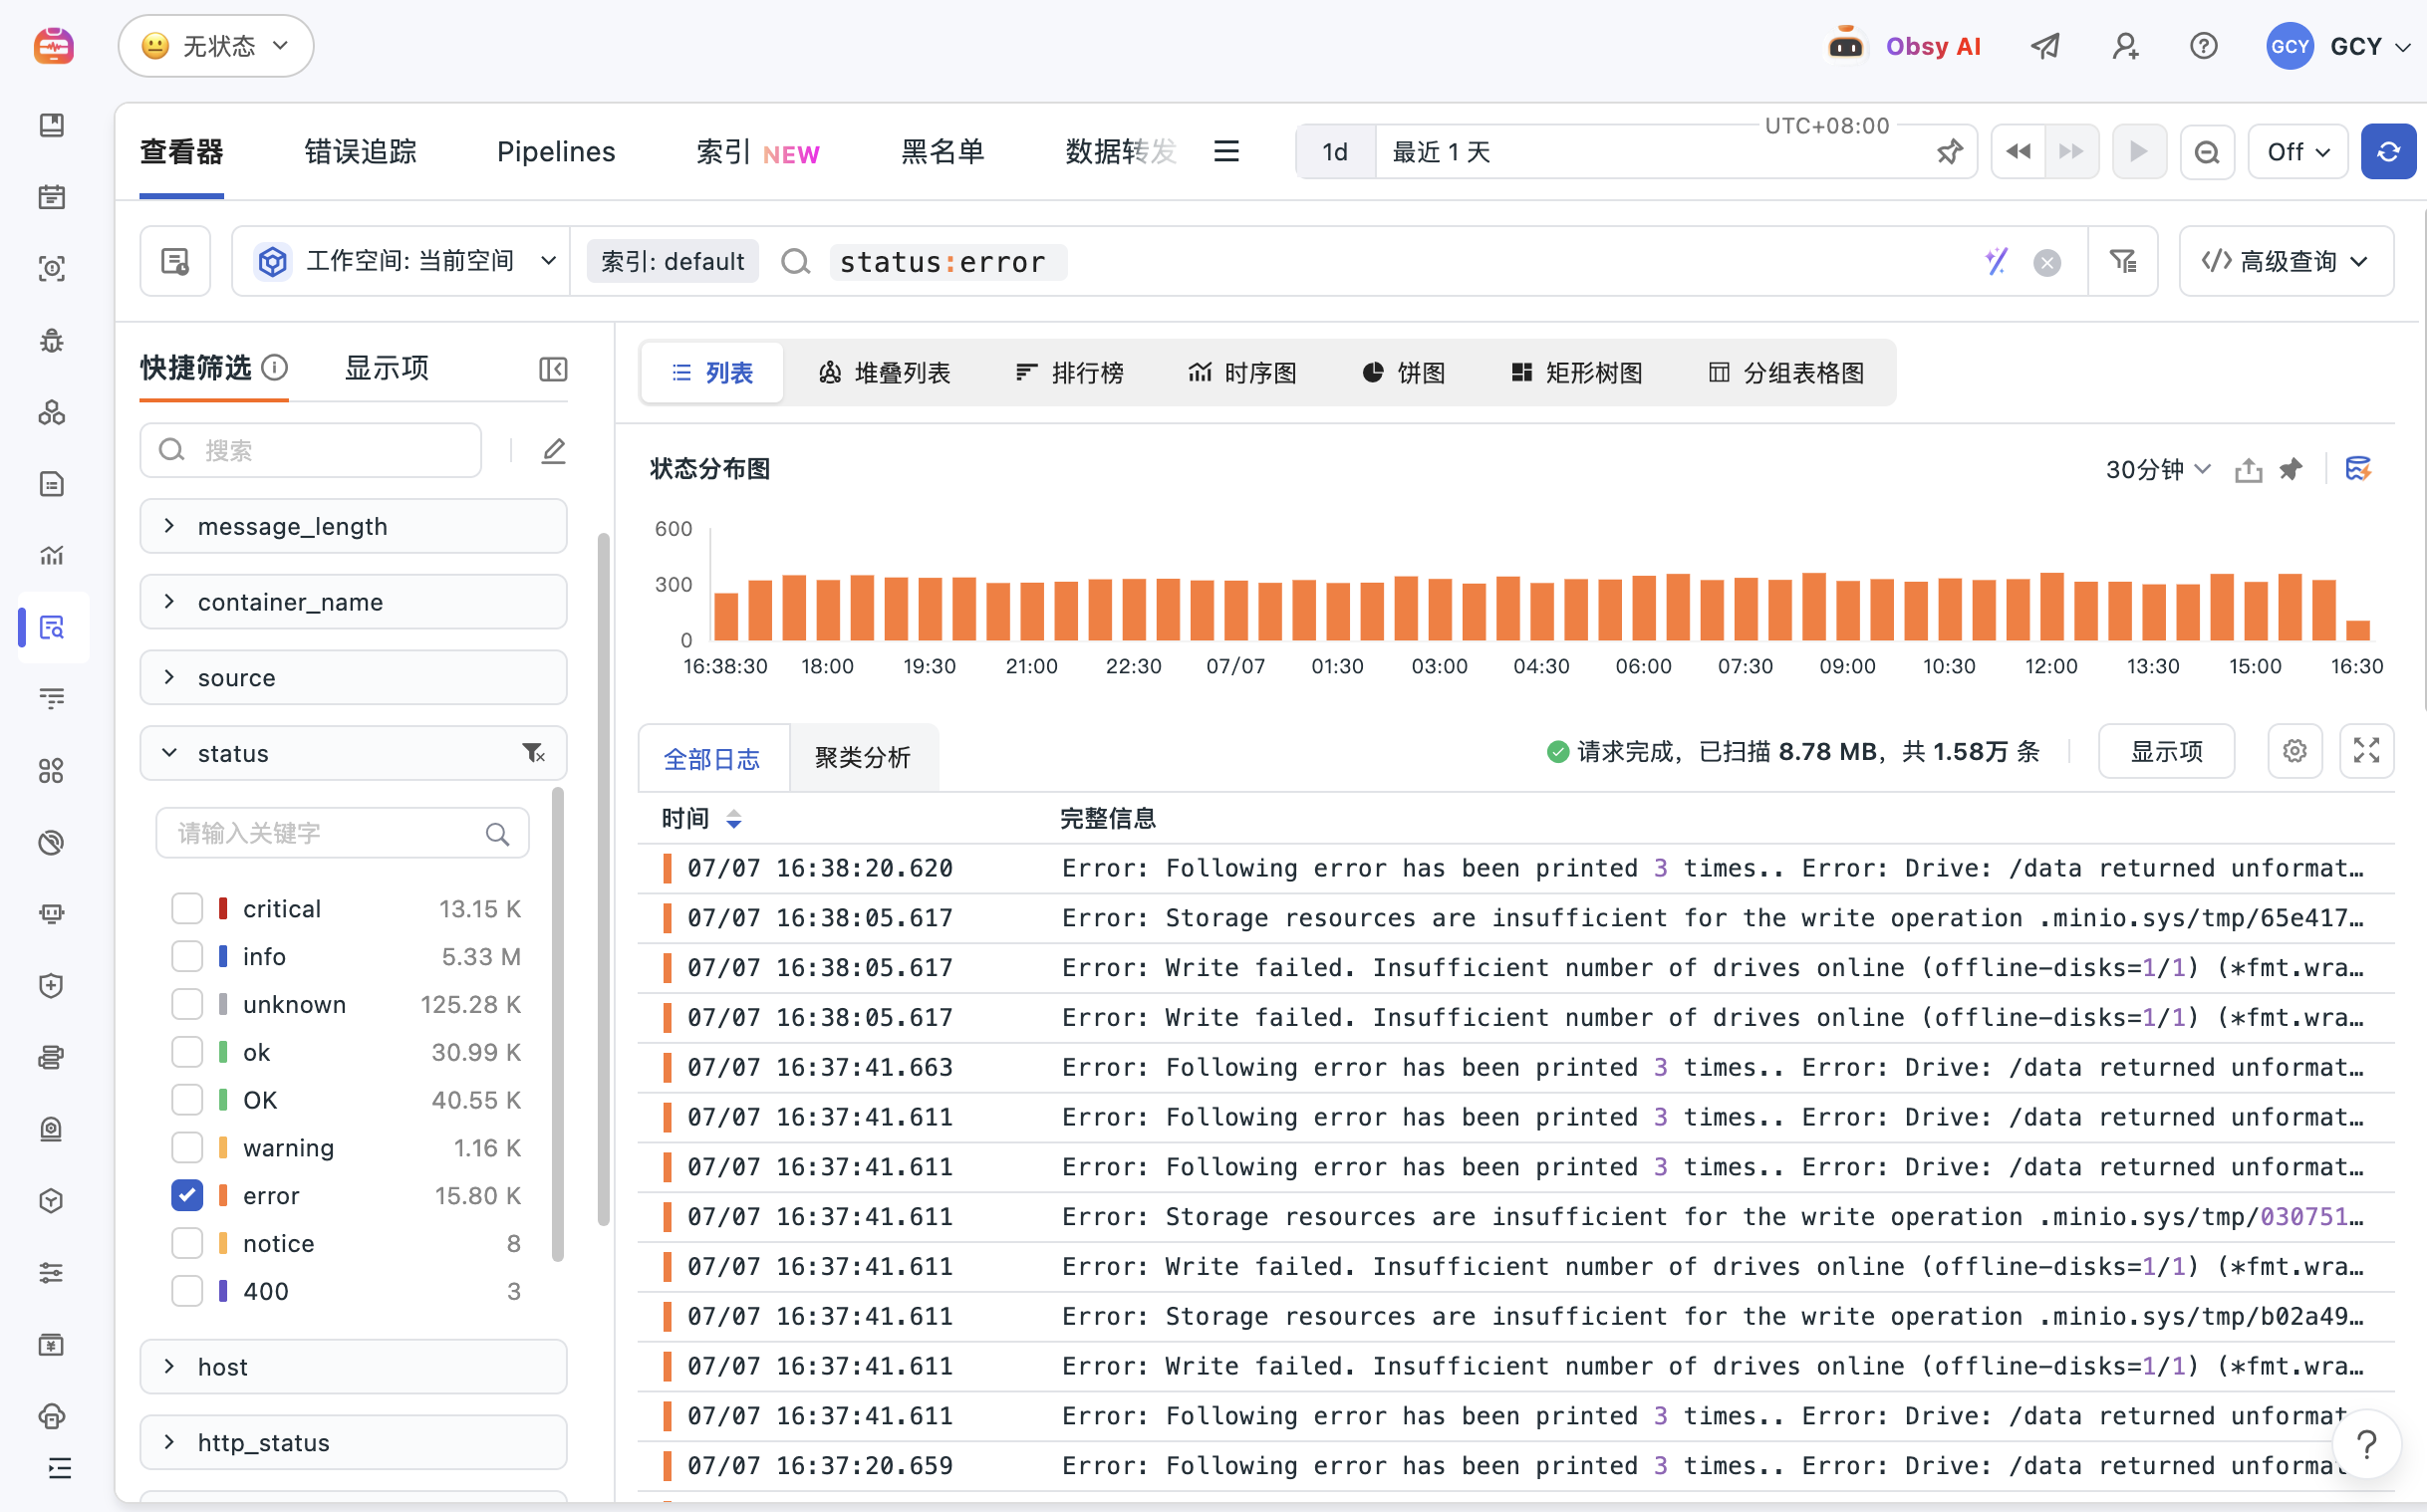
Connect scenarios, infrastructure, logs, application performance, and user experience data within a single workspace, enabling different teams to analyze based on unified time, objects, and business contexts.

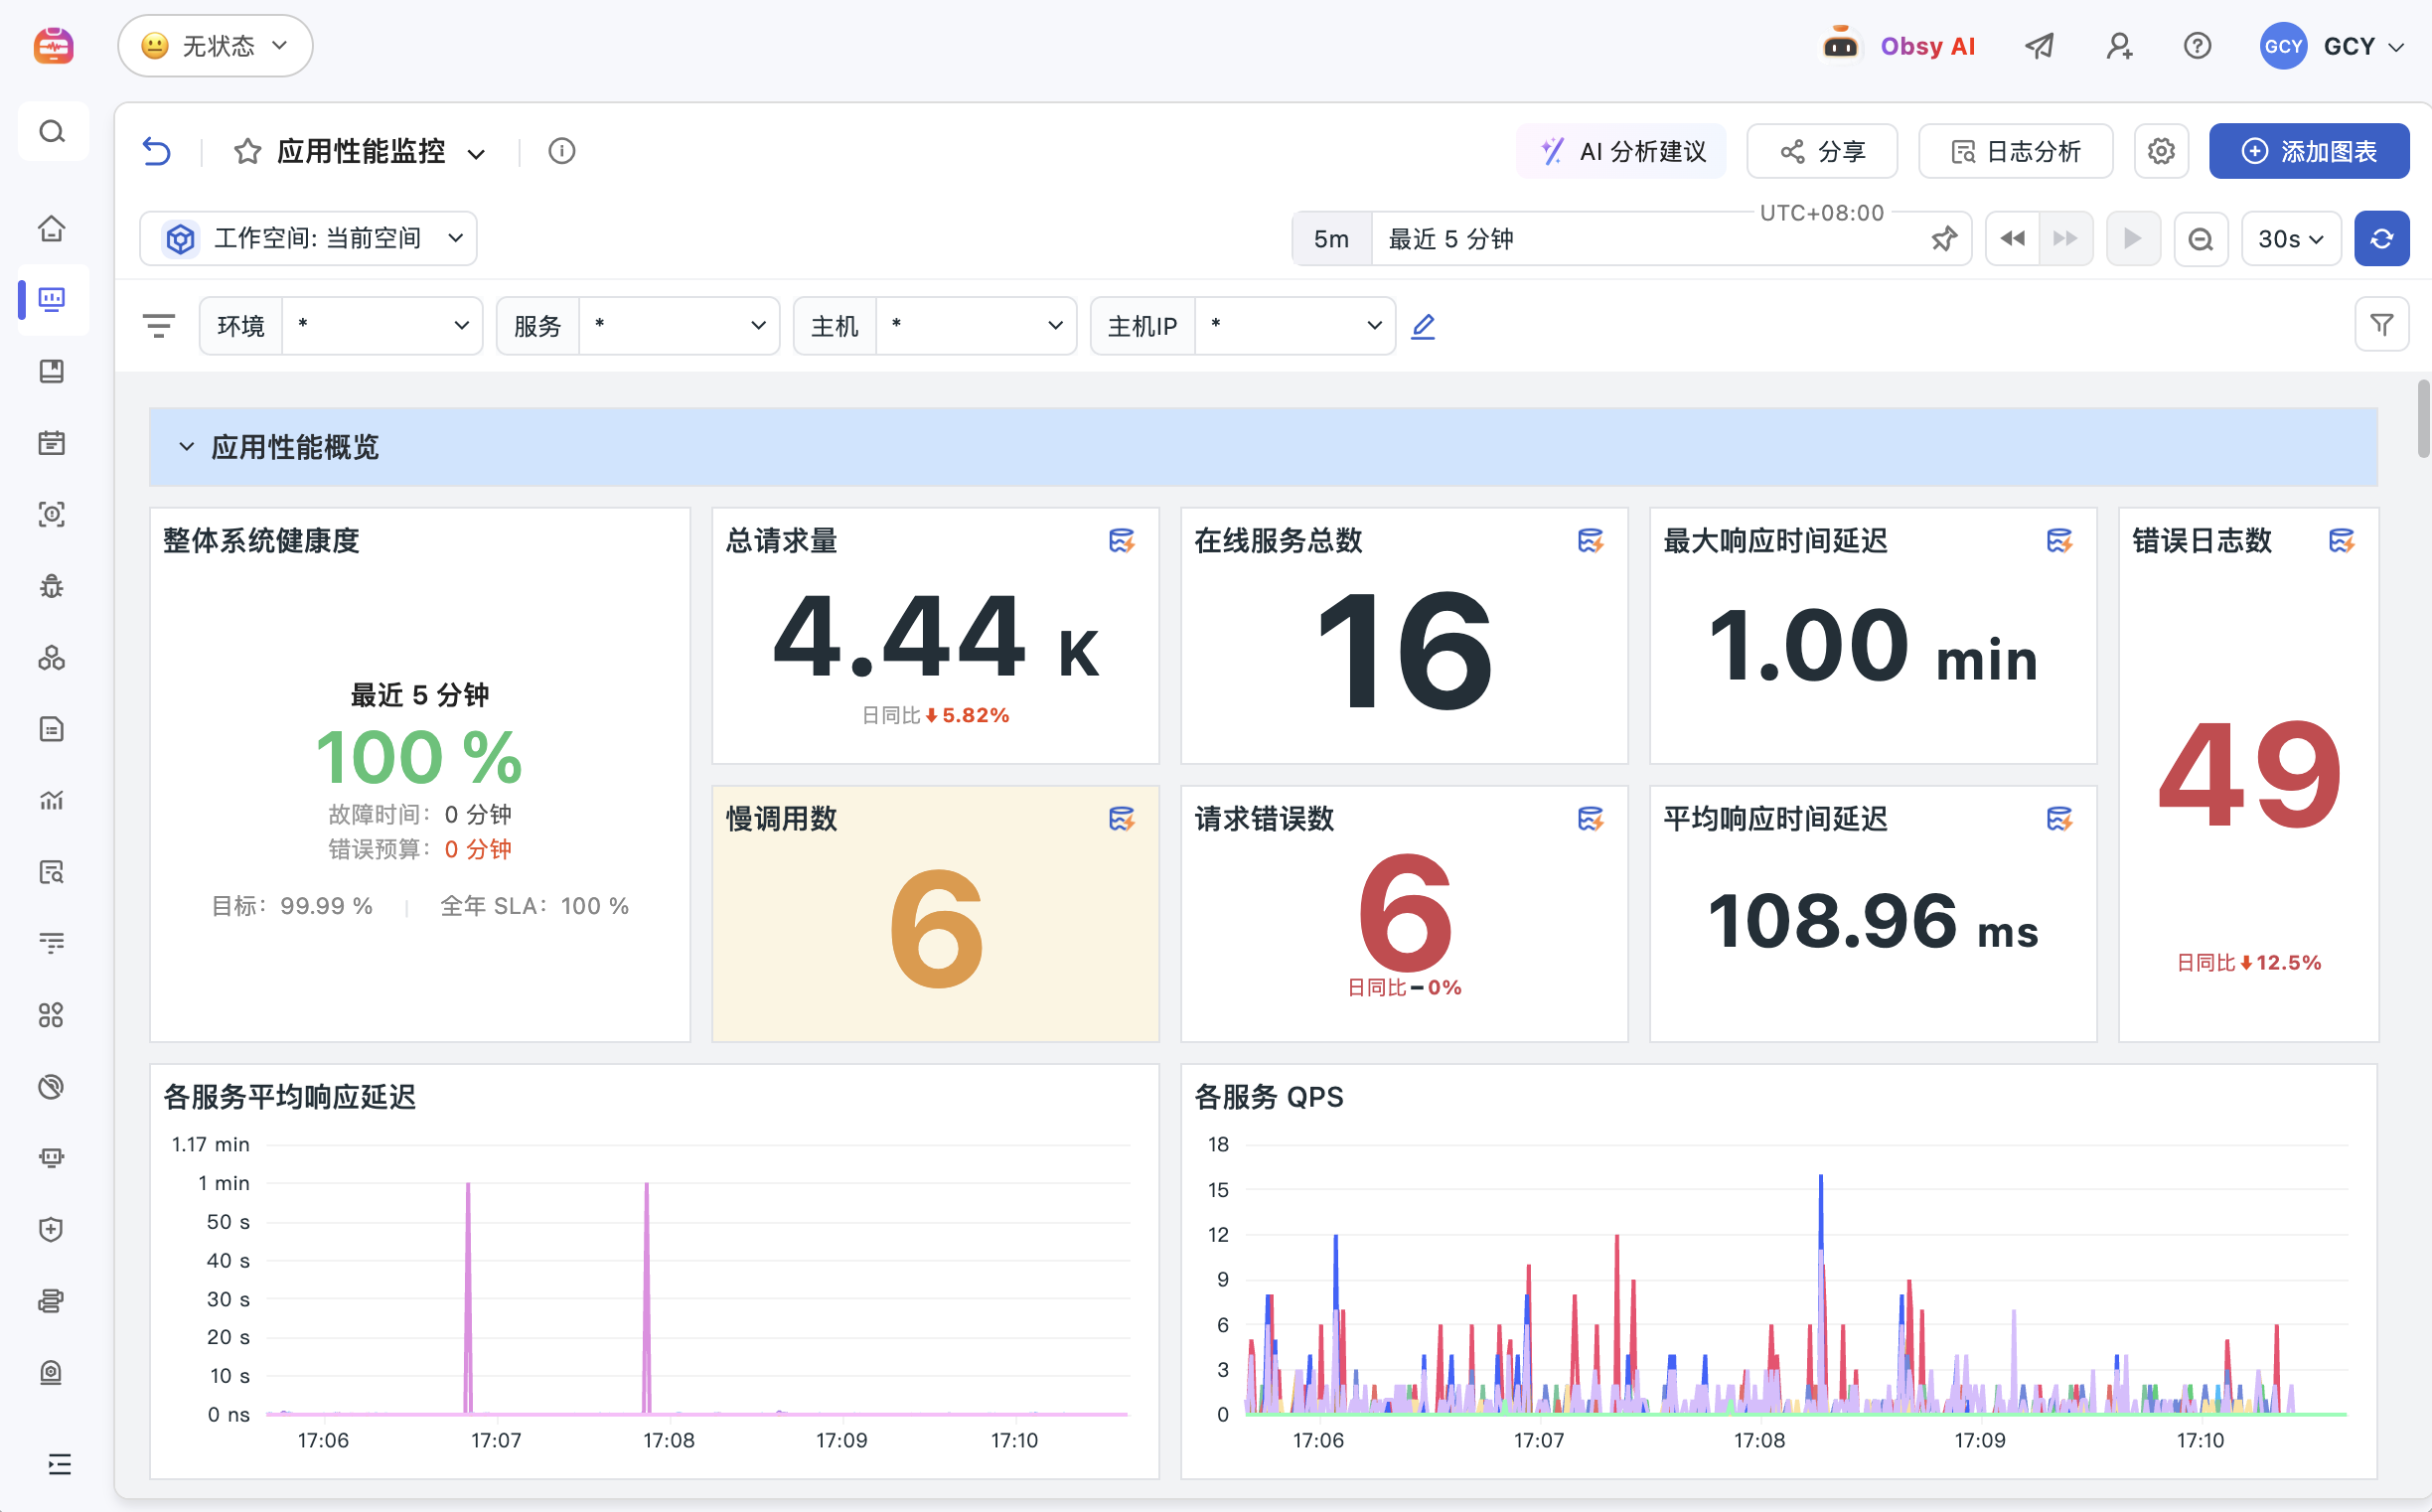
Guance Data Insight Dashboard to uniformly display system health, request volume, service, latency, and error metrics

Use cases

Use a unified dashboard to monitor system, application, and business status

By placing request volume, online services, error rates, response delays, and business metrics in the same window, it helps R&D, operations, SRE, and business teams assess system status based on the same data.

Core capabilities

  • Display key metrics across data sources in a unified manner
  • Filter by environment, service, host, and business tags
  • Move from the global overview to specific analysis scenarios
View data insights products

Guance product capabilities

Comprehensive capabilities covering everything from data collection and monitoring analysis to fault response

From infrastructure, Kubernetes, APM, logs, metrics, and RUM, to alerts, events, data governance, and AI Agent, products are introduced according to real-world scenarios.

Unified observable workflow

From data access to fault handling, a complete observation link is connected

Guance connects data collection, unified storage, associated queries, visual analysis, alert events, and AI-assisted troubleshooting, helping R&D, operations, SRE, security, and business teams collaborate around a single observable data.

Unified data

Let the data speak

Through DataKit, OpenTelemetry, Prometheus, log collection, cloud vendor integration, and open API access metrics, logs, links, RUM, profiles, event and business data, distributed signals are first unified into a trusted data foundation.

Relate context

Let the context connect

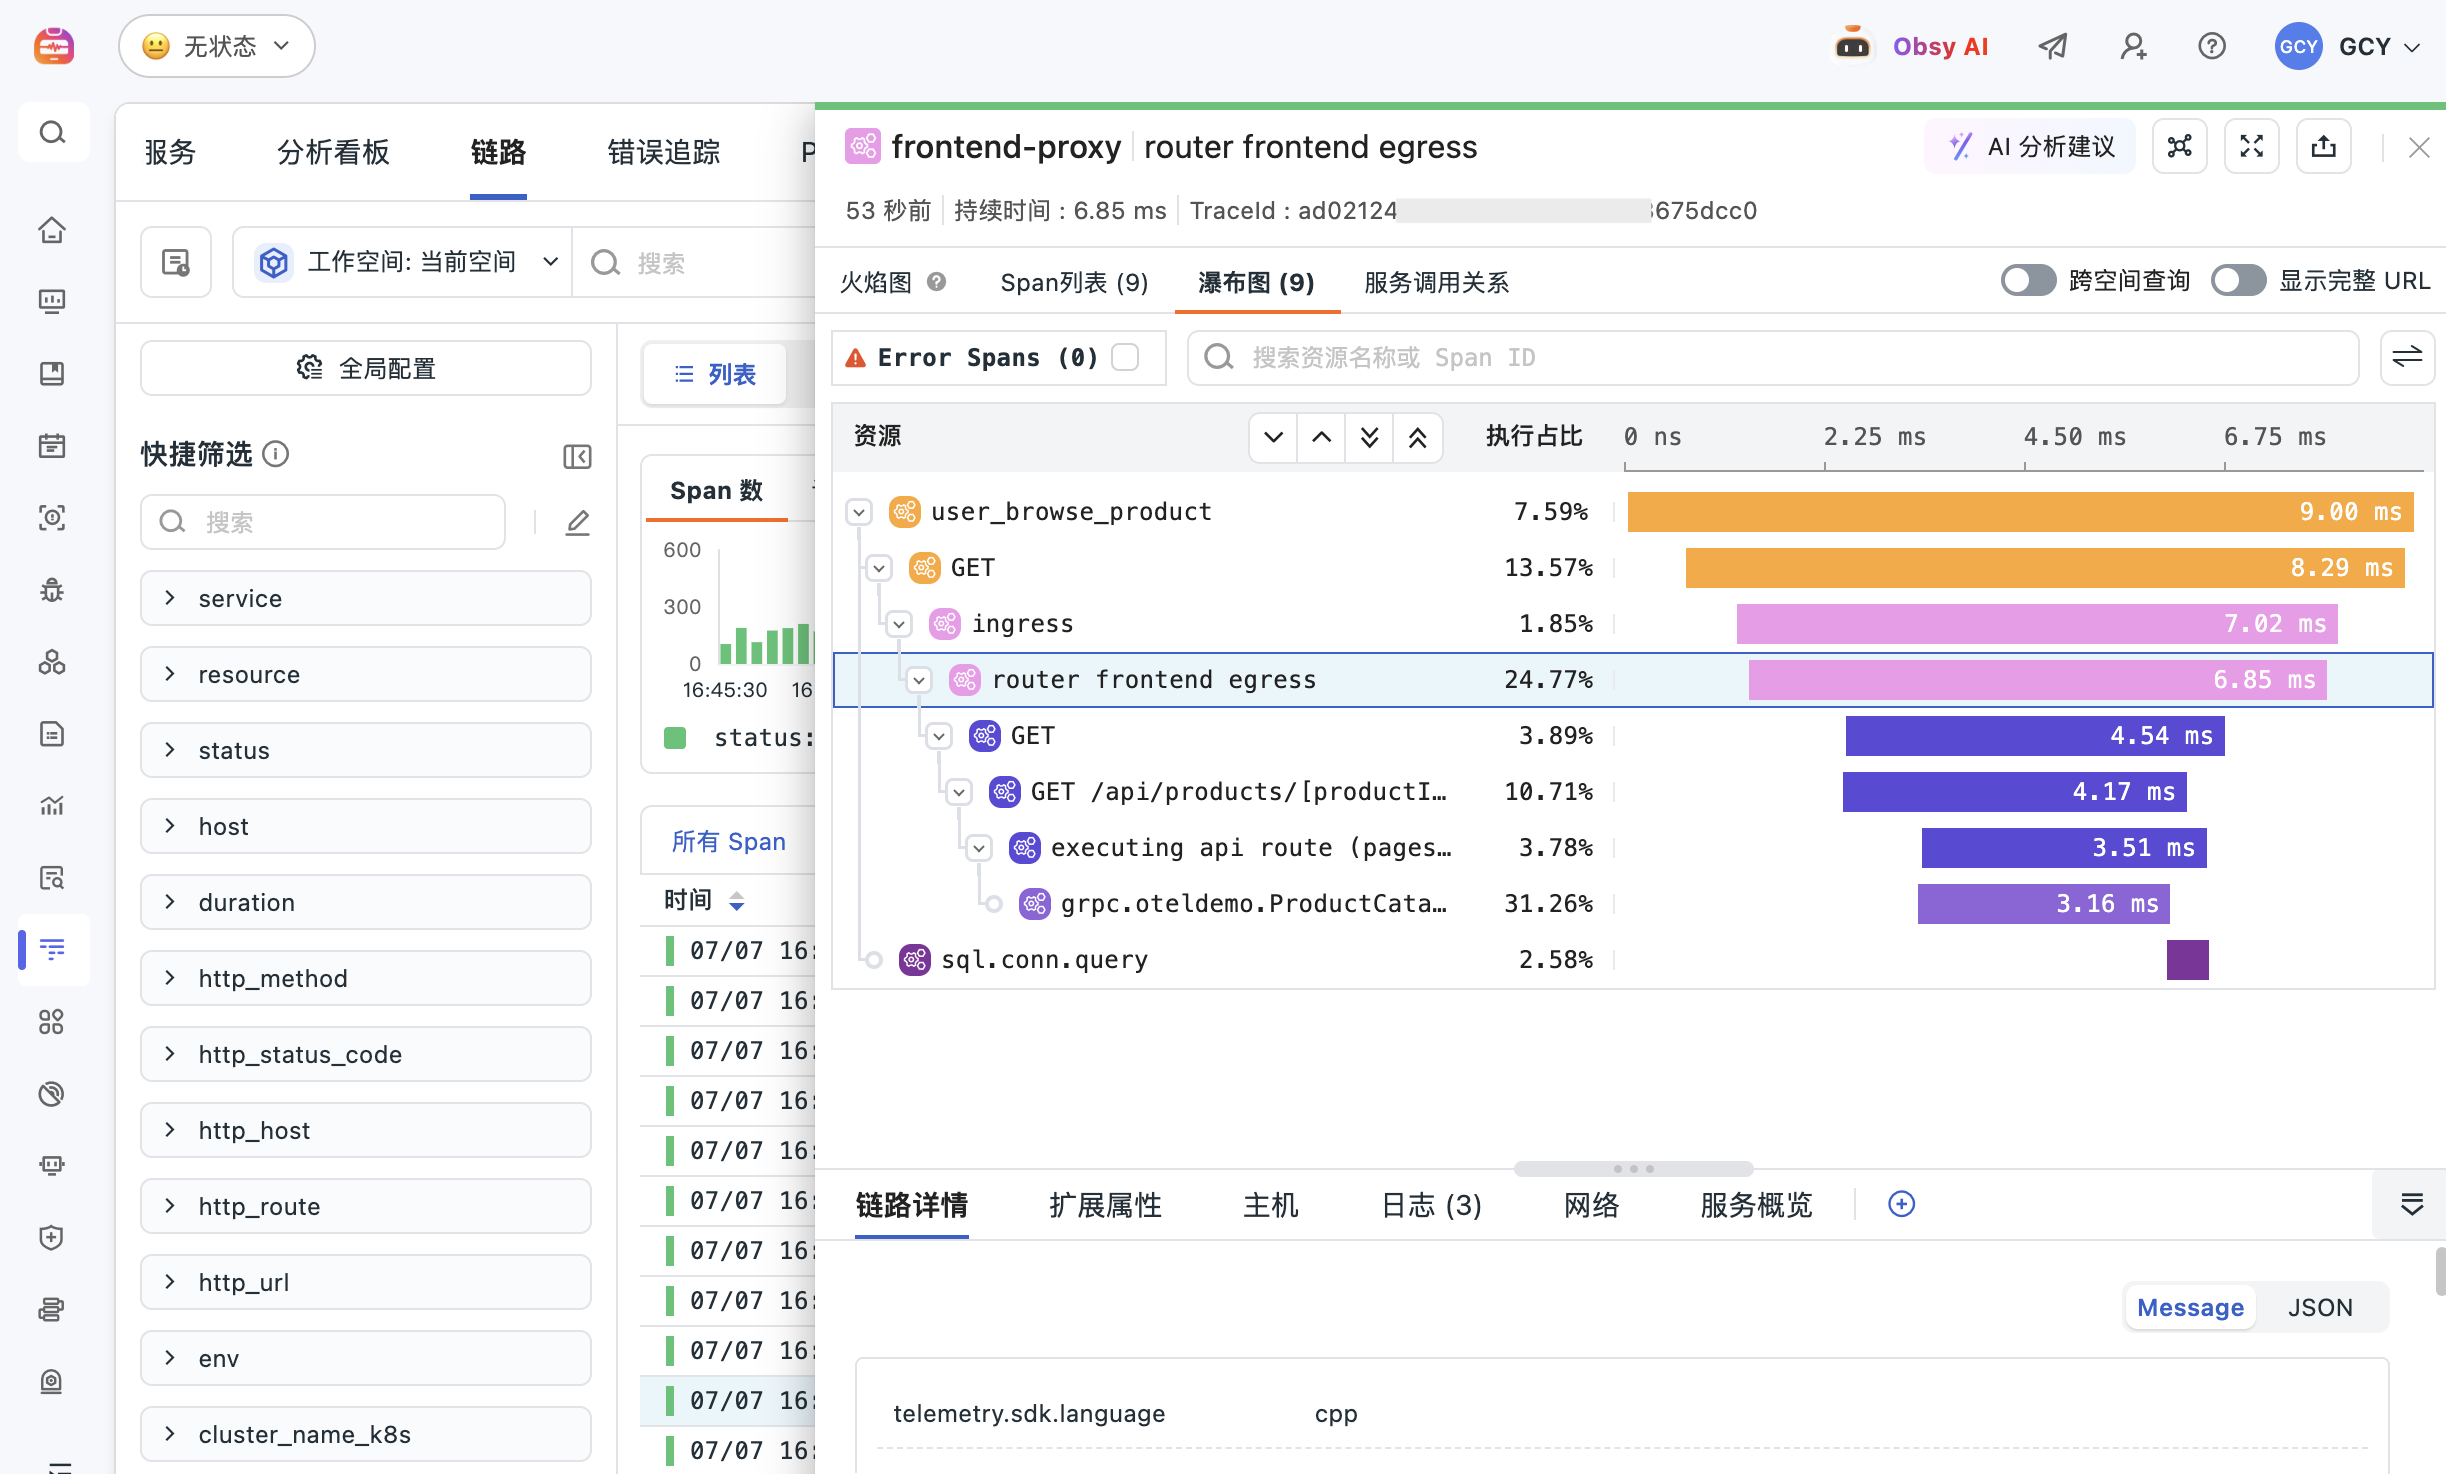
Centered around unified tags such as service, host, pod, env, version, region, and trace_id, APM, log monitoring, Kubernetes monitoring, RUM real user experience monitoring, and cloud resource status are all integrated into the same troubleshooting chain.

Collaborative decision-making

Let the team make decisions

R&D, operations, SRE, security, and business teams can see the same facts in dashboards, viewers, alerts, event centers, and notes, reducing the cost of copying timestamps, screenshots, and query conditions across tools.

AI and Agent

Let Agent take action

Obsy AI, OWL CLI, MCP Server, and Agent Teams can read observable data in the authorization context, assisting in summarizing phenomena, locating root causes, generating troubleshooting recommendations, and distilling processing experience into reusable knowledge.


Frequently asked questions