






Contact us

Join the community

Scan with WeChat
Join the official community group

Try Guance

Start online with usage-based pricing and a true cloud service.

Get started

Choose a Guance edition

Code repositories

Prometheus & Grafana Alternative Guide

Prometheus + Grafana alternative: Retain the metric stack and fill in the observable context

For teams already using Prometheus to collect metrics and query and display with Grafana, assess when to continue building in-house, when to use Remote Write to access a unified observable platform, and how to avoid risks from one-time replacements.

  • Prometheus Remote Write
  • PromQL with labels
  • Grafana dashboard
  • Log Trace and RUM
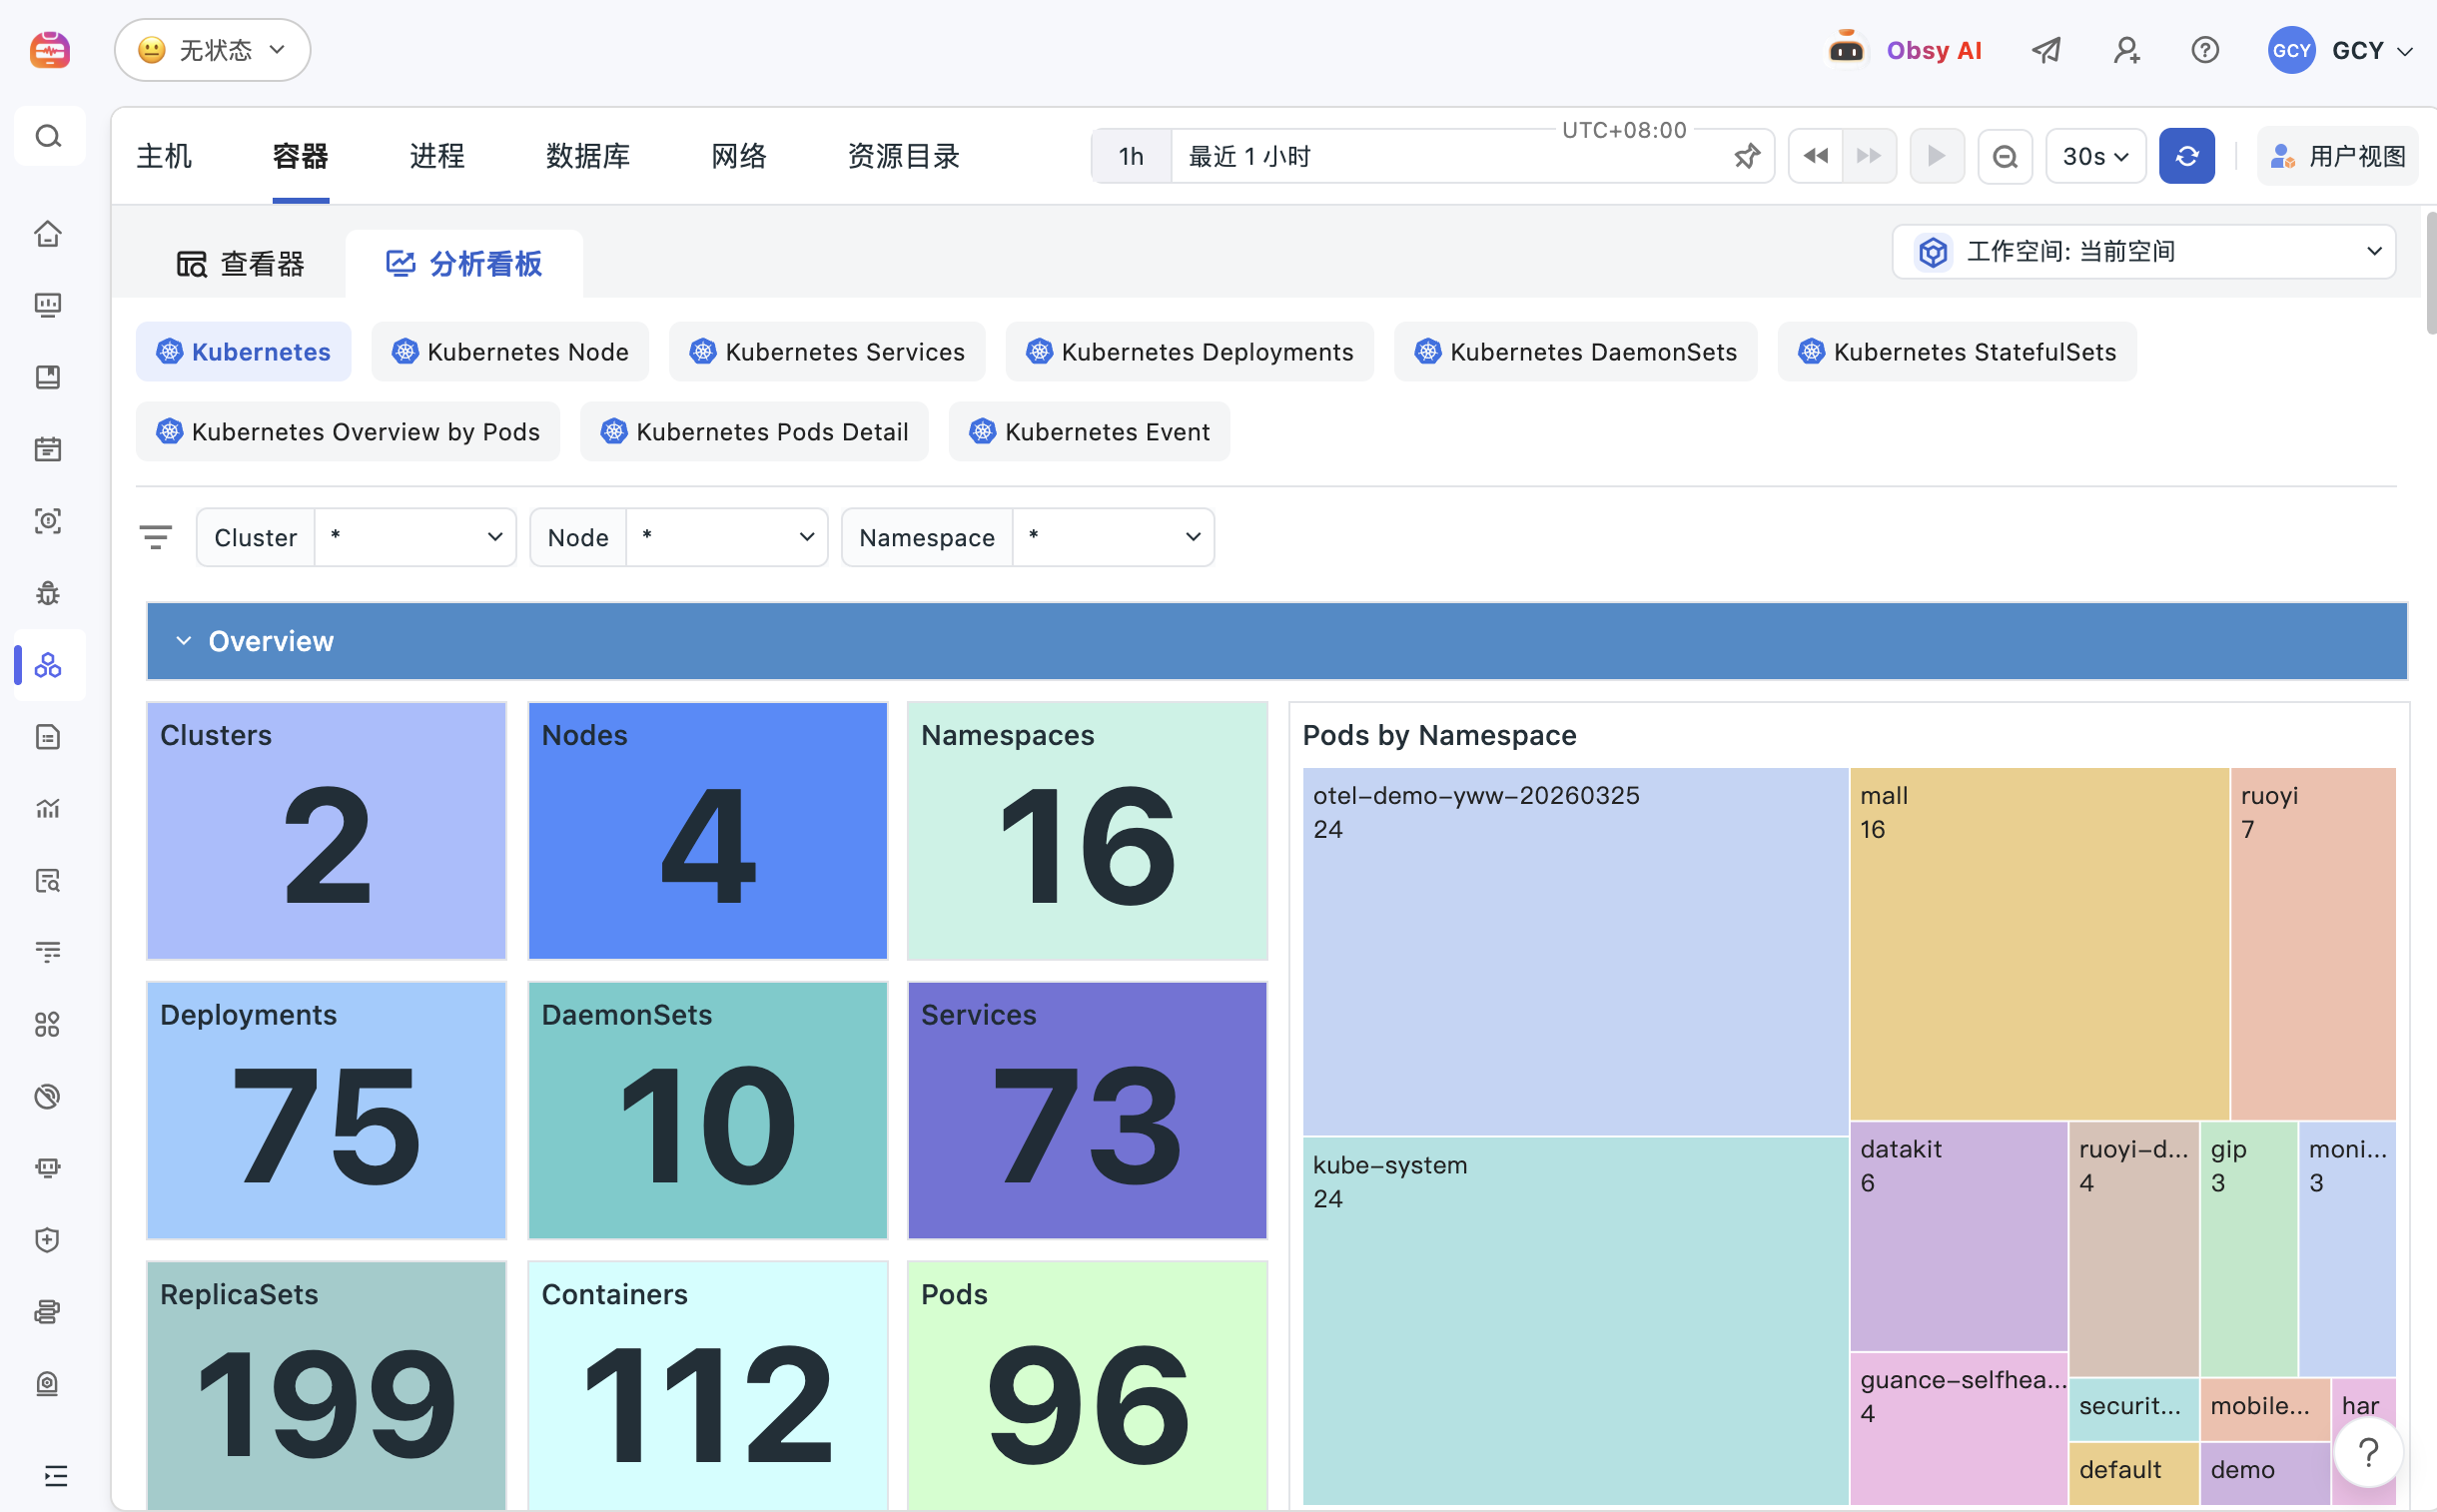
Guance Kubernetes Cluster and Container Analytics Kanban
Product evidence

Retain existing metric collection, and verify whether metrics, logs, links, and events can be associated through real Kubernetes failures.

Prometheus and Grafana usually do not need to be replaced in one go

Prometheus excels at metric collection and PromQL, while Grafana excels at connecting data sources, queries, visualization, and alerts. Teams can retain Exporter, Prometheus rules, and existing dashboards, integrate metrics into remote platforms via Remote Write, and then fill in logs, traces, Kubernetes, RUM, events, and long-term governance according to real troubleshooting needs.

Continue to build a more reasonable situation

  • The scale and retention period of indicators are controllable, and single clusters or a few clusters can operate stably
  • The platform team is familiar with PromQL, rules, capacity, and upgrade maintenance
  • The main current issue is metric visualization, without the need for cross-data troubleshooting

It is suitable to assess the situation of a unified platform

  • Multi-cluster, multi-cloud, and multi-team governance of tags, rules, permissions, and capacity are becoming more complex
  • Even after metric alerts, you still need to switch between logs, traces, pods, and cloud console troubleshooting
  • Long-term storage, alert collaboration, event review, or RUM business impact become gaps

Use the same standards to judge whether a platform is truly suitable for the team

01

Take stock of Prometheus instances, Exporter, ServiceMonitor, Recording Rule, and Alerting Rule

02

Identify high base tags, sampling frequency, retention cycle, query peak, and long-term storage requirements

03

Record Grafana data sources, dashboards, variables, permissions, and notification policy dependencies

04

Validate Remote Write queues, fail retrys, filtering rules, and network boundaries

05

Use real alerts to check whether metrics can continue to correlate logs, traces, pods, publishing, and user experience

Don't just compare functions, but compare the real workflow after a failure

Assessment dimension
Continuing with Prometheus + Grafana
Unified analysis of access Guance
Existing collection
Retain Exporter, ServiceMonitor, PromQL, and rules
It can be accessed via Prometheus Remote Write without rewriting the collection system first
Storage and expansion
Prometheus local storage is managed by a single node, and remote capabilities require separate planning
After the indicators enter the unified platform, they are then planned for retention and query based on actual packages and data strategies
Visualization and query
Grafana connects different data sources and offers Explore, dashboards, and alerts
Analyze metrics in a unified object context and continue correlating logs, traces, RUM, events, and cloud resources
Migration risk
Maintaining the existing link is the most reliable
First perform Remote Write doublewrite and result validation, retaining the original query and alert as the rollback path
01

First, acknowledge that Prometheus and Grafana have each solved problems very well

Prometheus officially designs local time-series storage and Remote Write interfaces separately; Grafana officially defines data sources as entry points connecting to external storage and used for queries, visualization, and alerts. Alternative assessments must respect these existing capabilities.

  • Retain Exporter, PromQL, Recording Rule, and alert rules
  • Preserve the valuable Grafana dashboard and troubleshooting habits
  • Only migrate parts that have been slowed down by capacity, maintenance, or context issues
02

Use Remote Write to take the first step of rollback

Prometheus Remote Write is an open specification. Guance DataKit can receive Remote Write data and supports filtering by metric name, making it suitable for a period of dual-write validation.

  • Choose a Prometheus instance or namespace to start
  • Limit the scope of the initial indicators and labels to avoid unplanned expansion of the base
  • Monitor queue backlog, failed retrys, data integrity, and time bias
03

The ultimate goal is not to replace the dashboard, but to shorten the chain of fault evidence

When CPU, latency, or error rate alerts appear, the team needs to continue monitoring service traces, related logs, Pod events, release changes, and user experience. Only when this chain is shorter does a unified platform generate real value.

  • Associate Kubernetes objects and services from Prometheus metrics
  • Continue drilling into logs, traces, and timeline changes from alerts
  • Integrate event handling, collaboration, and review into the same process

First, validate a high-value scenario, then expand the scope of migration

  1. Export Prometheus instances, rules, tag bases, retentions, and Grafana dependency lists
  2. Configure Remote Write for a low-risk environment and retain the original link
  3. Compare key metrics, tags, timestamps, PromQL results, and alert triggers
  4. Replay a real Kubernetes or application failure once to verify cross-log and trace drilling
  5. Quantified acceptance conditions for stopping, rollback, and expanding the scope

Frequently asked questions

Will Guance replace Prometheus Exporter?

Not necessarily. Teams can continue using existing Exporter and Prometheus, sending selected metrics to DataKit via Remote Write; Whether to adjust the collection method should be determined by operational responsibilities and data governance needs.

Do you still need Grafana after using Guance?

If existing Grafana dashboards and team habits are still valuable, they can be retained. The focus of evaluation is not interface replacement, but whether metrics can more naturally correlate with logs, Trace, Kubernetes, RUM, and event context.

What should be monitored in Remote Write dual writing?

It is necessary to monitor queue backlog, failed retrys, network throughput, metric filtering, tag base, timestamps, and query result consistency, while retaining the original Prometheus as the rollback path.

Evaluate with your real surveillance scenariosGuance

Bringing current tools, data volume, core fault scenarios, and team goals, we will combine your existing technology stack with actual operations and maintenance processes to help you assess access scope, unify observation paths, and prioritize implementation.

Schedule a technical consultation