






Phone:400-882-3320


Dedicated Query Compute - Large
Worker Group (Large)
Large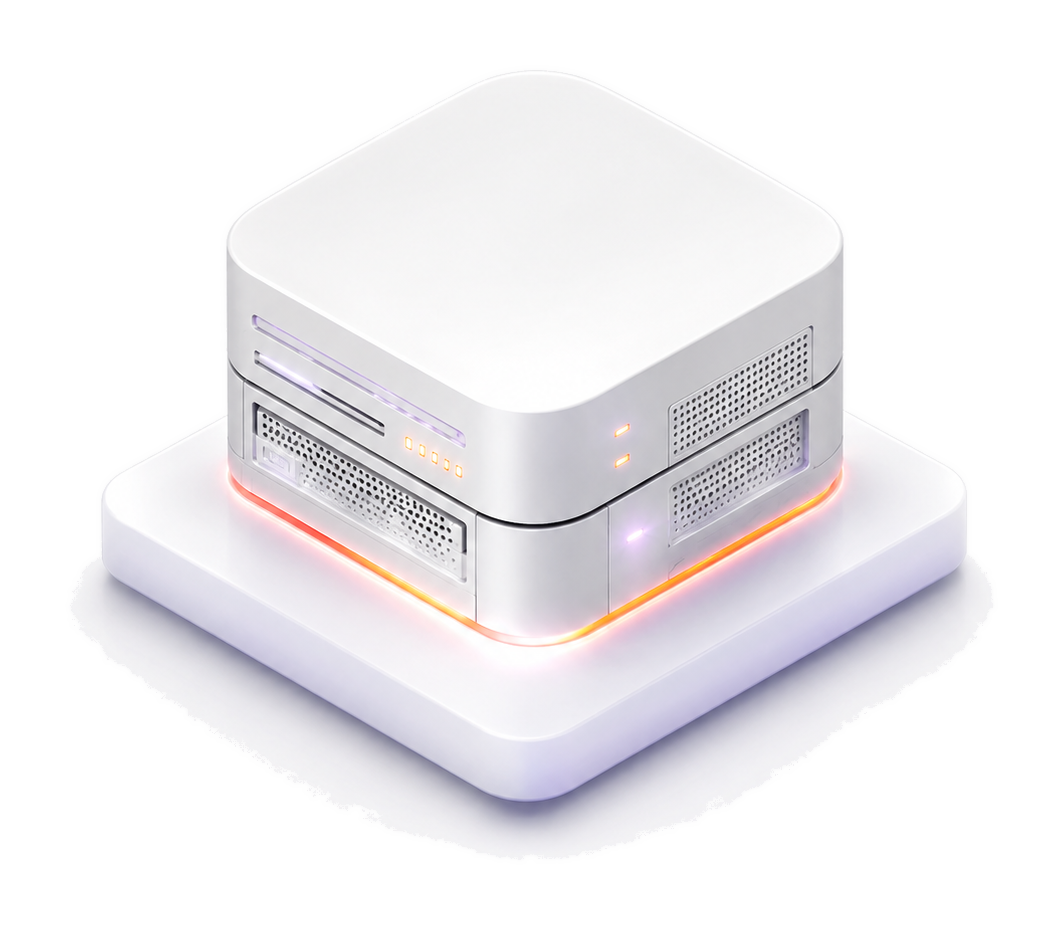
32 cores
¥6,000
/ monthUp to 100 million samples and 50 concurrent queries

Incident Management

Platform

AI
Dedicated compute
Dedicated compute keeps concurrent queries stable and complex analysis fast.
Learn moreDedicated compute
Dedicated compute keeps concurrent queries stable and complex analysis fast.
Learn moreIf you are evaluating Guance for your team, start with the observability platform overview or review the unified observability solution before selecting a plan.
Free Plan
The Free Plan gives individual developers and small teams the core observability capabilities they need to start monitoring without an upfront platform fee.
Infrastructure Monitoring
Monitor hosts, containers, Kubernetes, and other infrastructure for up to 10 hosts.

10,000 metric series / day
Log Management & Analytics
Search and correlate business logs to investigate anomalies and incidents.
10 million log records / day
APM & LLM Observability
Trace services end to end and identify latency, errors, and application performance bottlenecks.
20,000 Traces / day
Real User Monitoring (RUM)
Analyze user journeys, page performance, and session paths across web and mobile experiences.
5,000 PV / day
Session Replay
Reproduce user journeys with privacy controls and correlate them with frontend errors and requests.
2,000 Sessions / day
Synthetic Monitoring
Test websites, APIs, DNS, and network availability from global locations.
200,000 tests / day
Monitoring & Alerting
Create monitors and route actionable alerts through multiple notification channels.
10 monitors
Data Retention
Retain and query data for recent investigations and troubleshooting.
7-day rolling retention
Commercial Plan
The Commercial Plan uses pay-as-you-go pricing. Charges are calculated from actual usage across infrastructure metrics, logs, data forwarding, Triggers, RUM page views, APM traces, Synthetic Tests, and notification services.
Metrics from hosts, containers, Kubernetes, and cloud resources. Usage is measured by unique metric-and-tag combinations.
¥0.6
Per 1,000 metric series / day
Logs, events, security checks, and synthetic test data, billed by daily record volume.
¥1
Per 1 million records / day
Long-term log retention for historical investigation, audit analysis, and post-incident review.
¥0.007
Per GB / day
Network data reported by hosts for service connectivity, traffic, and performance analysis.
¥2
Per host reporting network data / day
Application traces and Profiles for service dependency, latency, error, and code-level performance analysis.
¥2
Per 1 million Traces / day
¥0.2
Per 10,000 Profiles / day
API tests executed by Synthetic Monitoring to verify service availability and response performance.
¥1
Per 10,000 API tests / day
Page views from real user sessions, including related Resource, Long Task, Error, and Action data.
¥0.7
Per 10,000 PV / day
Sessions that generate replay data, identified by session_id with has_replay set to true.
¥2.5
Per 1,000 Sessions / day
Executions generated by anomaly detection, metric generation, and other automated tasks.
¥1
Per 10,000 triggers / day
Scheduled dashboard reports generated and sent from the workspace each day.
¥1
Per report / day
Original traffic scanned by sensitive-data rules, billed for each field processed by a masking rule.
¥0.1
Per GB / day
Traffic forwarded to external archives, billed separately for public and private network transfer.
¥1.6
Per GB / day / public network
¥0.6
Per GB / day / private network
Raw data traffic processed by Central Pipeline parsing and transformation rules.
¥0.05
Per GB / day
Operations and security log traffic scanned for abnormal behavior and threat detection.
¥0.3
Per GB / day
New error records associated and reported to the Error Tracking center each day.
¥0.14
Per 1,000 errors / day
Phone notifications sent for alerts and incidents.
¥0.6
Per call / day
SMS messages sent for alert and incident notifications.
¥1
Per 10 messages / day
Metrics from hosts, containers, Kubernetes, and cloud resources. Usage is measured by unique metric-and-tag combinations.
¥1.6
Per 1,000 metric series / day
Logs, events, security checks, and synthetic test data, billed by daily record volume.
¥2
Per 1 million records / day
Long-term log retention for historical investigation, audit analysis, and post-incident review.
¥0.014
Per GB / day
Network data reported by hosts for service connectivity, traffic, and performance analysis.
¥4
Per host reporting network data / day
Application traces and Profiles for service dependency, latency, error, and code-level performance analysis.
¥6
Per 1 million Traces / day
¥0.4
Per 10,000 Profiles / day
API tests executed by Synthetic Monitoring to verify service availability and response performance.
¥10
Per 10,000 API tests / day
Page views from real user sessions, including related Resource, Long Task, Error, and Action data.
¥2
Per 10,000 PV / day
Sessions that generate replay data, identified by session_id with has_replay set to true.
¥2.5
Per 1,000 Sessions / day
Executions generated by anomaly detection, metric generation, and other automated tasks.
¥2
Per 10,000 triggers / day
Scheduled dashboard reports generated and sent from the workspace each day.
¥2
Per report / day
Original traffic scanned by sensitive-data rules, billed for each field processed by a masking rule.
¥0.2
Per GB / day
Traffic forwarded to external archives, billed separately for public and private network transfer.
¥3.2
Per GB / day / public network
¥1.2
Per GB / day / private network
Raw data traffic processed by Central Pipeline parsing and transformation rules.
¥0.084
Per GB / day
Operations and security log traffic scanned for abnormal behavior and threat detection.
¥0.6
Per GB / day
New error records associated and reported to the Error Tracking center each day.
¥0.28
Per 1,000 errors / day
Phone notifications sent for alerts and incidents.
¥0.84
Per call / day
SMS messages sent for alert and incident notifications.
¥7
Per 10 messages / day
Prices shown use the minimum data-retention period. Some billing items change when you select a longer retention period.View detailed pricing
Enterprise Plan
The Enterprise Plan is designed for high-volume data and complex architectures, with dedicated query compute, elastic scaling, physical isolation, and tailored deployment options.

The Enterprise Plan supports high-ingest workloads, complex data architectures, long retention periods, and large teams while preserving the performance and continuity of existing systems.

Set retention and hot or cold storage policies independently for each data type, then adjust them as workload and compliance requirements change.
Dedicated data, compute, and storage resources prevent noisy-neighbor interference and support enterprise security, compliance, and availability requirements.

Dedicated query compute scales with demand to preserve response performance during complex analysis and reduce unnecessary capacity during quieter periods.
 Plan options

Standard Enterprise Plan
Pay as you go and scale with your workload.

Managed Enterprise Plan
Dedicated infrastructure managed for your organization.
Provides a dedicated Worker Group for critical queries and high-concurrency analysis, delivering more stable performance and faster query response times.
Worker Group (Large)
Large32 cores
Up to 100 million samples and 50 concurrent queries
Worker Group (XLarge)
XLarge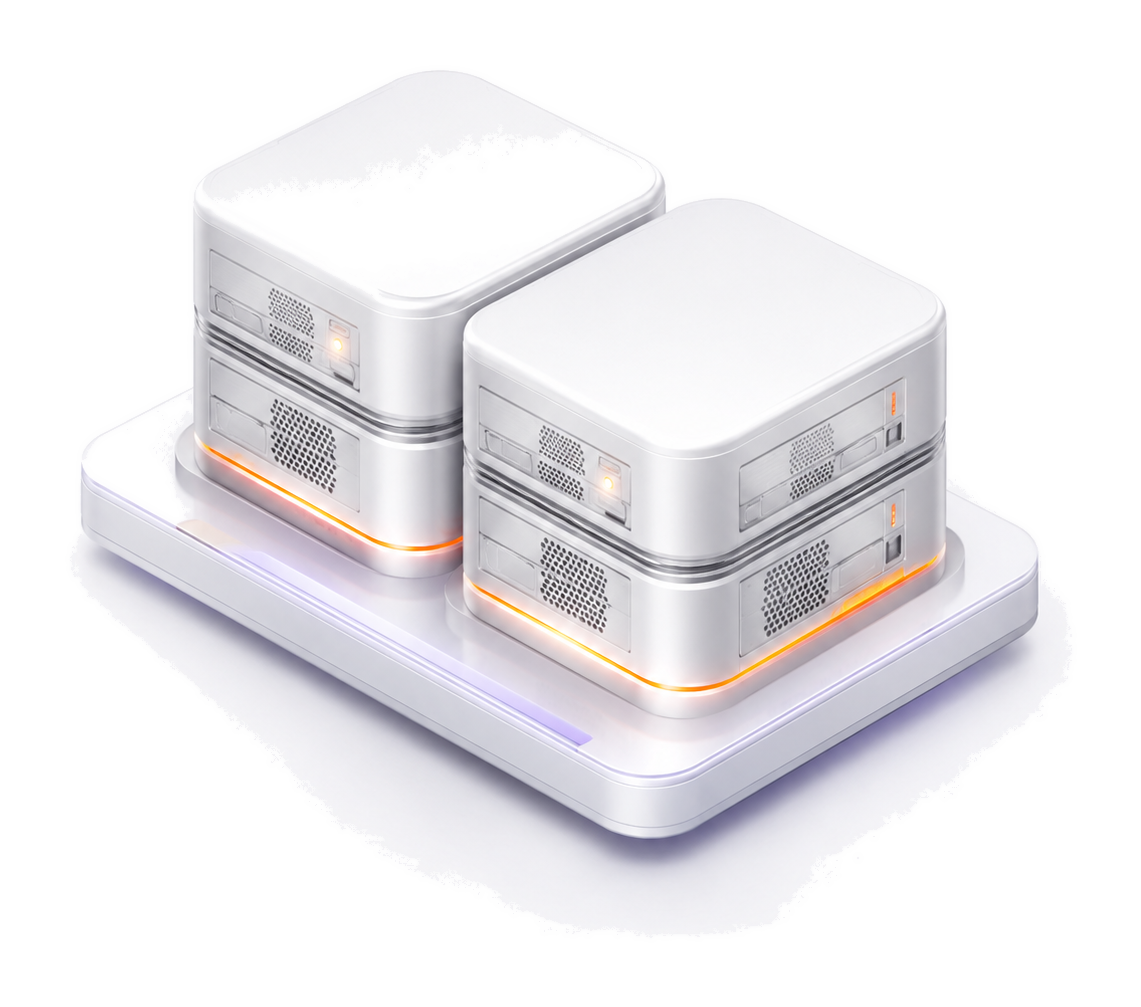
2 × 32 cores
Up to 200 million samples and 100 concurrent queries
Worker Group (4XLarge)
4XLarge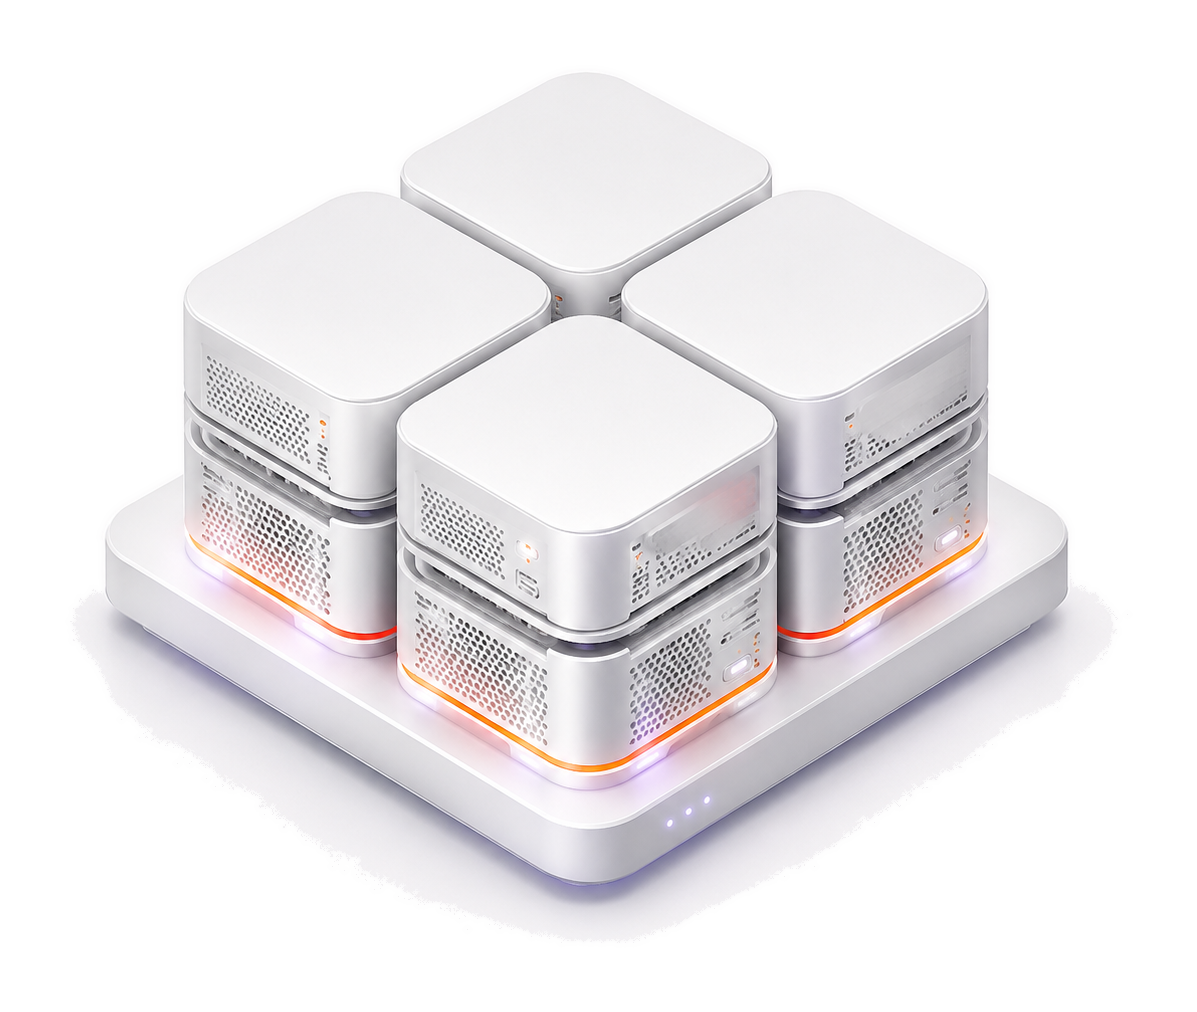
4 × 32 cores
Up to 1 billion samples and 100 concurrent queries
Worker Group (8XLarge)
8XLarge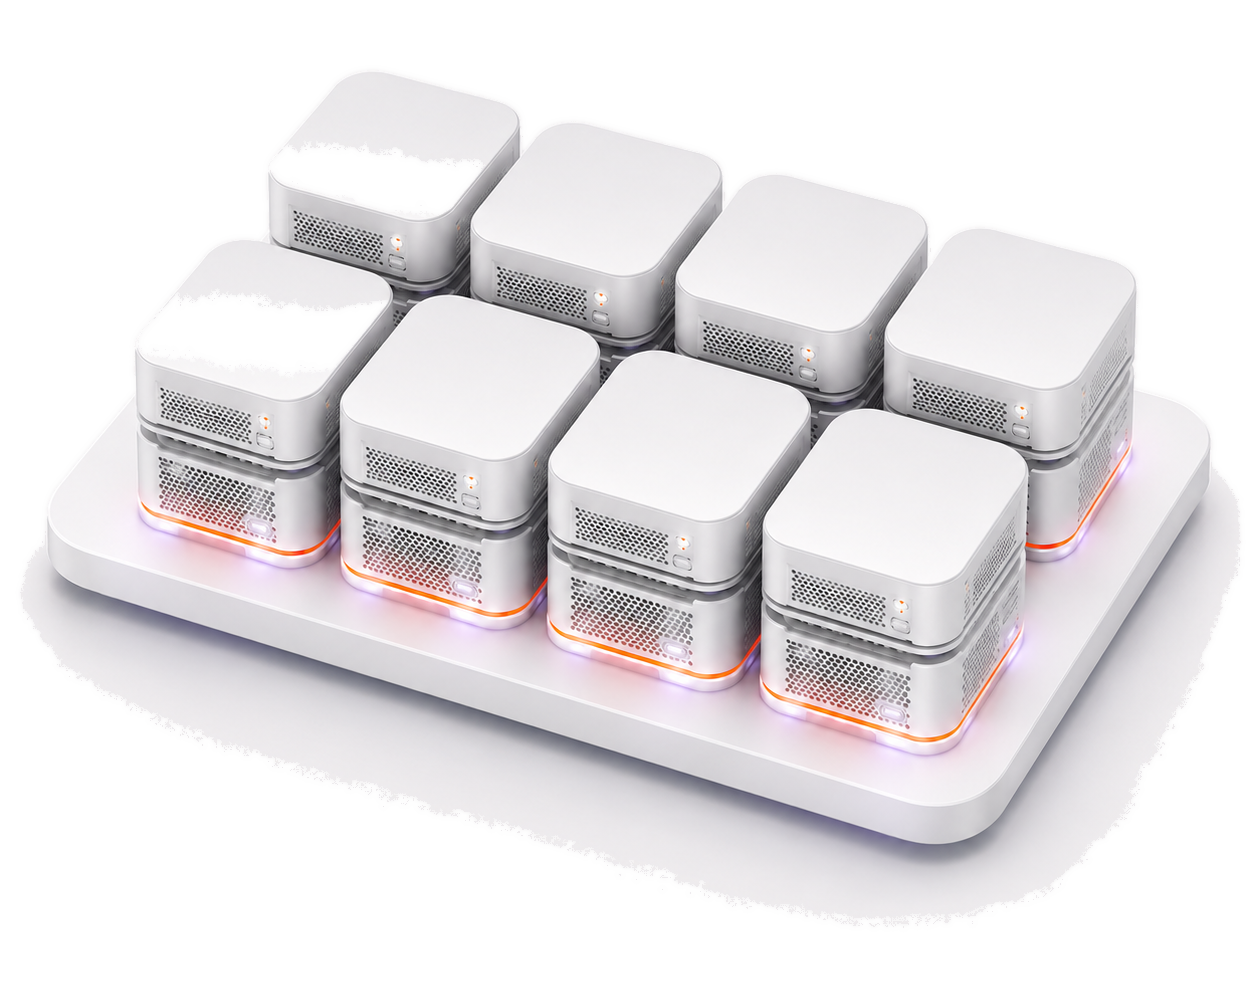
8 × 32 cores
Up to 2 billion samples and 200 concurrent queries
Define peak periods to automatically double the base compute capacity. Additional nodes are billed at 50% of the selected specification price.


Enterprise Plan pricing is tailored to your workload and deployment requirements. Contact sales for a quote.
One account, shared Credits, and plans sized for every AI Agent team.
Enterprise-grade observability AI Agents for SRE, DevOps, security, testing, and FinOps teams.
1 AI Agent
Free
Up to 3 AI Agents
¥999 / month
Up to 10 AI Agents
¥2999 / month
Custom AI Agent capacity
Contact sales


Uses the current dashboard, monitor, log, or analysis view as context to help teams query, interpret, summarize, and create.
Included benefits
Core help features are free, including documentation Q&A, guided queries, troubleshooting search, title generation, intent recognition, and permission checks.

Use Credits for advanced Copilot analysis and Agent tasks, including DQL generation, data analysis, and root cause analysis.


When included Credits are depleted, you can enable pay-as-you-go usage.
Model calls, searches, and tool execution are billed by actual Credits consumed.
¥0.25/ 10 credits
View billing details
Choose the right support plan for your team
Support plan
 Standard Support
 Enterprise Support
Coverage
Pre-sales guidance and post-sales technical support
Pre-sales guidance and post-sales technical support
Support channels
Online support through a dedicated customer group
Support tickets
Customer support hotline
Online support through a dedicated customer group
Dedicated service manager
Support tickets
Customer support hotline
Regular technical reviews, product updates, and best-practice guidance
Support hours
8 hours a day, 5 days a week (9:00–18:00)
24/7 support
Initial response time
1. Critical: service unavailable — response within 1 hour
2. High: service degradation or partial feature outage — response within 4 hours
3. Standard: non-critical technical questions, usage guidance, or feature requests — response within 12 hours
1. Critical: service unavailable — response within 30 minutes
2. High: service degradation or partial feature outage — response within 1 hour
3. Standard: non-critical technical questions, usage guidance, or feature requests — response within 2 hours
Documentation
Full access
Full access
Pricing
Included with the product plan
8% of the monthly product fee, with a three-month minimum. Contact sales for the regional minimum.
Consulting & Implementation Services
Coverage
1. Observability Strategy & Implementation:
Assess your current environment and goals, then design the technical architecture, data collection, infrastructure and application monitoring, business monitoring, dashboards, and alerting strategy.
Get expert support from issue identification and analysis through remediation, validation, and post-incident review.
Design dashboards, monitors, and notification workflows around your business SLOs and operating requirements.
Build team capability through observability fundamentals, availability assessment, SLA management, and hands-on guidance for development, operations, and testing.
Pricing
 Consulting specialist: contact sales for regional pricing
 Implementation specialist: contact sales for regional pricing
Additional services

Observability architecture design

Custom observability dashboards

Professional internet operations services
Additional services