CUSTOMER STORY

Connect system evidence to shorten the path to a diagnosis

ABOUT CHANGAN

About the customer

Changan Automobile is a global mobility technology company whose business spans the development, manufacture, sale, and servicing of passenger, commercial, and new energy vehicles. Its growing automotive and digital services connect multiple business systems and technical teams, making reliable operations and coordinated resource management essential.

Automotive Industry
Vehicles and mobility Business focus
R&D, production, sales Serves

The challenge

One business issue, several places to investigate

Changan Auto's digital operations span multiple systems. A slow response may involve an application, a data component, or the underlying infrastructure. Separate monitoring tools left teams working out which layer to investigate first.

Collection methods and field definitions varied between systems. Comparing logs, metrics, and requests for the same period required extra data gathering and explanations between teams.

Business leaders needed to understand service health and resource use. Separate dashboards answered local questions but made it harder to prioritize issues across systems.

KEY RESULTS

25%

Expected reduction: Fault diagnosis time

20%

Expected reduction: Cross-team investigation hours

15%

Expected reduction: Monitoring maintenance effort

SOLUTION

Changan Automobile × Guance — Solution

01

Standardize the data before connecting the evidence

Common collection rules and object labels organize logs, metrics, and traces by service, environment, and time. Investigators can follow a lead into related records without starting a fresh search in every tool.

15%

Expected reduction: Monitoring maintenance effort

02

Trace application symptoms to individual components

Application traces connect to infrastructure and data-component health. Teams can compare service latency, component errors, and resource changes to narrow the causes that need checking.

25%

Expected reduction: Fault diagnosis time

03

Make service-health dashboards a place to collaborate

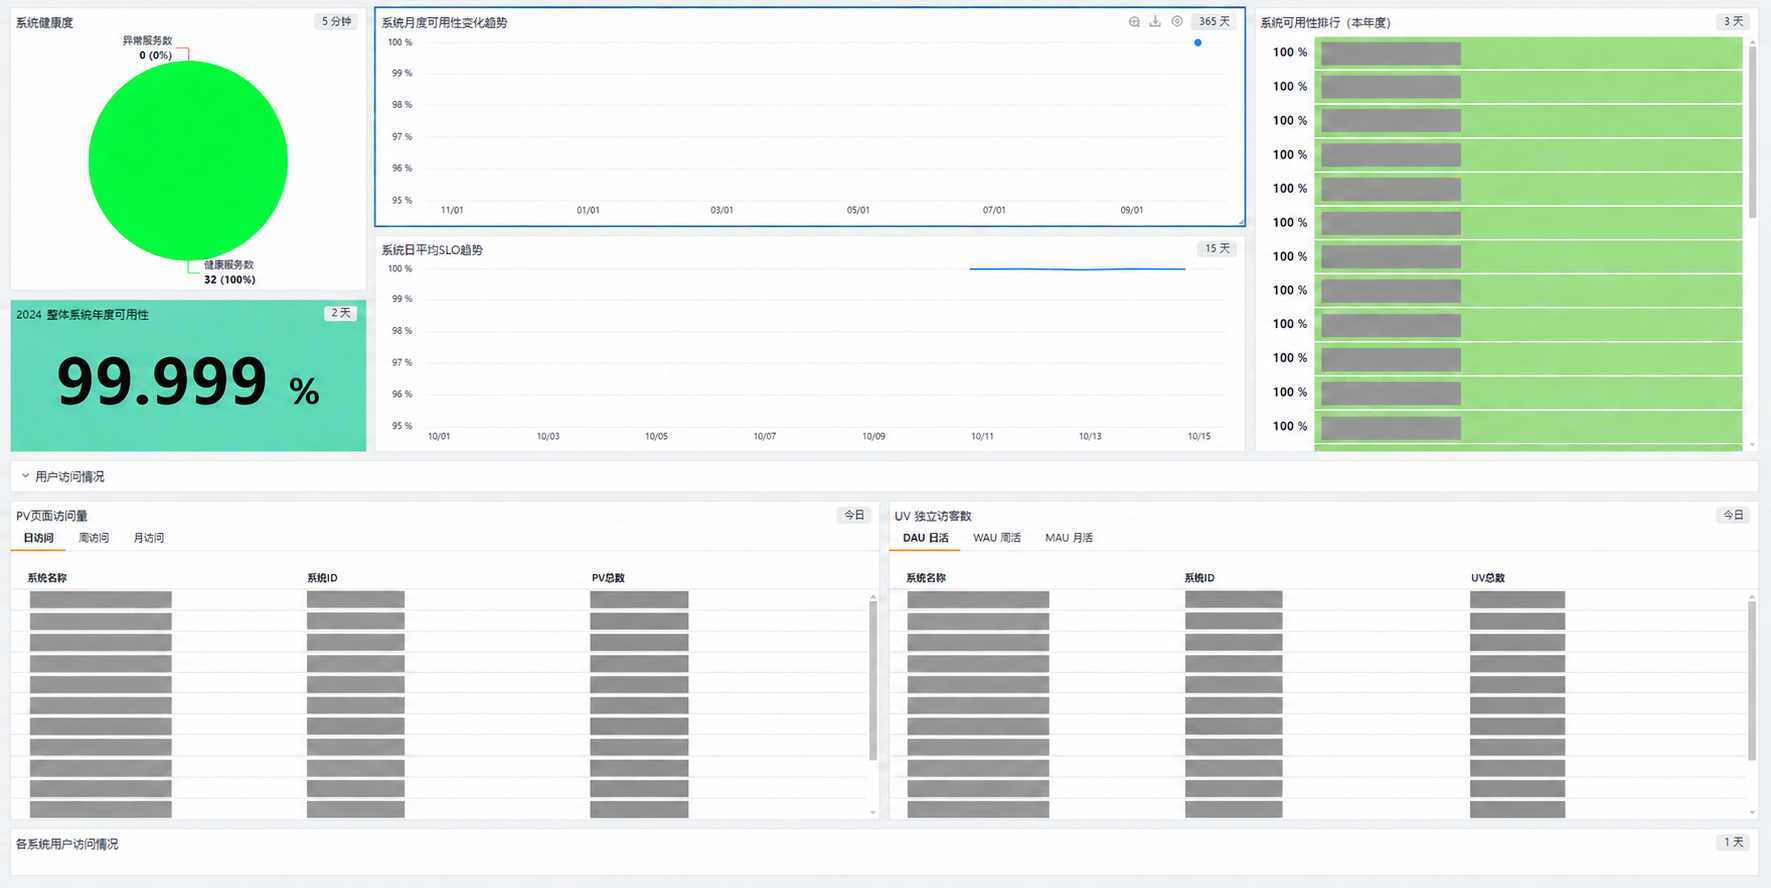
Authorized views bring together availability, response time, errors, and resource use. Business owners assess impact while technical teams drill into the evidence, using the same operational picture.

20%

Expected reduction: Cross-team investigation hours

Business availability and user traffic dashboard

BUSINESS IMPACT

Spend more time resolving issues and make resource decisions with evidence

01

Less preparation before troubleshooting

A common data entry point and consistent fields reduce the need to collect separate screenshots and logs before testing a cause.

02

Clearer priorities across systems

Service health and technical indicators help distinguish a local fluctuation from a business issue, so teams can focus their response.

03

A record for reviewing capacity changes

Capacity, utilization, and performance trends can be reviewed together, giving configuration decisions a basis beyond experience alone.

Build observability around your business

Work with Guance to connect telemetry, investigate service issues, and give teams shared operational context.