Headquartered in Finland, KONE provides elevators, escalators, automatic doors, maintenance and modernization services. Its people-flow solutions connect buildings with everyday urban life. At the end of 2025, KONE employed more than 60,000 people across close to 70 countries.
Elevators & escalatorsIndustry60,000+Employees worldwide, end of 2025FinlandHeadquarters
“
After integrating Guance, we had a real-time monitoring system for our digital maintenance business. … Data was fully connected between our operations and development departments.
BUSINESS CHALLENGES
Connect equipment state with application issues
Finding the requests, components and business impact behind an alert requires connected operating data. KONE needed an investigation path that its fragmented monitoring could not consistently provide.
01
Fragmented investigation
Engineers had to inspect performance, application behavior and logs separately, repeatedly aligning timestamps and affected objects.
02
Business-specific monitoring
Equipment and digital services have their own operating dimensions. Custom collection and alerting were needed beyond standard infrastructure metrics.
03
Searchable log evidence
Different log formats and fields needed parsing and consistent presentation so records could be related to alerts and application calls.
KEY RESULTS
30%↓
Expected reduction in fault investigation time
25%↓
Expected reduction in incident response time
20%↓
Expected reduction in business-log preparation hours
Xu LubaoDigital Operations Engineer, KONE
CUSTOMER INTERVIEW
How KONE connects fragmented operating data
Xu Lubao, Digital Operations Engineer at KONE, shares the team’s experience with Guance.
SOLUTION
KONE × Guance — Solution
01
Connect experience, traces and logs
RUM, APM and logs are brought into Guance together. Engineers can start with a user-visible issue and follow related requests, services and logs without rebuilding the context at each step.
30%↓
Expected reduction in fault investigation time
02
Add business collection with DataFlux Func
Programmable collection and alert scripts bring equipment and business state into monitoring, allowing investigation to continue beyond standard resource metrics.
25%↓
Expected reduction in incident response time
03
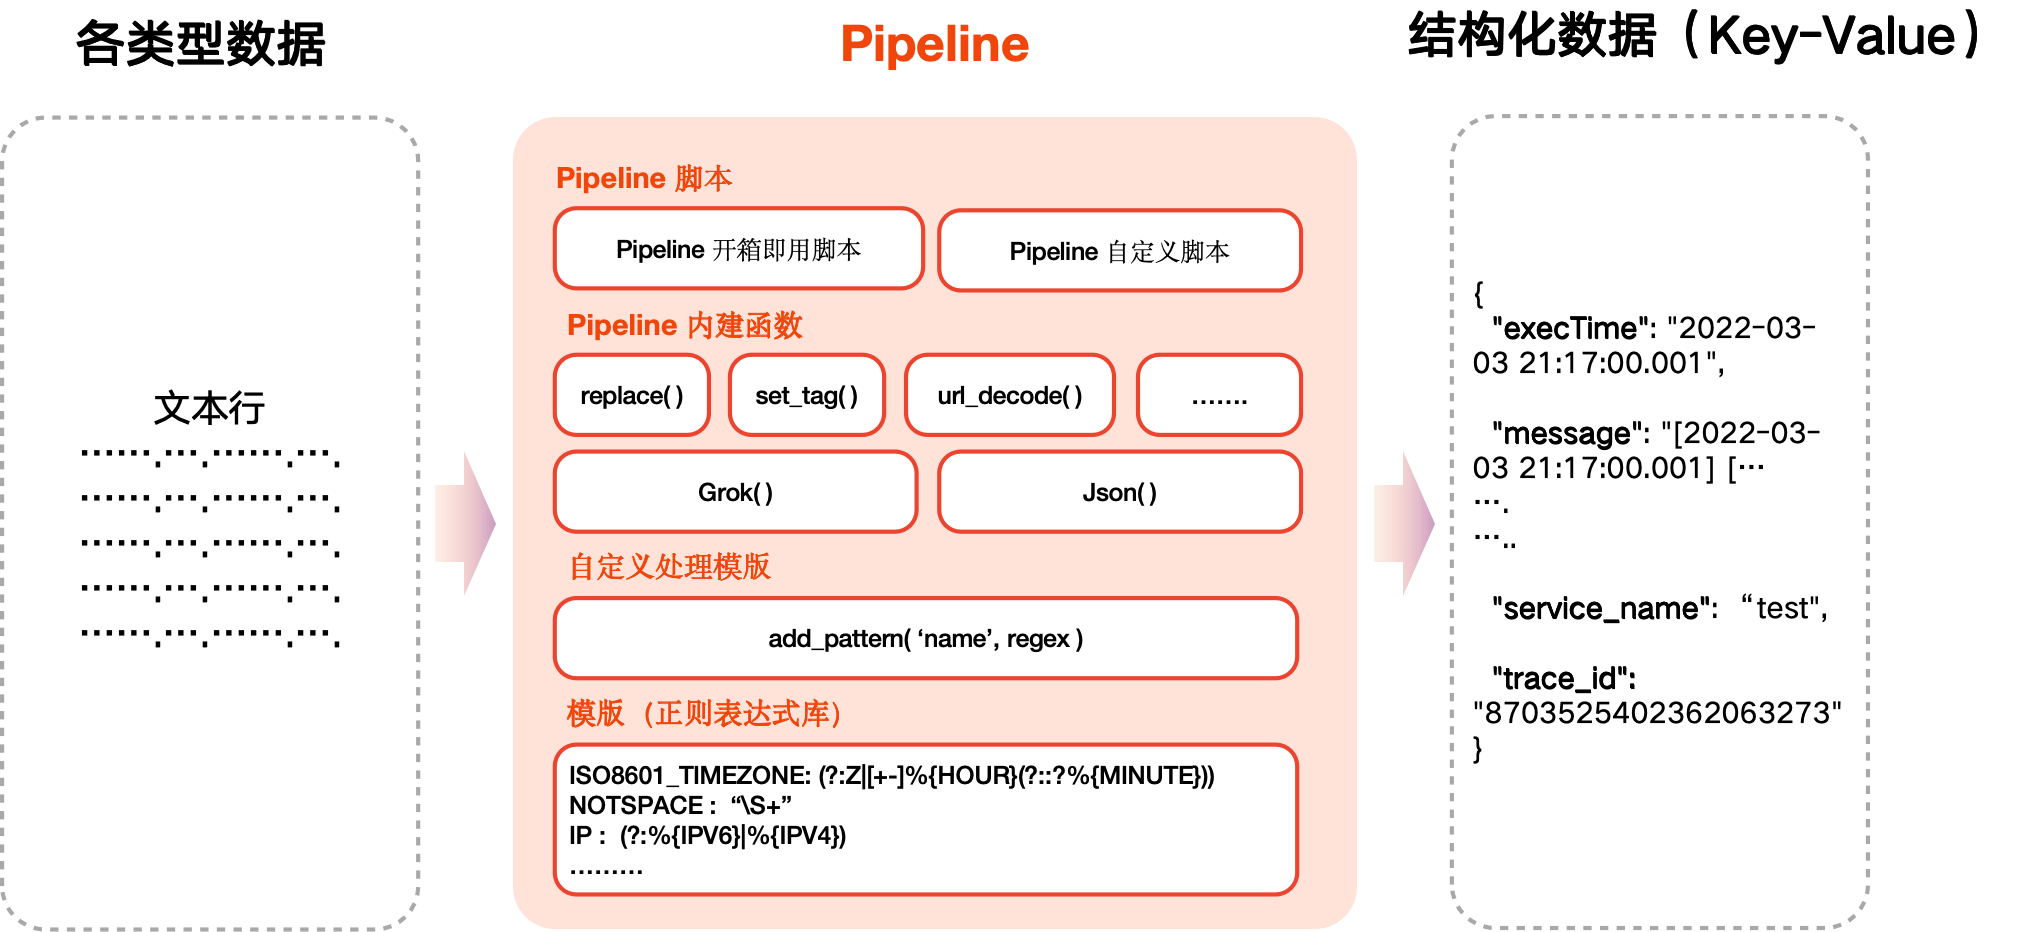
Turn logs into searchable business evidence
Parse formats, extract fields and present records consistently. Logs can then be investigated alongside alerts and traces to support both incident analysis and operational trends.
20%↓
Expected reduction in business-log preparation hours
LOG PROCESSINGTurn raw logs into searchable business fields
BUSINESS IMPACT
A common investigation path from experience to logs
01
Shared evidence across teams
Development and operations can inspect the same requests and records, reducing repeated searches and screenshot exchanges.
02
Answers to business-specific questions
Custom scripts add equipment and service dimensions to collection, analysis and alerts.
03
Context stays with the investigation
Central collection and parsing retain the relationships between alerts, application calls and original records.
Connect the evidence behind digital maintenance
Work with Guance specialists to plan equipment-service monitoring, application tracing and business-specific collection.