Morningstar Guance

Join real user experience, application traces, CDN checks, and device logs in one operating workflow

RUM and APM correlation
CDN availability checks
Network and security device logs

Customer context

Morningstar Information Services (Shenzhen) is part of Morningstar’s operations in China and supports digital financial-information services. The published customer story describes a local team that needed an observability platform workable within its network, access-control, and day-to-day operating conditions.

A global tool did not map cleanly to the local workflow

Network conditions, permissions, and established working practices limited the local team’s use of the headquarters platform, creating a need for an operable local observability entry point.

A global tool did not map cleanly to the local workflow

CDN experience lacked end-to-end evidence

When access was slow or unsuccessful, the team needed to separate frontend, backend API, CDN availability, and request-log causes rather than rely on one isolated signal.

CDN experience lacked end-to-end evidence

Implementation

Connect a user session to the backend request path

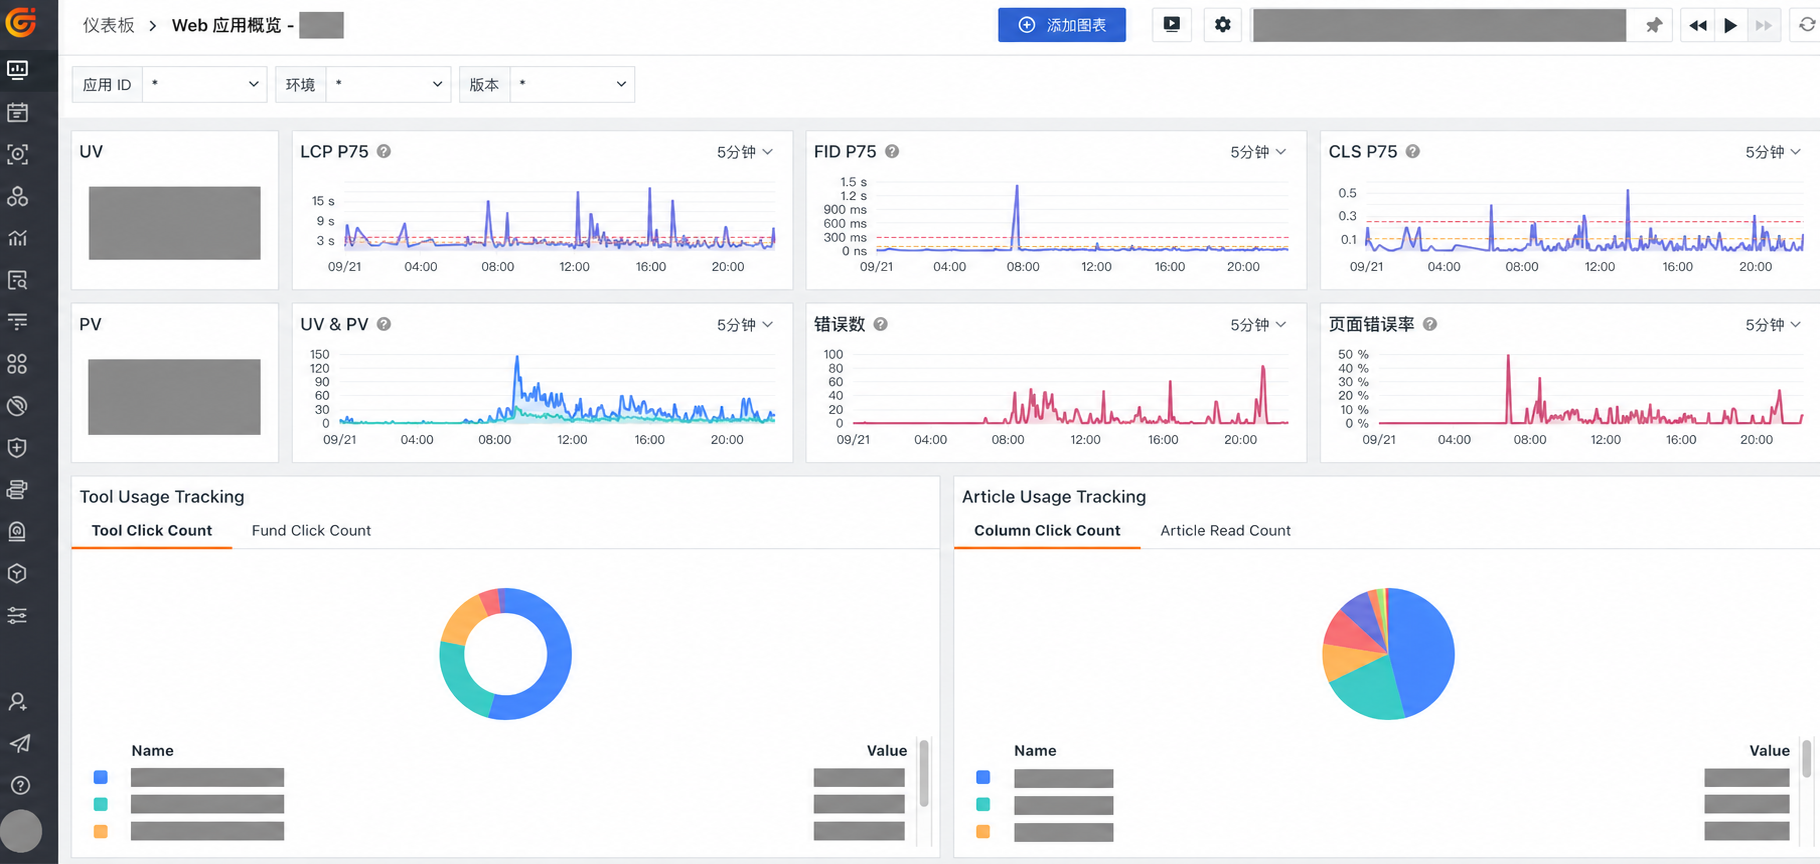
Morningstar used RUM and APM to connect frontend visits with backend requests, placing page-load delays, API failures, and service processing time in the same user and request context.

Connect a user session to the backend request path

Observe the CDN with checks, logs, and dashboards

Availability checks from different locations supplied response-time and success signals. CDN request logs and dashboards added operating context such as cache-hit and bandwidth trends.

Centralise Syslog from network and security devices

Syslog from routers, switches, firewalls, and other devices entered a shared log pipeline for field parsing, search, and alerts, reducing movement between device-specific tools.

What changed

User-experience issues gained end-to-end context

Teams could start from a real visit and inspect the related API, service, and log evidence to distinguish frontend, network, CDN, and backend causes.

CDN decisions gained observable runtime evidence

Check results, request logs, and operating metrics shared one view for configuration review and service evaluation.

Device logs joined the application timeline

Network and security device logs could be reviewed with application, infrastructure, and alert context instead of remaining an isolated operations stream.

Frequently asked questions

Why did the Morningstar story use both RUM and APM?

RUM captures a real visit while APM follows the backend service path. Correlating them helps distinguish page, API, service, and dependency causes for a slow or failed experience.

How was CDN availability observed?

The published story describes checks from different locations combined with CDN request logs and dashboards for response time, success state, cache-hit, and bandwidth signals.

How did device Syslog enter the investigation?

Network and security device Syslog was collected, parsed, searched, and alerted on centrally so device events could be aligned with application and infrastructure timelines.

More customer stories