Yang Guo Fu Guance

Connect metrics, logs, and traces across apps, mini programmes, web, POS, and store systems

Multi-channel observability
DataKit and Pipeline
Technical-to-business correlation

Customer context

Yang Guo Fu is a Chinese quick-service restaurant brand operating in China and overseas. Its published story describes a distributed technology environment spanning store operations, supply-chain processes, and digital services.

Apps, WeChat mini programmes, web, and POS supported ordering, payment, inventory, and delivery workflows. When channel data remained separate, user reports, application anomalies, and store state could not form one operating view.

A lean team needed denser operating context

Operators needed fewer entry points for understanding service and infrastructure state across stores and regions.

A lean team needed denser operating context

Issue discovery depended on reactive reports

When a user or store reported an anomaly first, the technology team lacked continuous telemetry from before and after the event.

Issue discovery depended on reactive reports

App, mini-programme, web, and POS data were separate

Requests across channels and backend services could not be joined around one business flow, obscuring technical impact.

App, mini-programme, web, and POS data were separate

Implementation

Collect metrics, logs, and traces together

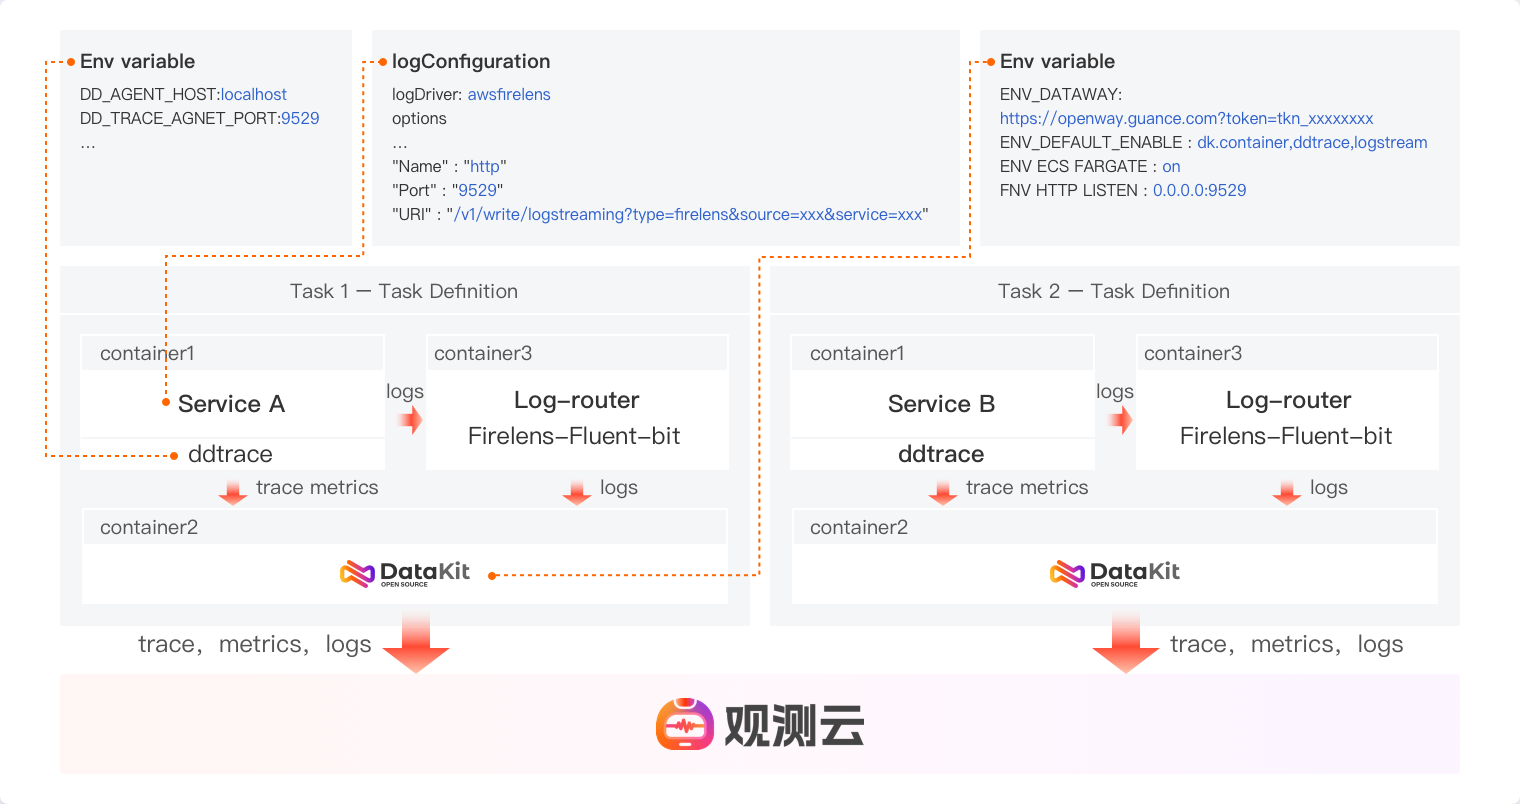
DataKit and Pipeline collected, processed, and normalised metrics, logs, and traces from different sources before analysis in one platform.

Collect metrics, logs, and traces together

Connect causes, performance baselines, and business impact

Object relationships and time context supported anomaly analysis, baseline review, and mapping technical signals to the affected business process.

Connect causes, performance baselines, and business impact

Start with prebuilt monitoring views

Views for common middleware, databases, and service frameworks provided a starting point that the team could adapt to its own architecture and business signals.

Start with prebuilt monitoring views

What changed

Alerts gained operating context

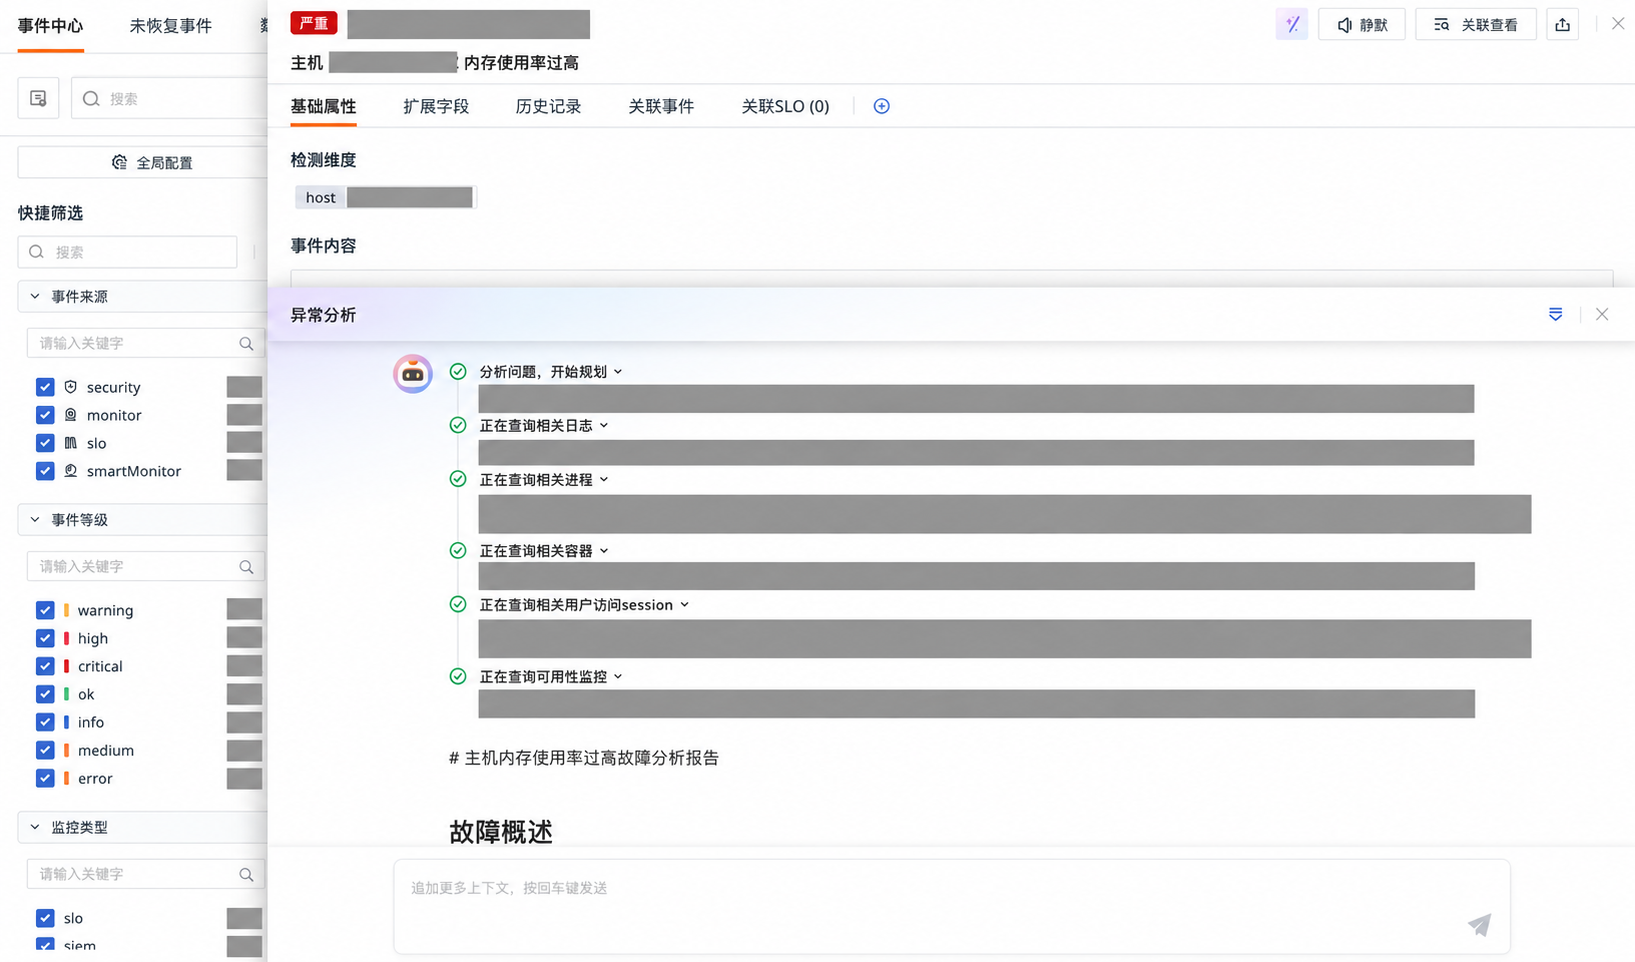
Anomalies could be reviewed with the relevant service, store system, and data source to assess likely impact.

Complex issues became easier to narrow

Connected metrics, traces, and logs let responders continue along the request and dependency path.

Regional system health entered a shared view

Technology and business dashboards exposed health and anomaly trends across channels.

Capacity discussions gained runtime evidence

Performance baselines and resource trends supplied reviewable evidence for capacity and configuration decisions.

Frequently asked questions

Why does a restaurant chain need multi-channel observability?

Apps, mini programmes, web, and POS can use different networks, services, and data dependencies. Correlation across user, application, and resource signals shows which business step an anomaly affected.

What do DataKit and Pipeline do in this story?

DataKit collects telemetry from different sources. Pipeline parses, cleans, and normalises fields so metrics, logs, and traces can be queried through consistent dimensions.

Does a prebuilt dashboard directly represent business health?

No. A prebuilt view is a starting point. It still needs configuration and validation against the actual service topology, store workflow, thresholds, and business indicators.

More customer stories